
Stock Personality: Tight and Orderly vs. Wide and Loose

Ross
Ross is a co-founder of TraderLion and Deepvue. He was mentored by William O’Neil, and co-authored The Model Book of Greatest Stock Market Winners at WON + Co.
Published: September 11, 2026


I started buying stocks for a living in 1998 — retail broker before that — and back then, a stock's personality forced a trade-off. The liquid names that traded in a tight, orderly manner and respected logical support mostly didn't move much. A Hewlett-Packard, an IBM, a two- or three-letter NYSE symbol with a 16th or a 32nd in the middle of the spread: easy to manage risk on, and you didn't make much money doing it. The fast money lived in the whippier NASDAQ names, and you paid for it in volatility.
That changed in the late 90s, close to 30 years ago now. Today a mega-cap with a huge share count can run 100 to 150 percent in six months or less. That means you can now make a strict personality requirement—tight and orderly only—without sacrificing performance. That's the whole argument of this post, and it's become one of the hardest rules in my book. I won't take a full position in anything wide and loose, the way I might have 15 or 20 years ago.
And unlike most things on a chart, this one comes with a number attached.
Table of Contents
Ross Haber
Every new post, straight to your inbox
If this was useful, the next one will land in your inbox the day I write it.
Why a Stock's Personality Matters
During my years in institutional sales, running money, and traveling the country teaching workshops with Bill O'Neil, I noticed something about the positions Bill took real size in. The large, concentrated positions were always the same kind of stock: institutional quality, super liquid, tight and orderly. The names the biggest, most successful mutual funds and hedge funds were accumulating—which you can see for yourself in the forms filed with the SEC —and ride their coattails. In all that time, I never saw Bill put all of his money into a super volatile stock, especially one that wasn't liquid. The lesson I took from the master is hard to argue with: if you can't make money in the highest-quality, most liquid leaders that trade in a tight, orderly manner, how will you make money in anything else?
The practical reason is risk management. Everything about managing a position lives downstream of personality: your entry area, how many shares you buy, how concentrated the position is, and your sell stop. A stock that respects logical levels lets you place all four with precision. A stock that whips 10 percent a day turns every one of them into a guess.
And there's the part nobody talks about enough — sitting with the position. It doesn't matter if you're right if you can't hold on to your position. We've all been stopped out of a stock that went on to double, or sold something emotionally that ultimately went much higher. As a position trader and trend follower, tight, orderly stocks let me stay in the trade long enough for being right to matter.
What Tight and Orderly Means
Tight closes and relatively narrow ranges — for that particular stock. Visible respect for logical areas of support: prior swing highs, gaps, the tops of prior bases or consolidations, key moving averages. A visibly smooth trend with little whipsaw. How do you know? Look to the left. The chart already shows you its personality traits: how it trades, whether it's whippy above and below its key averages, whether every up day gets immediately retraced into sideways chop. I assume a stock will keep acting the way it has — keep respecting the same moving averages, keeping the same personality — until it doesn't.
The number I watch: 10- and 20-day ADR
For a quantifiable measure, I watch the 10-day and 20-day average daily range as a percentage. I find that 1 to 3 percent is typically super tight and orderly — that's where I want my full positions. Around 4 to 6 percent is "in between," and I'll look at those when they're super liquid leaders in a leading group. Approaching double digits is wide and loose, and it's not where my core money goes. However, I sometimes buy these stocks as performance enhancers, assuming their personality lets me manage risk.
What wide and loose looks like
Double-digit ADRs. A choppy trend with no clear respect for logical support — there's a general uptrend in there somewhere, but a lot of sideways whip on the way, which drives my brain crazy. It's much harder to get traction in those stocks and much harder to manage risk on them, and there's probably a good reason I never saw Bill invest in them.
But hear the rest of it: wide and loose doesn't mean wrong or bad. It means it doesn't mesh with my personality, my methodology, the way I look at things. If you're a swing trader or a day trader, the volatile, whippy names may be your bread and butter. There's no right way or wrong way — there's only what's right for you. If your equity curve runs from the bottom left to the top right in higher highs and higher lows, you're in great shape. This is exactly how a general system — CANSLIM®, Stan Weinstein's Stage Analysis, Darvas boxes — becomes your own: time, experience, and post-analysis. Review your best and worst trades, figure out what you keep doing wrong, and slowly turn the observations into rules. Personality became one of mine.
The Character Change
Here's where personality stops being a screening filter and becomes a sell signal — and it's also how I know when my read on a stock is wrong. Watch a leader's traits relative to itself during a run. A stock that has been trading nice and tight, then moves up 100-plus percent in a short amount of time, will often start to get wide and loose: chopping around, breaking short-term moving averages, whipping where it used to glide. That volatility usually means the stock needs to take a breather and go sideways for a while—if not correct entirely.
Monday-morning quarterbacking my own charts, the clue is almost always there before the damage. If you can just be OK with selling into strength one of those days after the action is clearly wide and loose — putting the money in the bank, or moving to wherever the rotation is going — it's typically a great idea. AMD below is the textbook case.
Tight and Orderly: AMD, CIBR, APA
AMD — 3.35% ADR, and a character change at the top
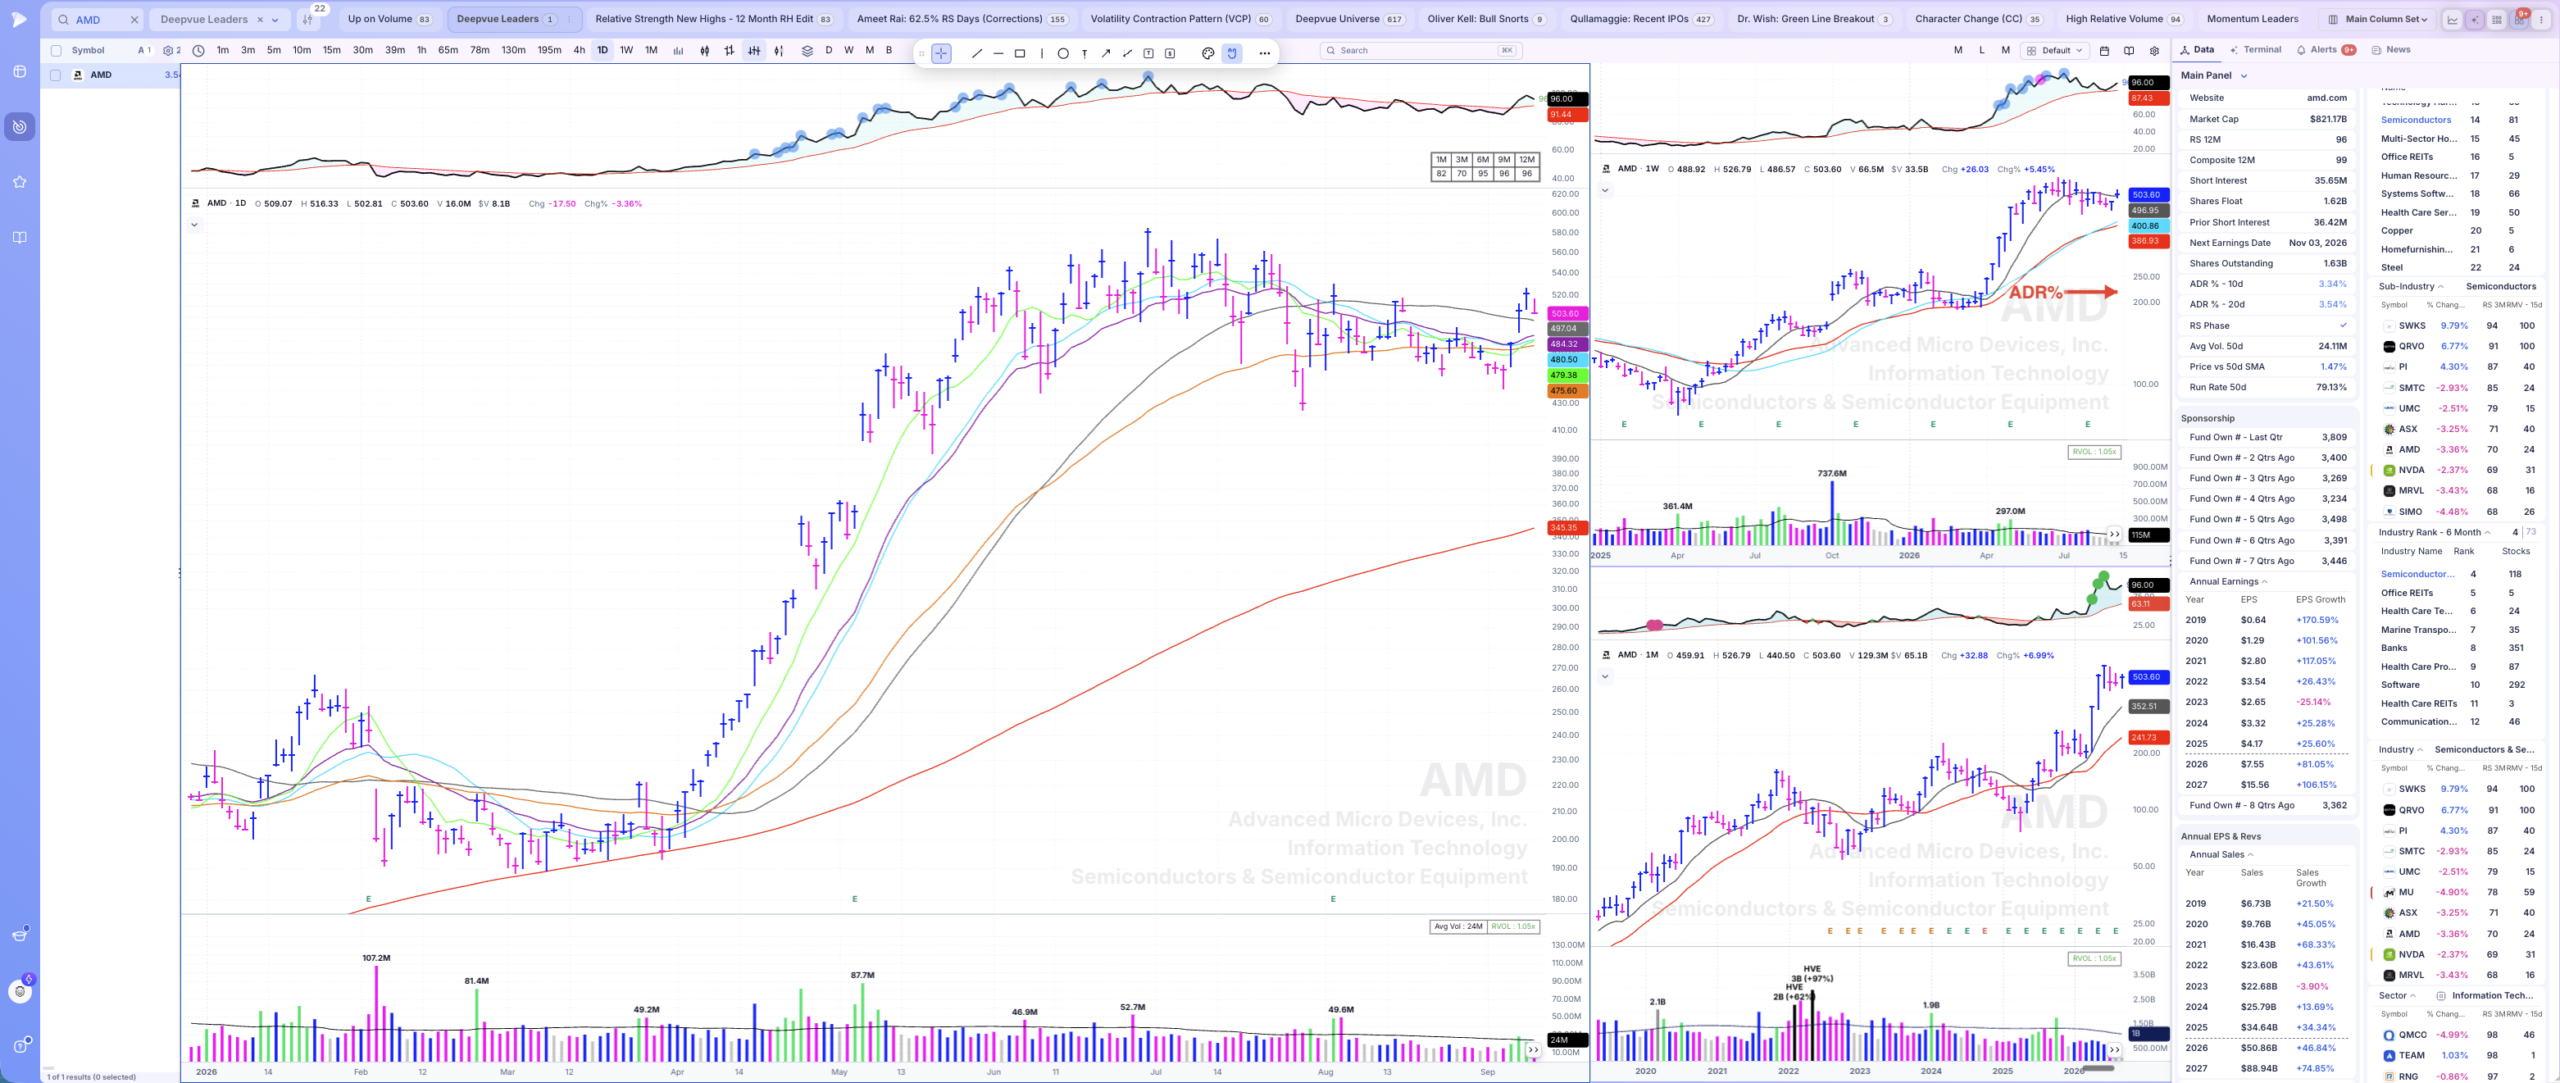
Clean above the 10-day the whole way up — then look at the action from $536 to $580. Same stock, different personality. That's the tell.
AMD's 10-day ADR sits at 3.35%, the 20-day at 3.58% — visibly tight and orderly, and a powerful performer. The stock went from roughly $195 on March 30th, 2026 to a little over $580 by June 30th. That is a heck of a move in three months for a mega-cap, with a 3% average daily range. This is the late-90s change in one chart: the strict personality requirement no longer costs you performance.
Put the chart on a logarithmic scale so every bar is visibly comparable — an arithmetic scale squishes prices to the left — and watch the personality shift. From the late-March breakout, the trend rode above the 10-day SMA almost the whole way. Then, as the stock found a high, the action from $536 to $580 and after turned significantly wider and looser: chopping below the 50-day, whipping where it used to glide. A character change. When a stock starts to break down like this, I use the double close below the 21-day SMA to work my way out of at least part of the position — and the clues were there. Now, in early September, AMD has put in a higher high and higher low and sits back above all of its moving averages, which are converging in a tight bunch to the upside. Worth respecting: it has already come a long way, so this is a later-stage base—more prone to failure—and position size should reflect that.
CIBR — 2.61% ADR and a 10-day that never broke
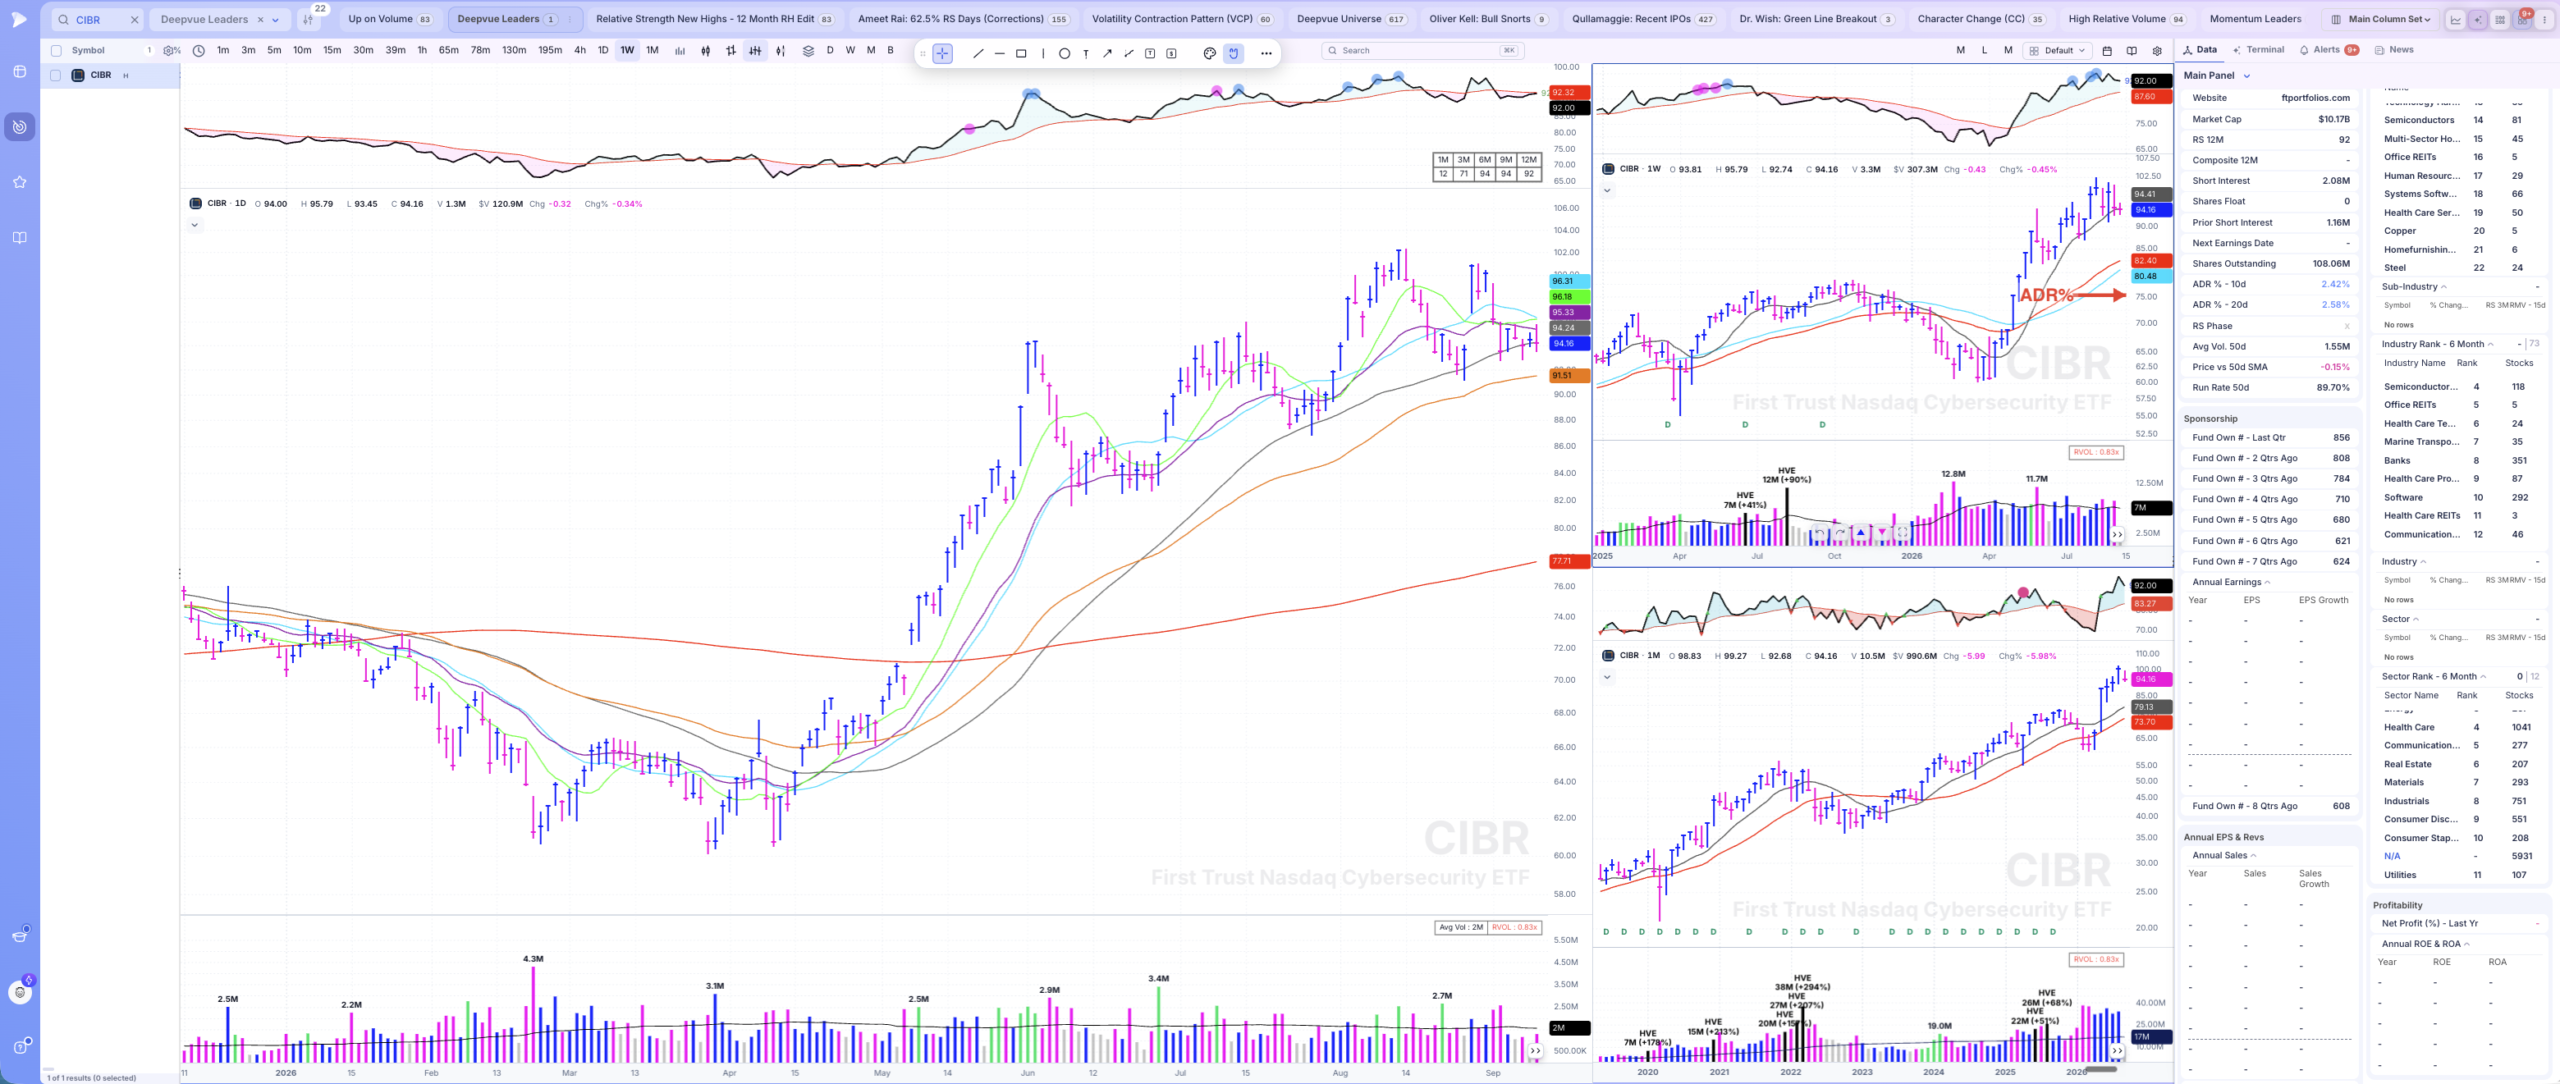
$61 to $94 without ever breaking the 10-day. You could have run the tightest exit rule in the book and kept the whole move.
CIBR, the cybersecurity ETF, runs a 2.61% 10-day ADR and 2.5% on the 20-day. From roughly $61 on April 10th, 2026, it hit $94 and change by June 1st, and after some less-smooth trading, a bit over $100 by August 13th. On the first leg, it never broke its 10-day SMA — you could have run a double-close-below-the-10-day rule, the tightest exit there is, and it would have worked incredibly well. Smooth trending, respects key support, and is currently made up of stocks that continue to lead the market. Now we wait to see whether this becomes an ascending base that holds the 50-day. Nobody knows; we shall see if cybersecurity holds up.
APA — 3.01% ADR with levels stacked overhead
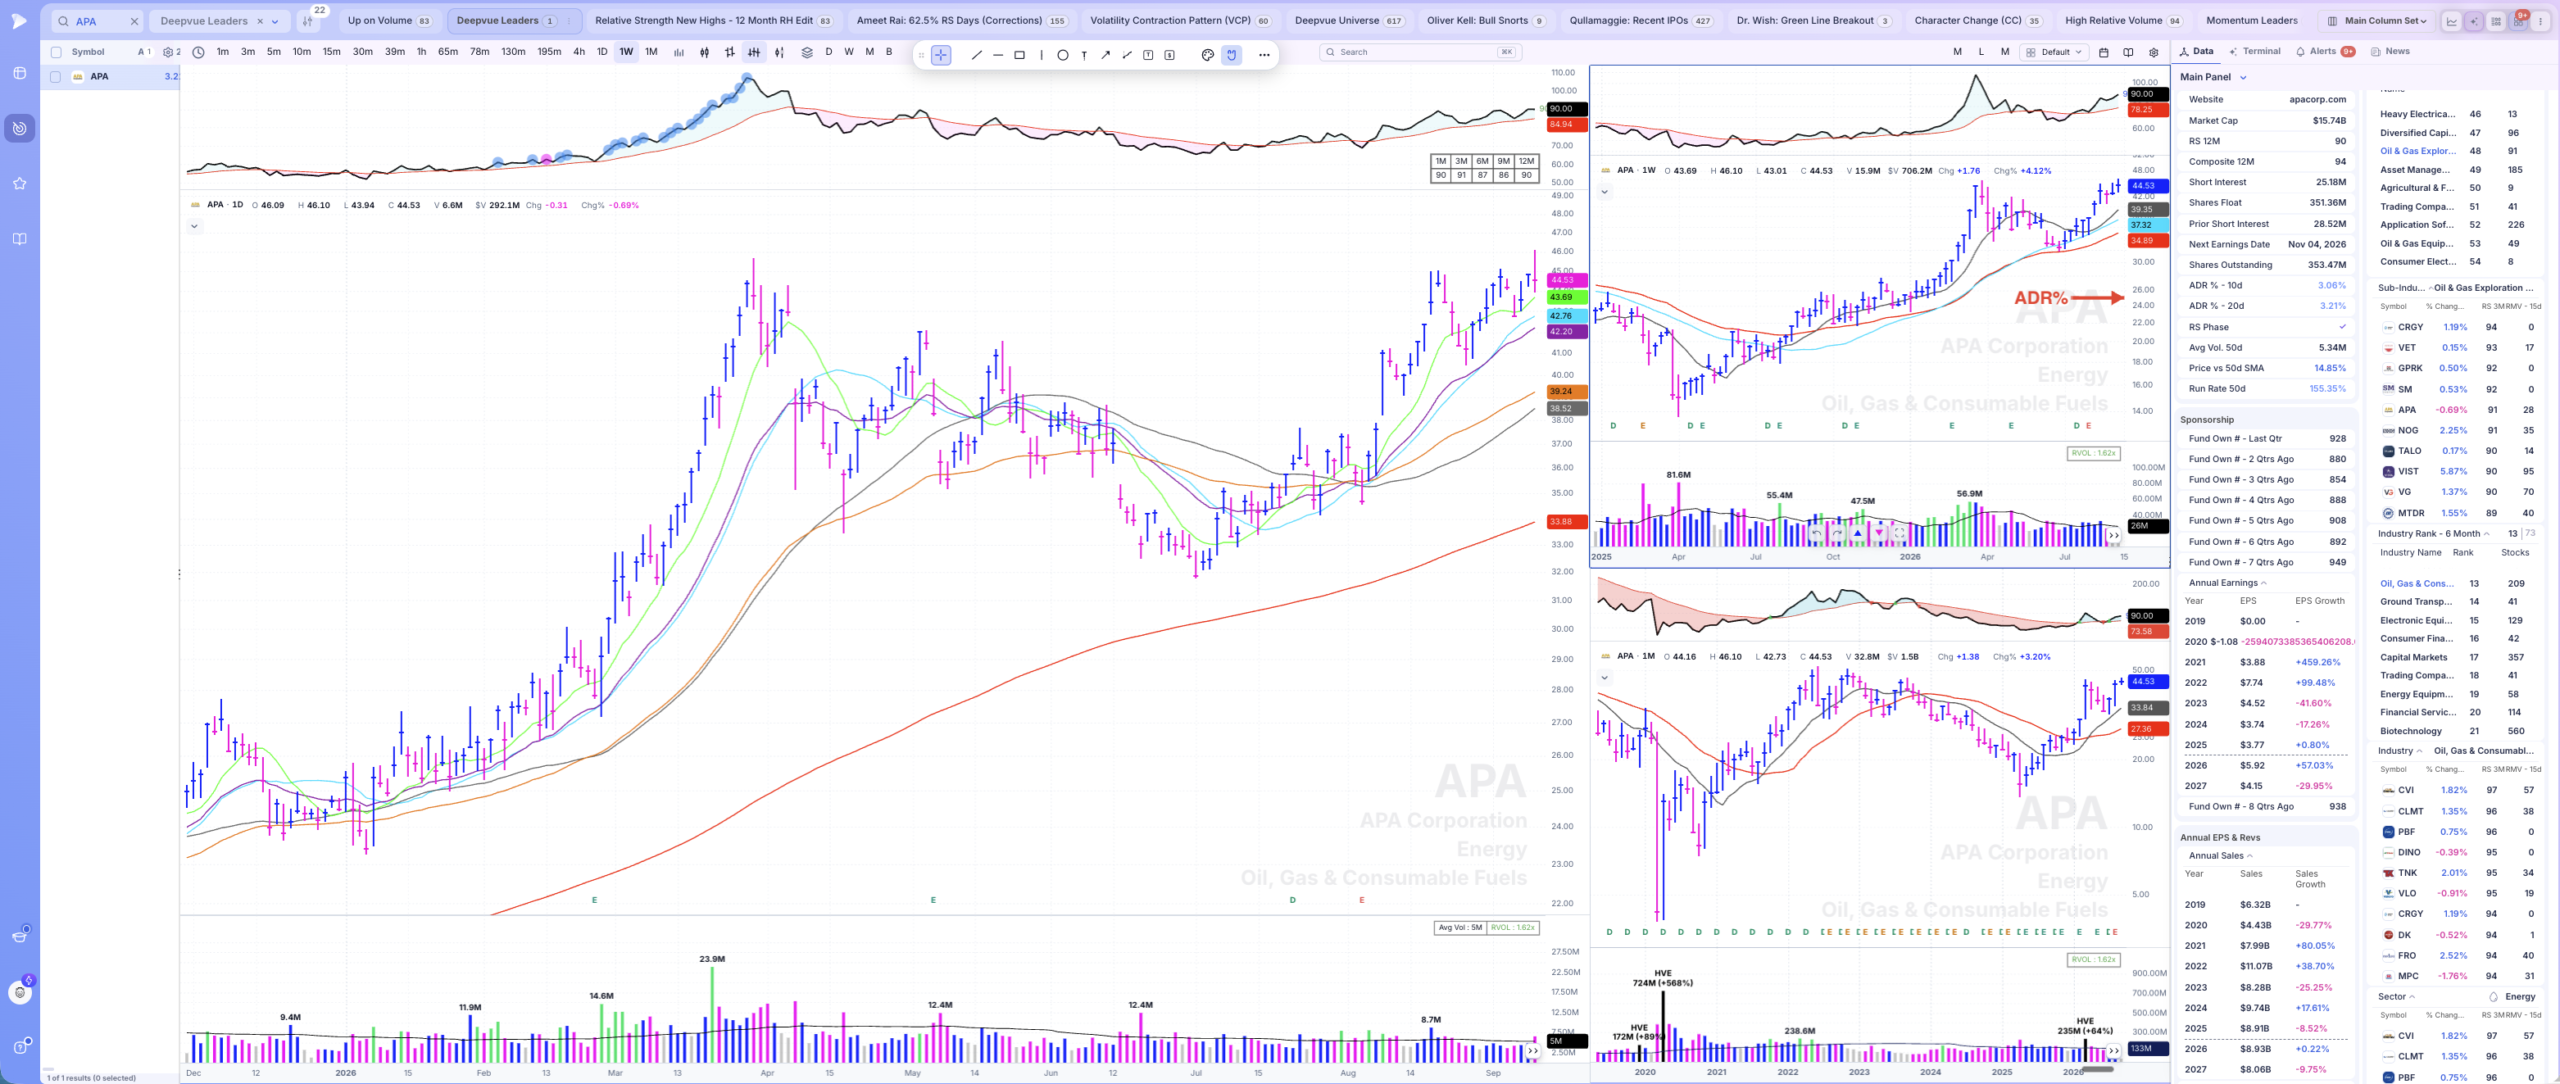
45.66 is the level to watch. Above that, the low 50s from 2022, and the 2008 high way up in the 140s. Plenty of room when energy leads.
APA reads 3.01% on the 10-day ADR, 3.09% on the 20-day. From around $23 on January 7th, 2026, it ran to a high of $45.66 by March 30th — not quite a double in barely three months. Since then, it has built a new base and is attempting to push through that $45.66 high, which would be a 52-week high, not an all-time high: the next level above is around $52 from 2022, and the actual all-time high goes all the way back to April 2008, up in the $140s. Once this stock gets going, it has a ton of power — energy is leading, and this is a leader in the group, so when those are working, it trades like any high-growth name. And when it starts breaking short-term moving averages and gets a little wide and loose, the party's over for a while. Same personality rules, both directions.
Wide and Loose: PURR and SMTC
These are still high-quality, liquid leaders — that's why they're here. I call them performance enhancers: I take smaller positions in them, and only when I'm already doing well in the highest-quality leaders. If the core book isn't working, these stay on the watchlist.
PURR — 11.28% ADR, a fraction of its own recent bars
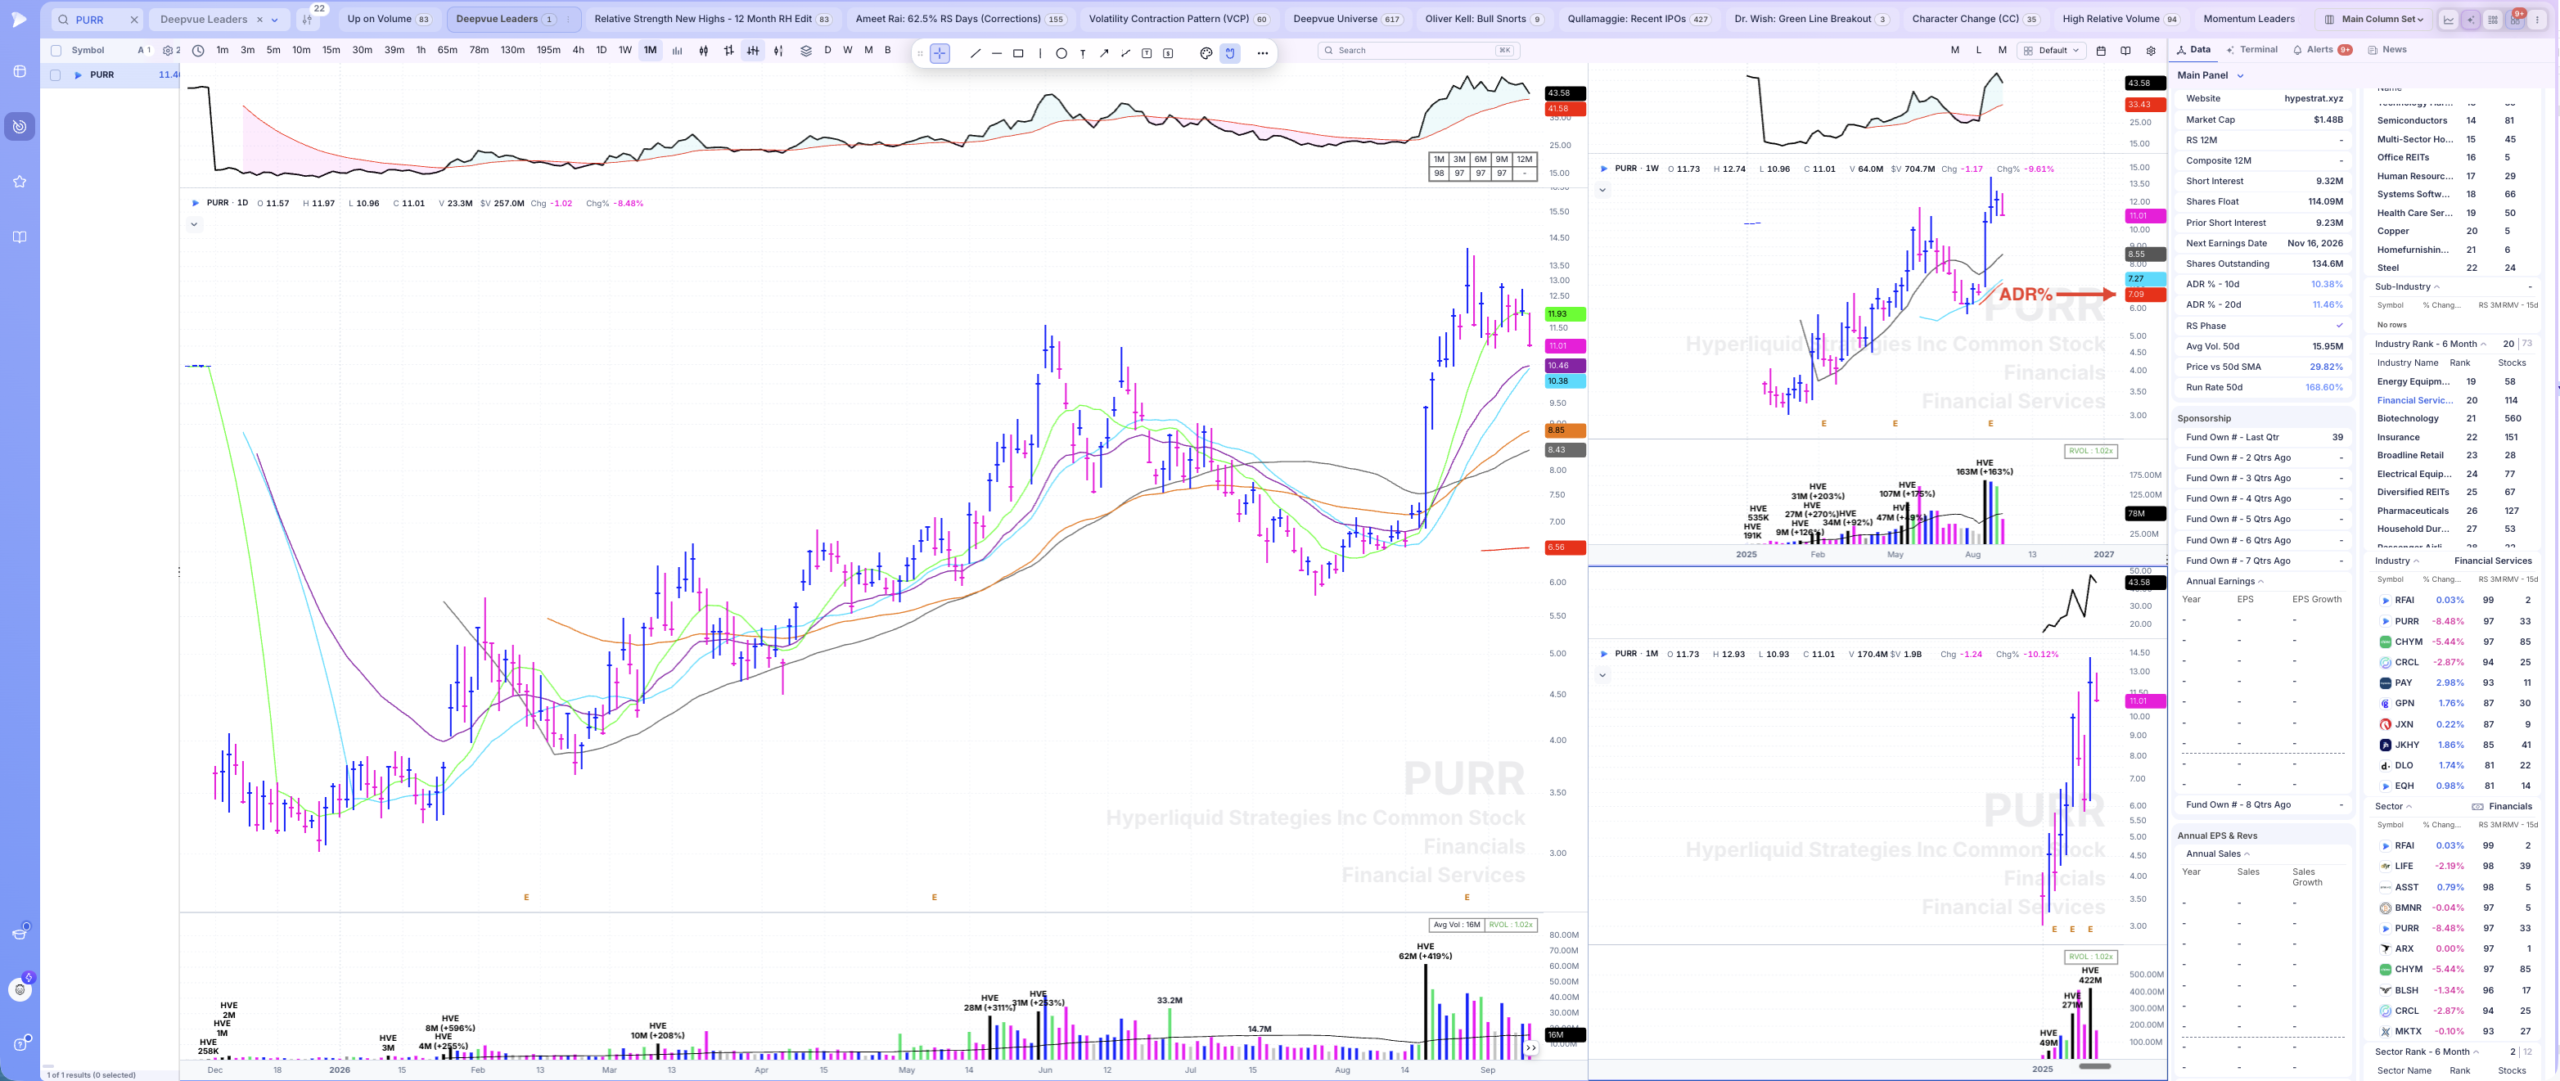
Down 8.56% today — and on a log chart, that bar is smaller than half a dozen to its left. That's what double-digit ADR means in practice.
PURR: 10-day ADR 11.28%, 20-day 11.24%. Super liquid — around 16 million shares a day — a lower-priced crypto-related name that has been working for a while. Look to the left, and you get an honest picture of how it trades: there are times you can buy strength, and it works, and times it doesn't. Today it rolled over, broke a lot of short-term support and its 10-day SMA, down 8.56 percent — and here's the point: on a logarithmic chart, today's bar is a fraction of some of the days immediately to the left. This thing can really whip around. It has stretches where it tightens up, and if you can catch those exactly right, it enhances performance. But it's much riskier, much harder to manage risk on, and you have to be very selective with the entry. I'm watching it closely. That's different from owning it.
SMTC — 6.96% ADR, early in its cycle but whippy
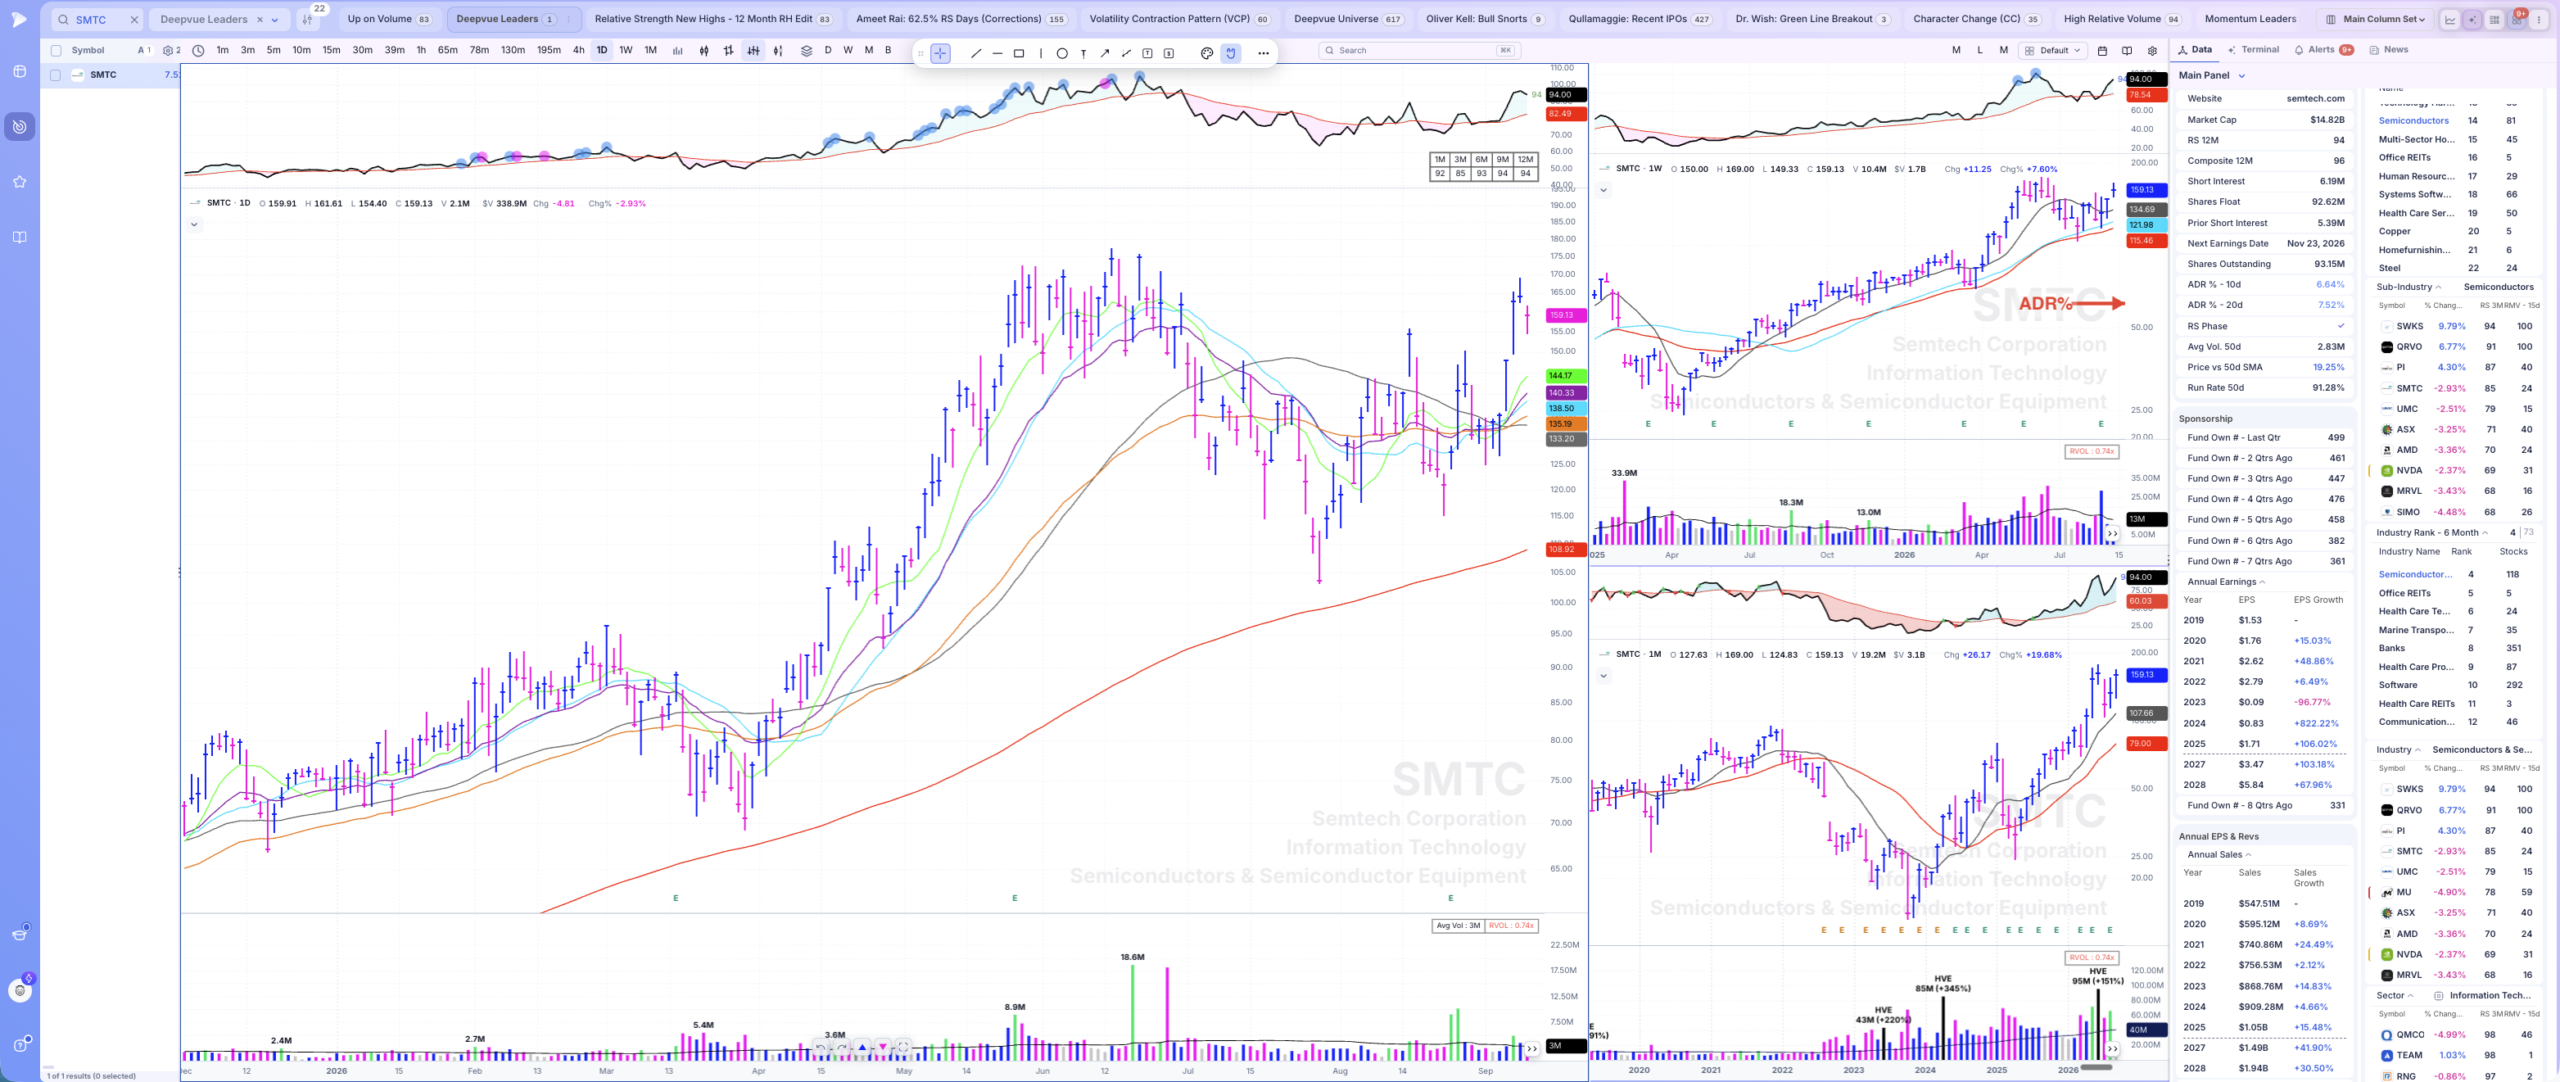
Trends above the 10-day like AMD does — but look how it gets there. Falls below, reclaims, falls below. Much harder to sit with.
SMTC is a leading semiconductor stock, and what I love about it shows on the monthly: while many semiconductor names are late-stage, this one is still early in its cycle. The launchpad has formed, and it has already pushed through the cheap early consolidation pivots near its moving averages — it's much closer now to the prior highs from mid-June 2026.
But the ADR tells you what owning it feels like: 6.96 percent on the 10-day, 7.64 on the 20-day, approaching double digits. Type SMTC and AMD into the same layout, and the difference is clearly visible. Both trend above their 10-day — but SMTC is much whippier, falling below and reclaiming, back and forth. The overall action is just much harder to sit with. And again: it doesn't matter how right you are if you're not holding a position that makes a difference in your portfolio, with tight, logical stops. If you're not managing risk properly, nothing matters.
The In-Betweens: CRWD, INTC, HOOD
Not 2% to 3%, not 7% to 10%. I'll look at these—especially when they're super-liquid leaders in a leading group—and this band is where ADR alone stops being enough. You have to look at the chart's actual behavior.
CRWD — 6.13% ADR, but a tight personality anyway
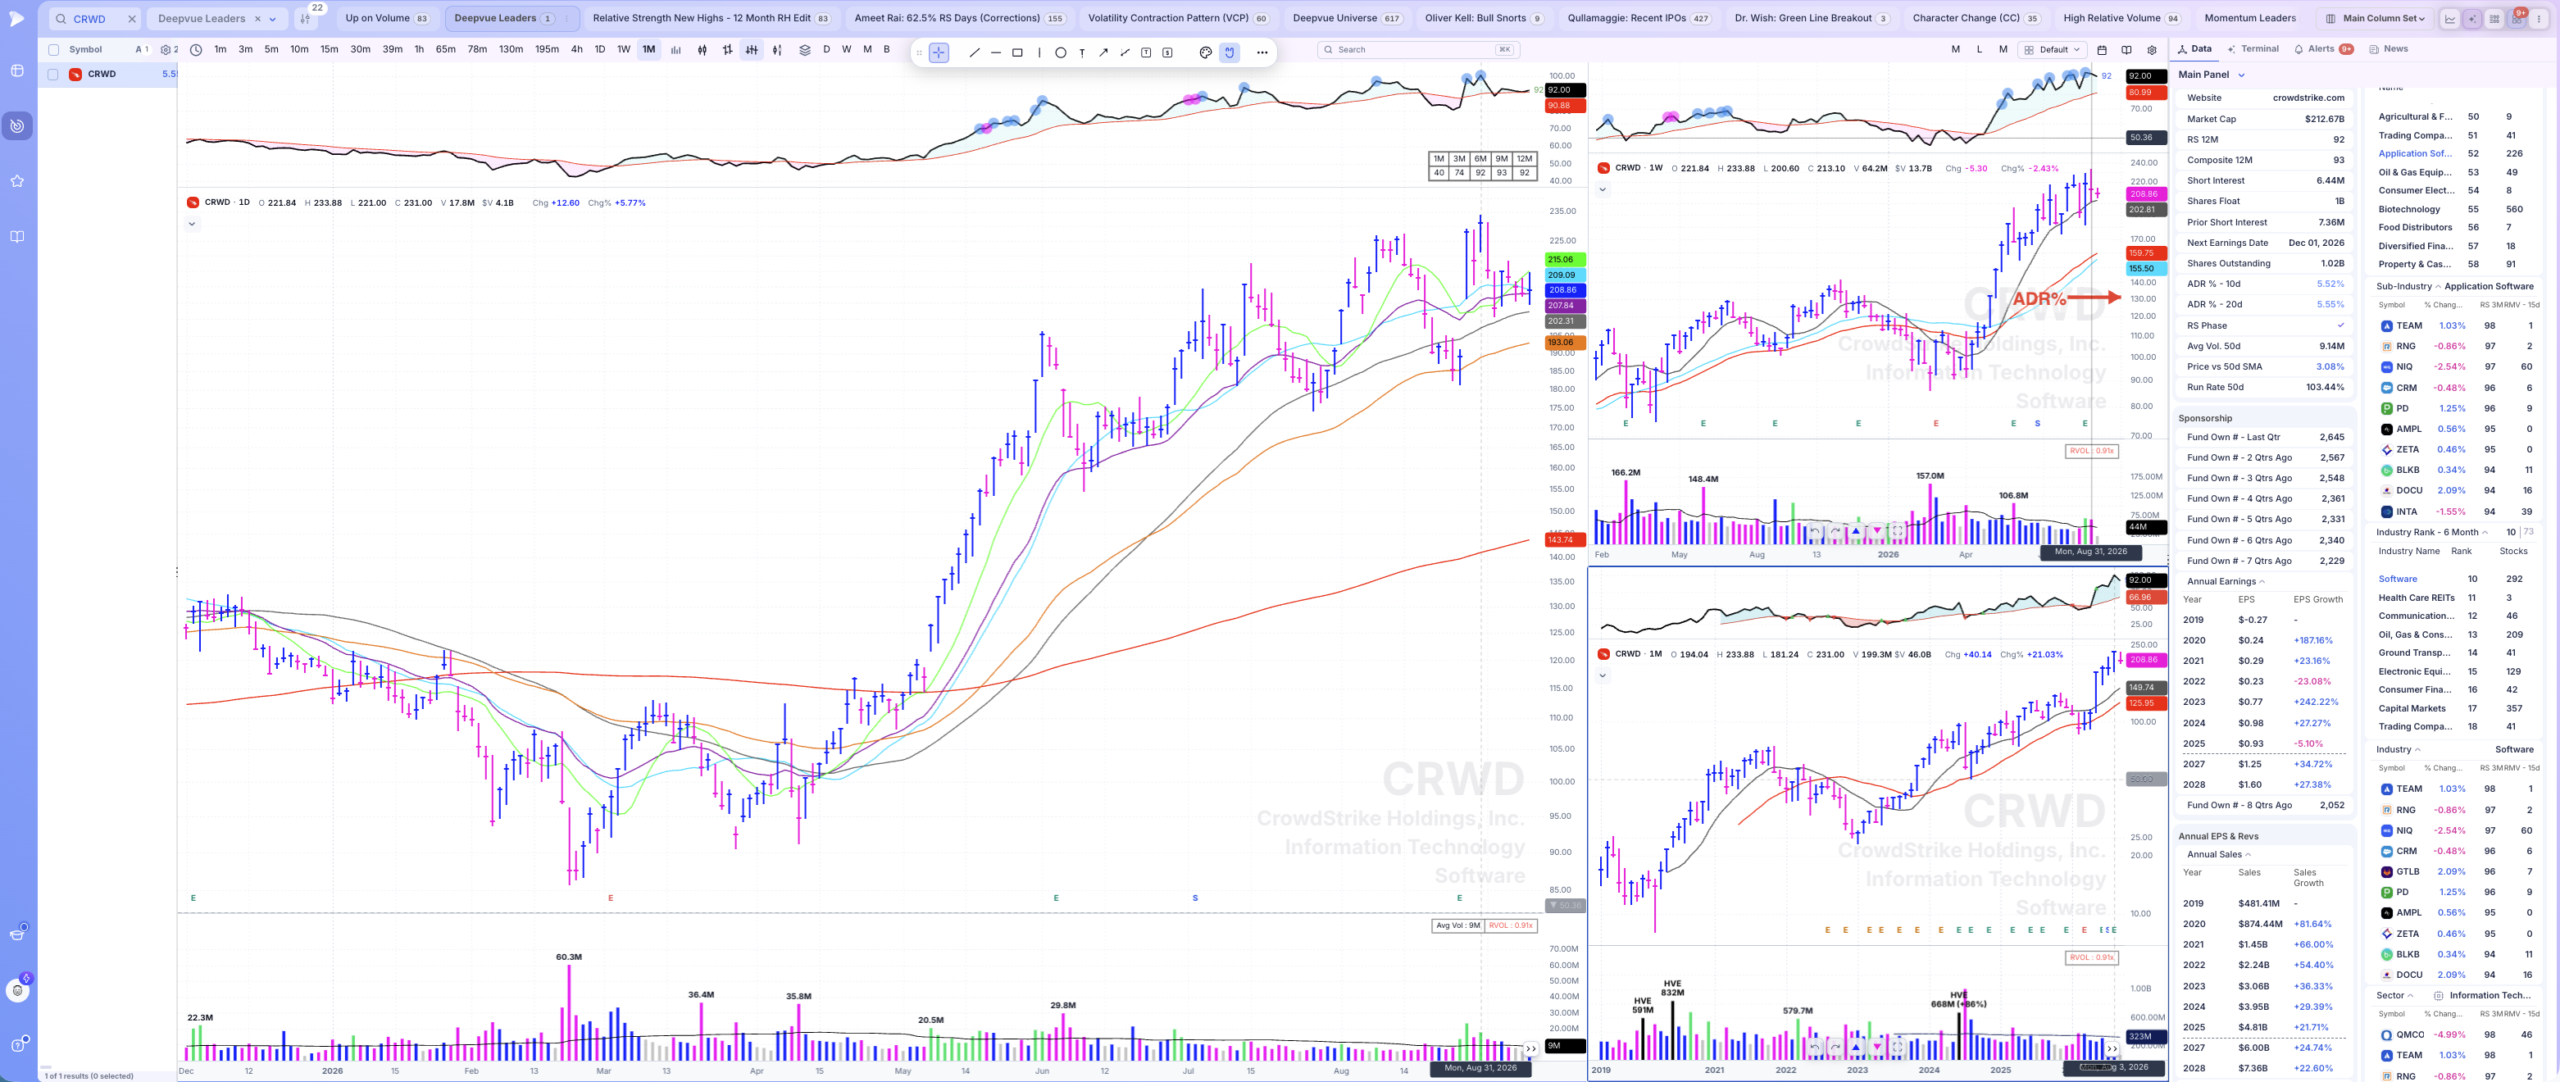
Wider ADR, tighter behavior — smooth trends above the averages, orderly pullback to the 23 EMA. The number is a filter, not a verdict.
CrowdStrike runs a 6.13% 10-day ADR and 5.44% on the 20-day — the middle band. Software has been leading, and CRWD is a big liquid leader in the group: from a low around $90 on April 10th, 2026 to just under $210 by July 6th, then just under $227 on August 10th and a hair above later in the month. It has recently pulled back to that $210 area, which is right where the 23-day EMA sits, with the 50-day catching up beneath. Here's why the eye still matters: despite the wider ADR, the personality unto itself is relatively tight — smooth trends above the averages, and when it corrects and starts base building, the action is visibly tighter and more orderly than a true wide-and-loose name. The number gets a stock onto the list or off it. The chart decides what it actually is.
INTC — 4.44% ADR, sitting on stacked support
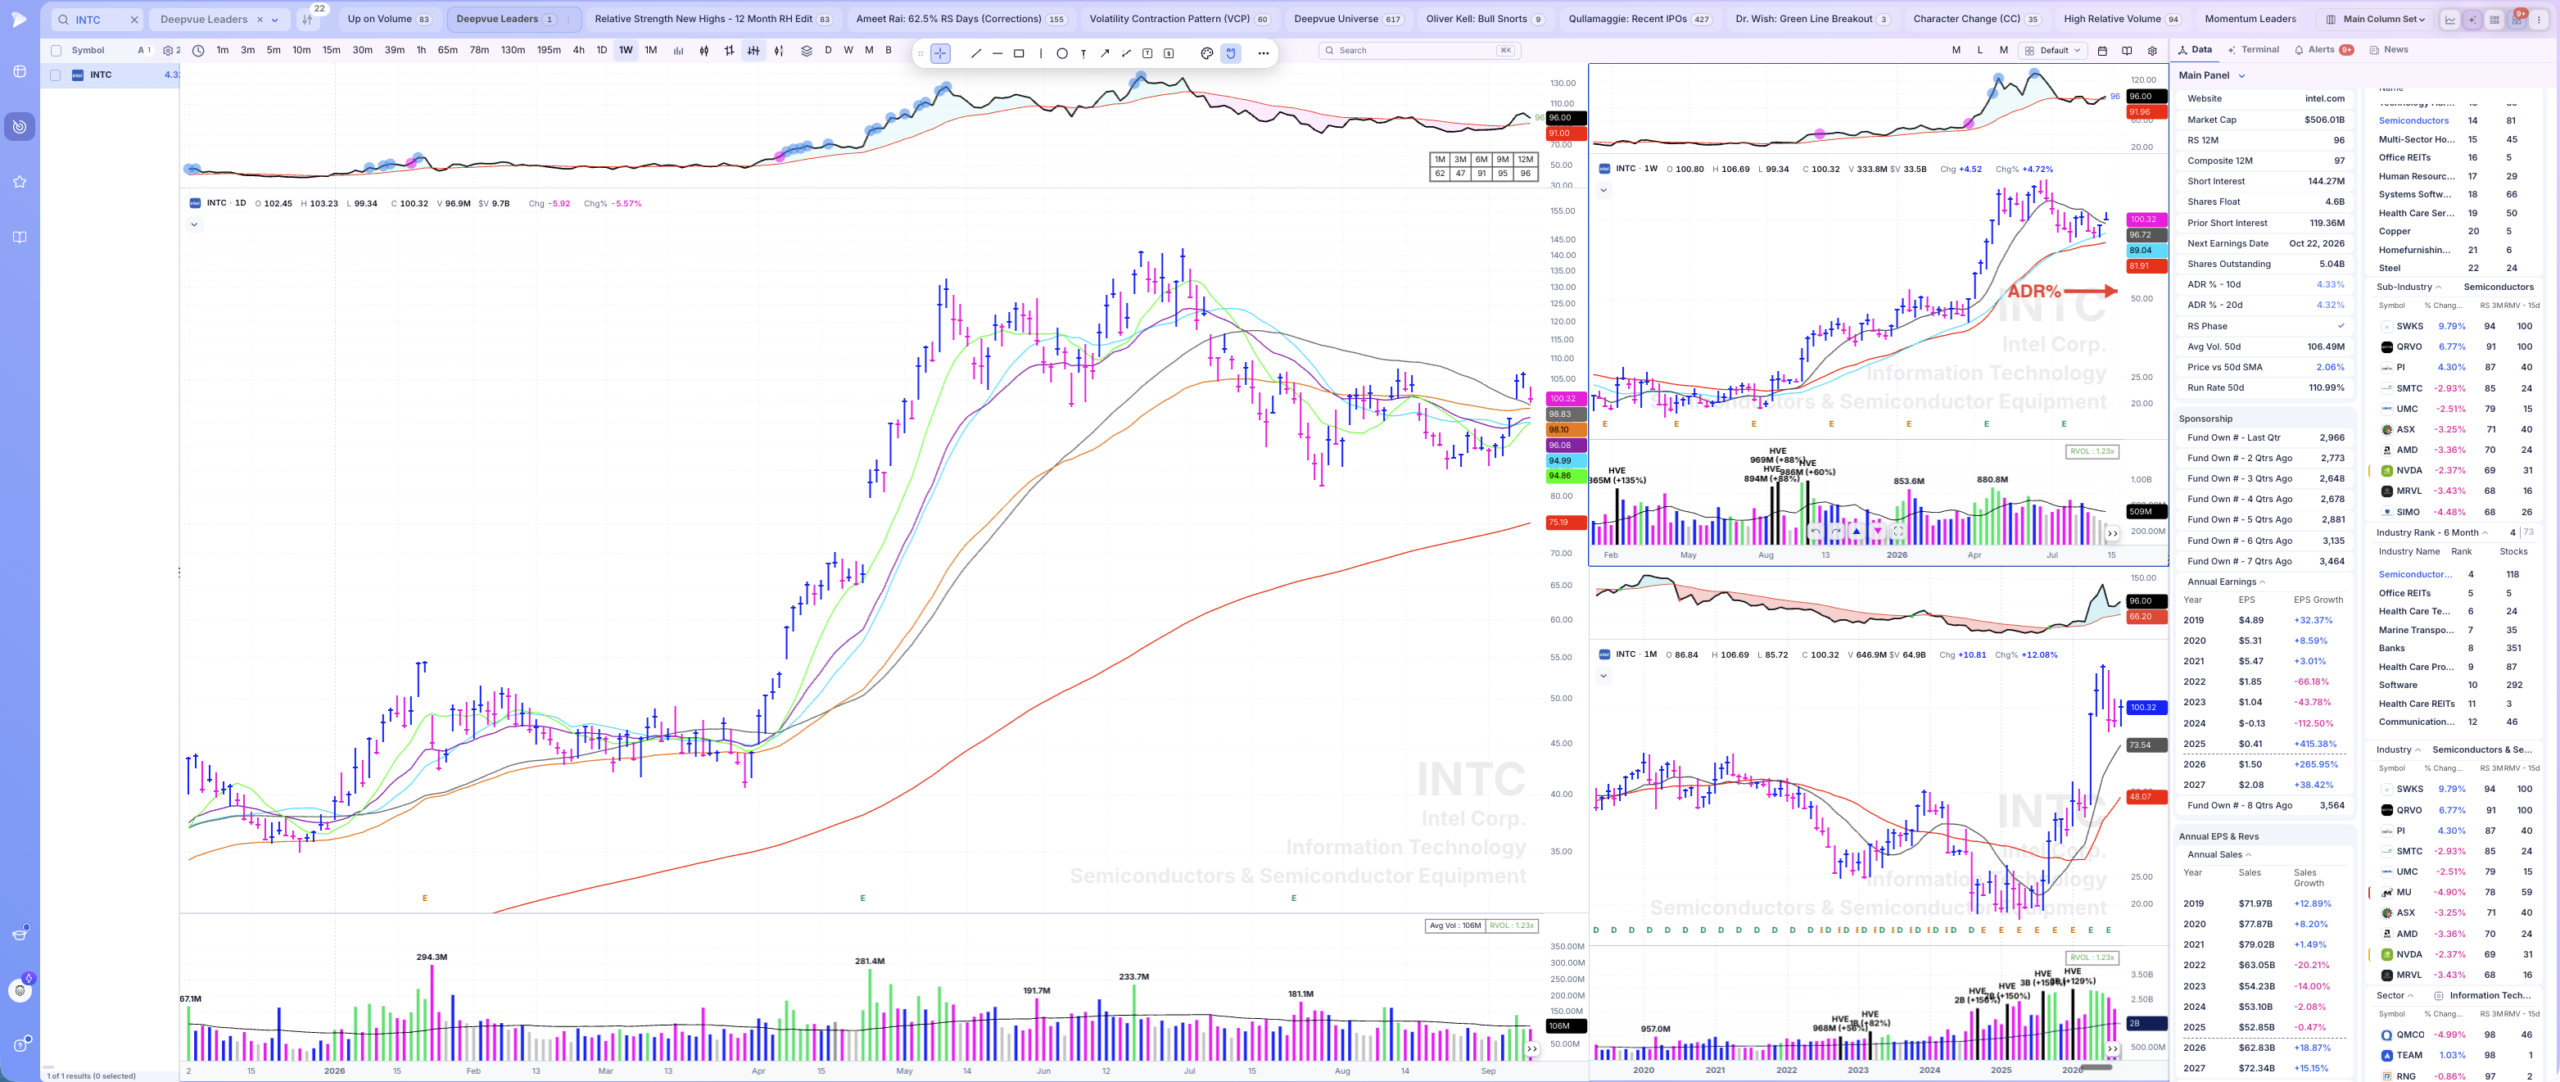
41 to the low 140s, now base-building on the 50-day with the 65-day EMA and a prior gap stacked right beneath it.
Intel: 4.44% 10-day ADR, 4.48% on the 20-day — mid-volatility. It traded as low as about $41 on March 30th, 2026, hit around $132 by May 11th, and after a pullback and push higher reached the low $140s by June 30th. Since then, it has been base-building, working on a launchpad pattern, sitting right on its 50-day SMA — with the 65-day EMA and a prior gap stacked just beneath it as potential support. A nice big liquid leader where quiet accumulation could start right here. That's the kind of in-between I'll make time for.
HOOD — 5.59% ADR, choppy daily, powerful trend
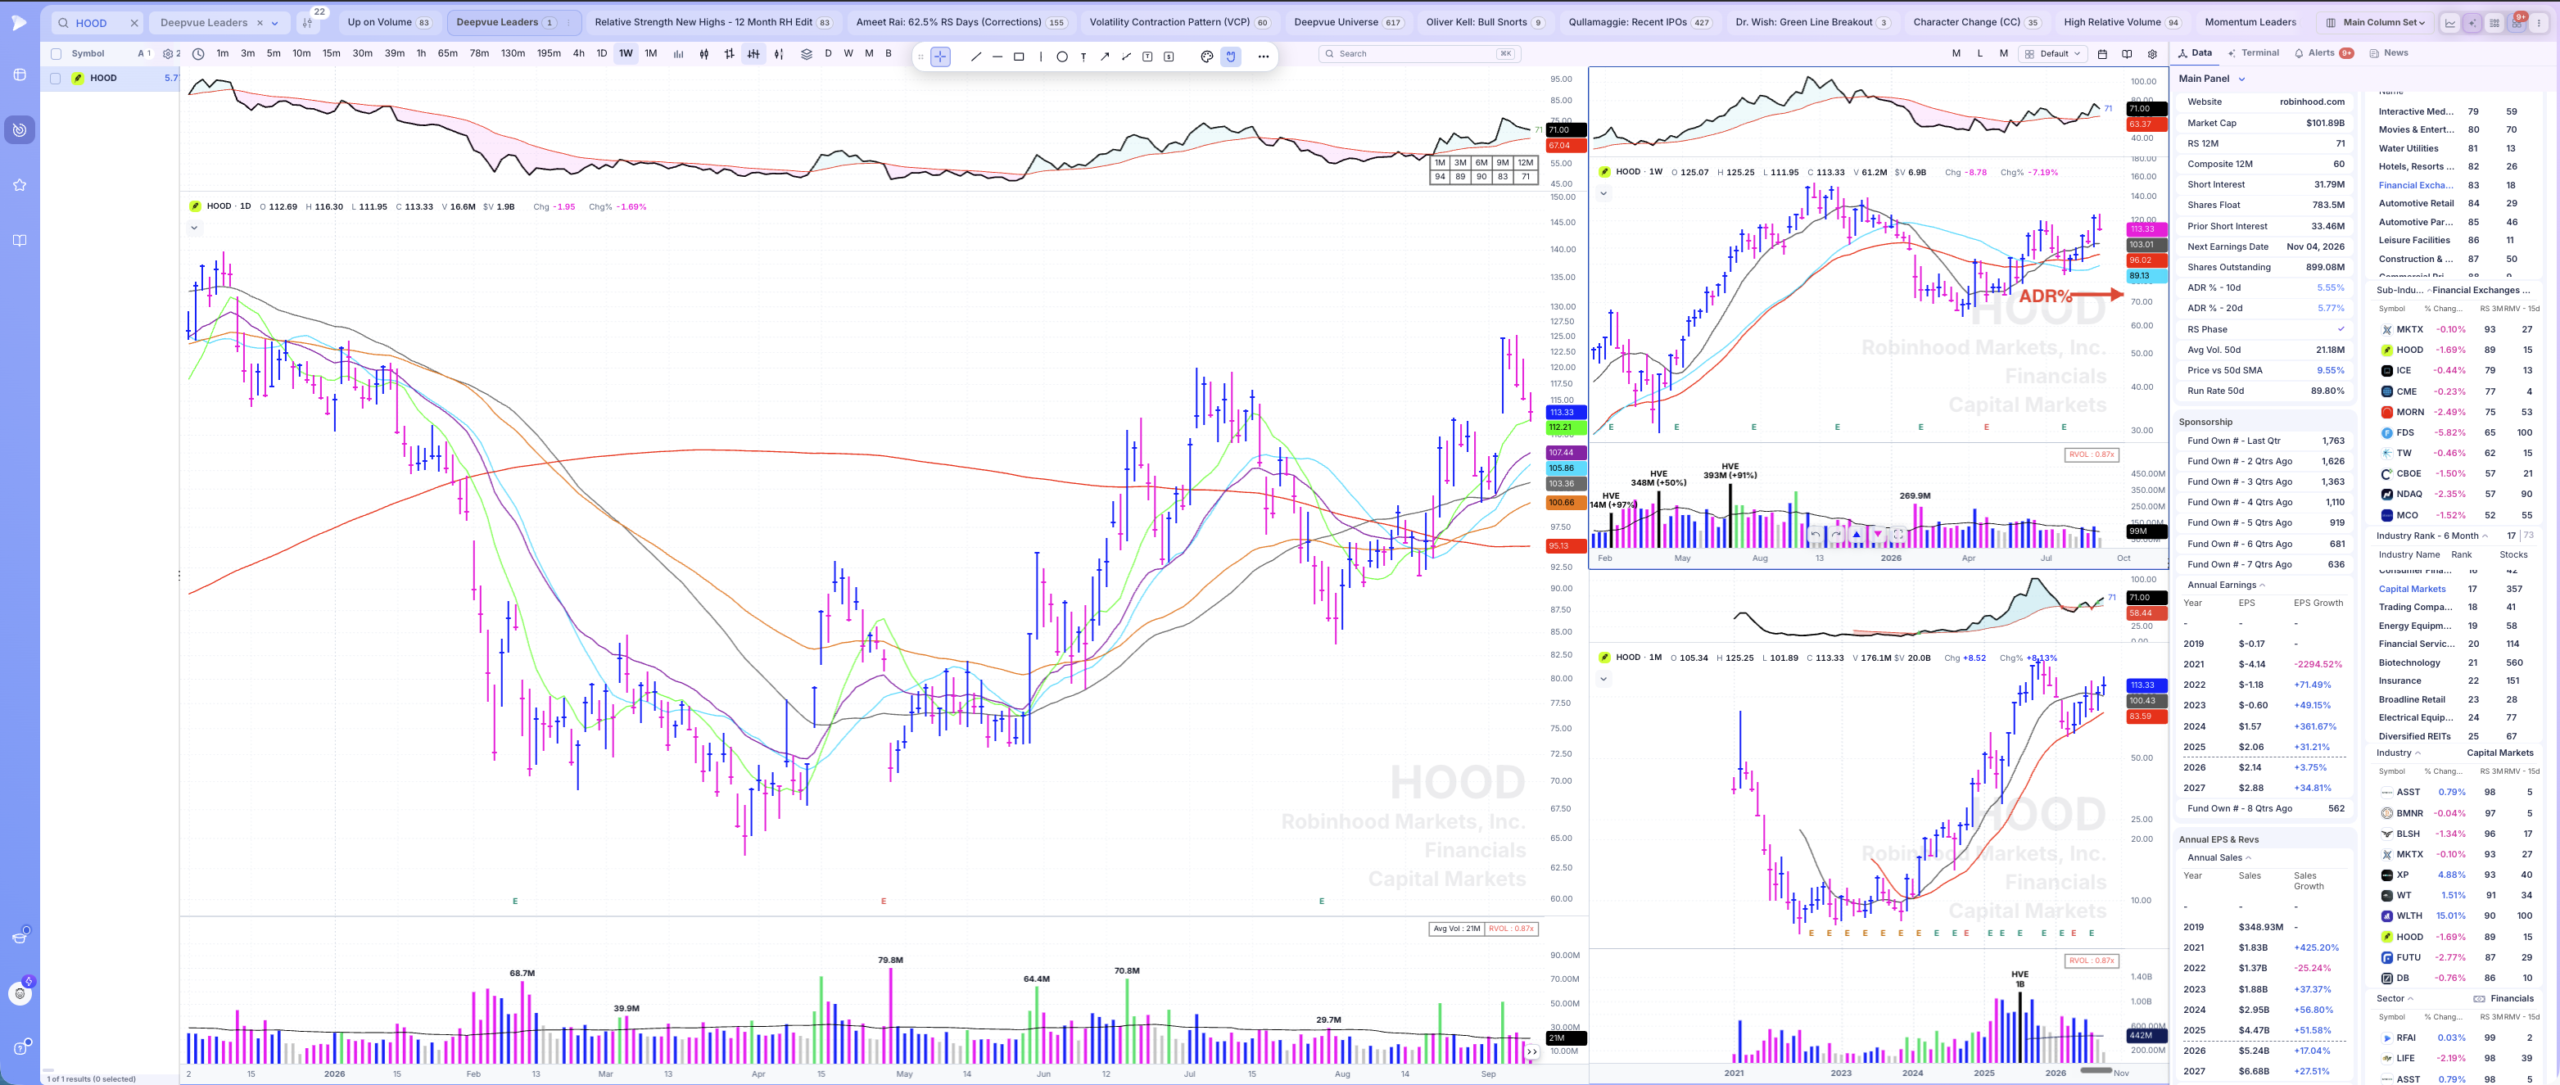
The daily chops; the monthly is smooth. When it trends, it respects the 10-day — and when it stops respecting it, that's your answer too.
Robinhood: 5.59% 10-day ADR, 5.78% on the 20-day. Flip between the daily, weekly, and monthly, and you see the familiar effect — the longer timeframe smooths out the noise, so the monthly looks tight while the daily chops. What I like is on the left side of the chart: when HOOD trends, it trends powerfully and respects its 10-day SMA, and when the trend stops, you can see exactly what happens below it. I extrapolate that forward. From about $64 on March 30th, 2026 to $125 and change on September 3rd — a solid move over a short period, and it can move more powerfully than that. It's a big leader in the finance-tech mix, one I wouldn't want to miss if I don't have to, and one I'd have no problem buying at key support on the right day. Everything matters that day: what the group is doing, what the market is doing, and what the high-relative-strength peers in its group are doing.
Pro tip: There's no rule that applies across the board. Some narrow-ADR stocks perform beautifully; some whippy ones are super profitable and barely move over a year. Judge every stock individually — the bands just tell you where to start looking.
What to Do This Week
- Add the 10-day and 20-day ADR% to your chart layout and your screens, right next to price and volume. It's the one personality trait you can sort a watchlist by.
- Classify every current holding and watchlist name into the three bands: 1–3%, 4–6%, approaching double digits. Be honest about how much of your money is sitting in the last band.
- Look to the left on each chart. Which moving average has it respected — the 10-day, the 21-day SMA, the 23-day EMA? Write it down. That average is your management line until the personality changes.
- Run a post-analysis on your last five losing trades. Count how many were wide and loose names where the stop was a guess. That number is usually the whole argument.
- Then write your own personality rule — one that matches how you trade. Mine is tight and orderly only, full size; performance enhancers small, and only when the core book is working. Yours might be different, and that's the point.
The Leaders I Consider Tight and Orderly Right Now
Twice a week in The TML Report, I go through the market's posture and a Focus List of 8–12 True Market Leaders — the ADRs, the moving average each name respects, and the exact levels I'm managing against, marked on every chart.
Read The TML ReportFrequently Asked Questions
CAN SLIM® is a registered trademark of O’Neil Capital Management, Inc. (U.S. Reg. No. 3,081,940). TraderLion is not affiliated with, sponsored by, endorsed by, or licensed by O’Neil Capital Management, Inc., Investor’s Business Daily, MarketSurge, or their affiliates. Any reference to CAN SLIM® is for descriptive purposes only.