Leaders Lead, Laggards Lag: How I Rank a Group.

Ross
Ross is a co-founder of TraderLion and Deepvue. He was mentored by William O’Neil, and co-authored The Model Book of Greatest Stock Market Winners at WON + Co.
Published: October 14, 2026


 Ross Haber
Every new post, straight to your inbox
If this was useful, the next one will land in your inbox the day I write it.
How Do You Rank Stocks in a Group?
When I first started trading, I was obsessed with stock picking, and I made a mistake I still see all the time. I'd find a group that was working, look at the leader, decide it had run too far, and buy the cheaper name in the group instead. It looked like a bargain. It usually was a bargain for a reason. The leader kept going. The laggard bounced a little and then fell harder than anything else when the group pulled back.
Buying cheap is not a strategy. Strength is. That's one of the first things I absorbed at William O'Neil + Co., and it changed how I look at every group. Below is how I rank the names in a group, what I want to see on the number-one stock, and how I know when the ranking has stopped working.
Why Relative Strength Ranking Matters
Think of the market like Russian nesting dolls. The market is the biggest doll. Inside it are sectors, inside those are industry groups, and inside each group are the individual stocks. A stock moves best when every doll around it is moving the same way. That's why I start with the market and the group before I ever look at a single name, and why Stan Weinstein's stage analysis works as well on groups as it does on stocks.
But once a group is working, the stocks inside it are not equal. Institutions put their biggest money into the best one or two names: the best earnings, the best story, the cleanest chart. Those names rise the most in the advance and hold up best in pullbacks. The rest of the group trails behind, and when the group finally tops, the laggards break first and hardest.
The part most people skip: the leader almost always looks expensive. That's what leadership looks like. If the number-one stock in a group looks cheap to you, you're probably not looking at the number-one stock.
That's what relative strength measures: not how a stock has done on its own, but how it has done compared with the market and with everything else. Ranking a group by relative strength is a disciplined way to see where the money is going.
How I Rank a Group
I list every name in the group, sort by relative strength, and then work through the top of the list one chart at a time. The sort gets me close. The charts decide.
What I look for in the leader
- An RS line making a new high before price does. This is the tell I trust most. It means the stock is outperforming the market even while it's still inside its base. At the very least, the RS line has to make new highs along with price on the breakout. That's the bare minimum.
- A high RS Rating. Bill O'Neil's guideline was 80 or higher. The leader of a strong group is usually near the top of that range, not scraping in.
- The tightest base in the group. Tight and orderly, not wide and loose. Whether it's a flat base, a launchpad, or a consolidation pivot, the leader's base usually looks calmer than everyone else's.
- The strongest numbers. Accelerating earnings and sales growth. Fundamentals often explain why institutions picked this name over the others.
- Big blue, small red. Heavy volume on the up days and light volume on the pullbacks, the signature of quiet institutional accumulation.
- It held up best in the last correction. The stocks that fall least while the market is falling are very often the ones that lead when it turns.
What it looks like when it fails
Rankings change, and that's how you get it wrong here. A leader can lose its position: the RS line rolls over, the stock breaks on its second consecutive close below the 21-day SMA, and a different name takes the top spot. When that happens, I don't argue with it. I re-rank.
The bigger warning is when the leader breaks, and nothing replaces it. If the number-one name in a group breaks down on heavy volume and the second- and third-ranked names can't hold either, the group is usually done for now, whatever the story says. That's when I stop looking for the next name in the group and start looking for the next group, a sign of healthy rotation.
The Leader, the Qualifier, and the Laggard
Put three charts side by side, and the RS lines tell you most of what you need to know. One makes new highs ahead of price, one makes them with price, and one doesn't follow price at all.
The leader
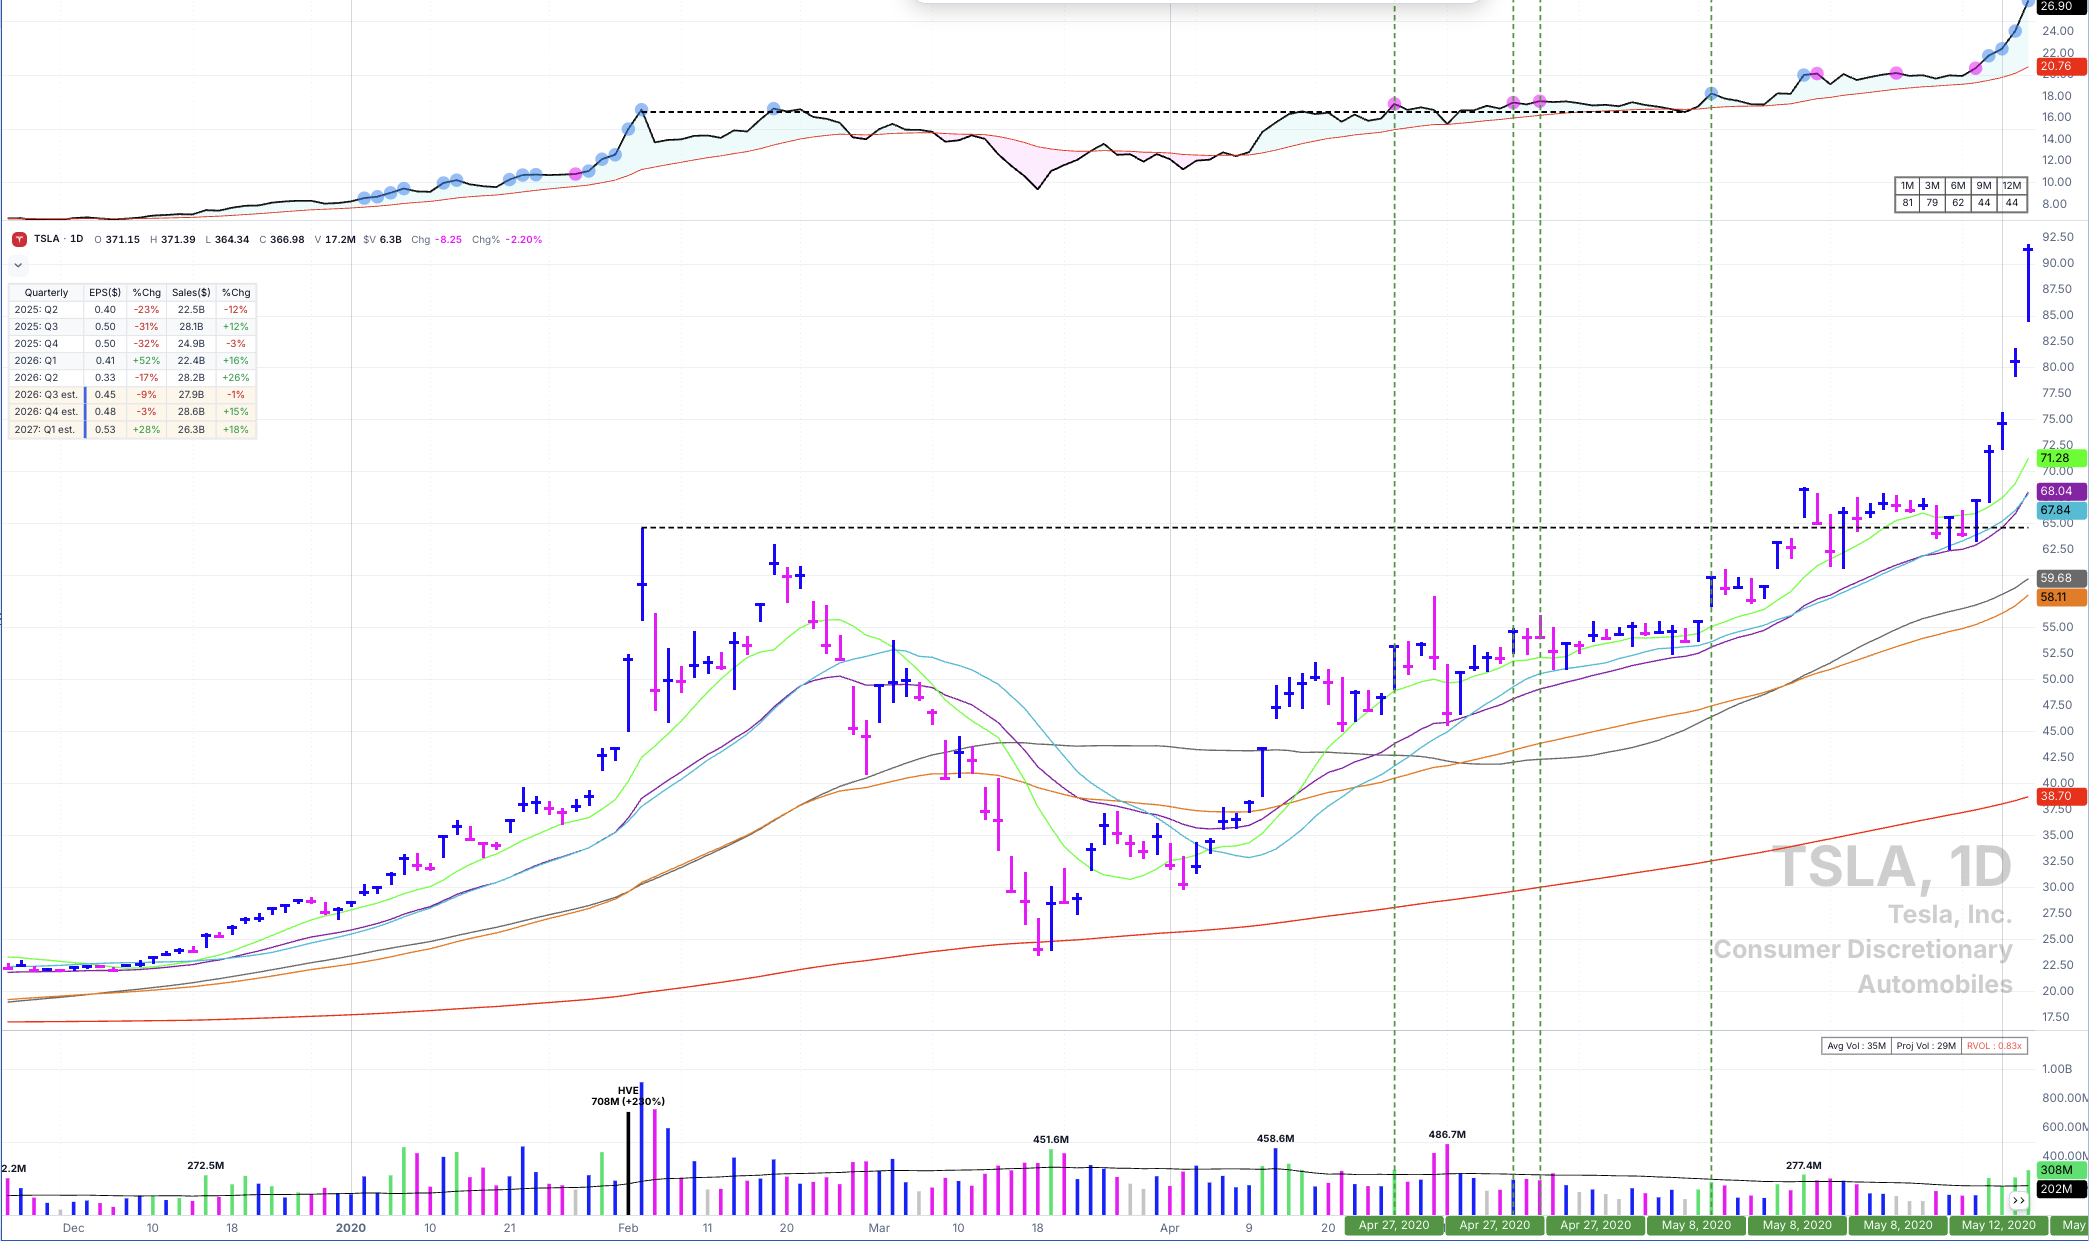
RS line at a new high before price, tight base, big blue volume. This is the one.
TSLA in 2020 was a standout leader, and this is why. The RS line got to new highs first, while price was still working inside its base. The stock was outperforming the market well before the breakout. That's the tell I trust most. When it shows up, that stock moves to the top of my focus list.
The qualifier
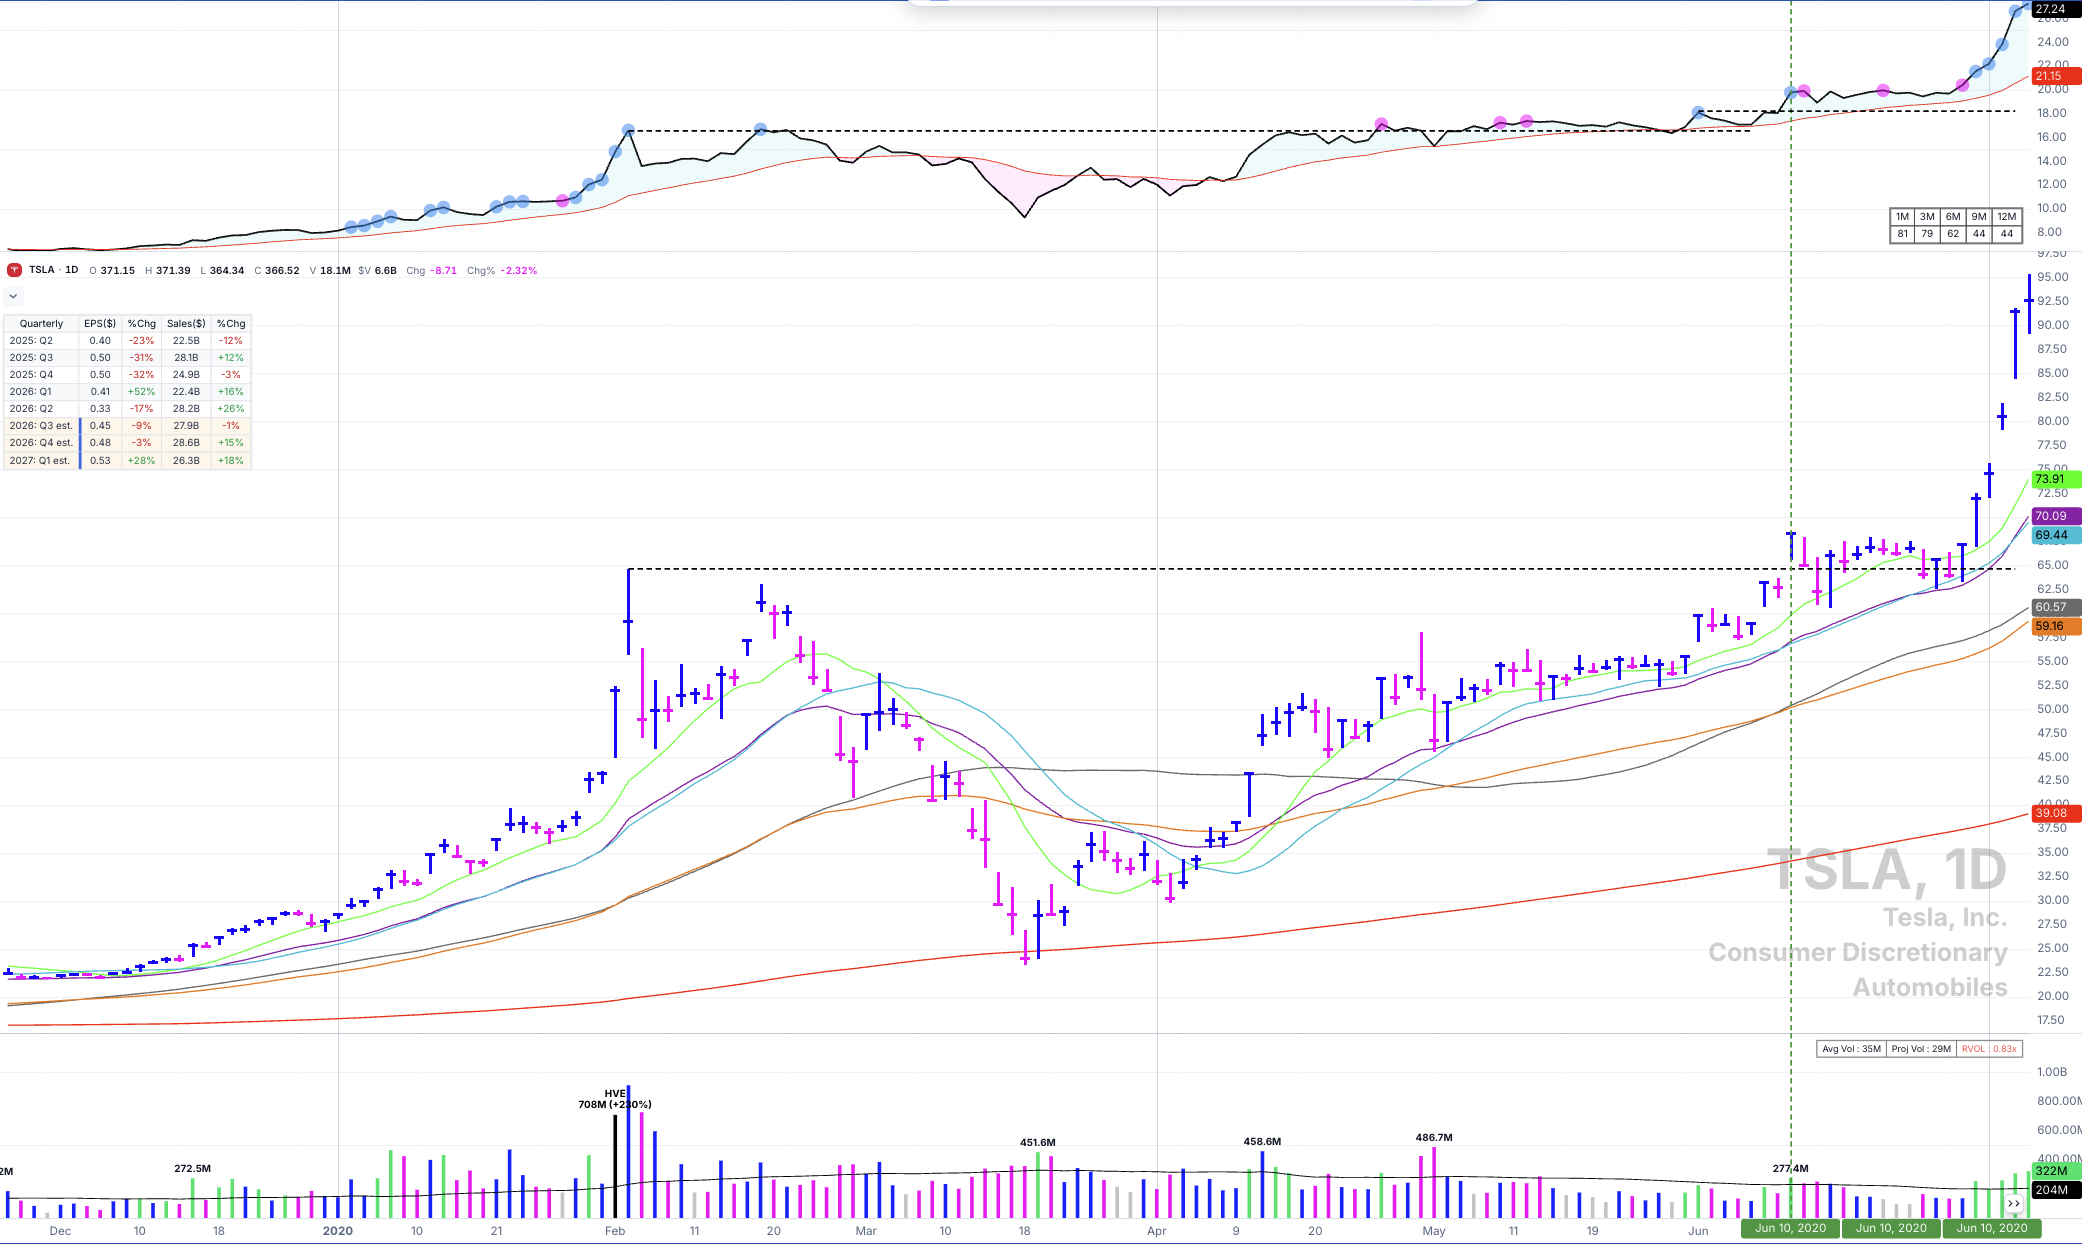
RS line at new highs with price. The bare minimum to buy a breakout.
This is TSLA again, at a different breakout. This time the RS line didn't get there first; it made new highs as the stock broke out. That's the bare minimum I need to buy a breakout. If the RS line isn't confirming the move, I don't buy it, no matter how good the base looks. This setup is a reasonable trade. It just isn't as strong a signal as an RS line that leads.
The laggard
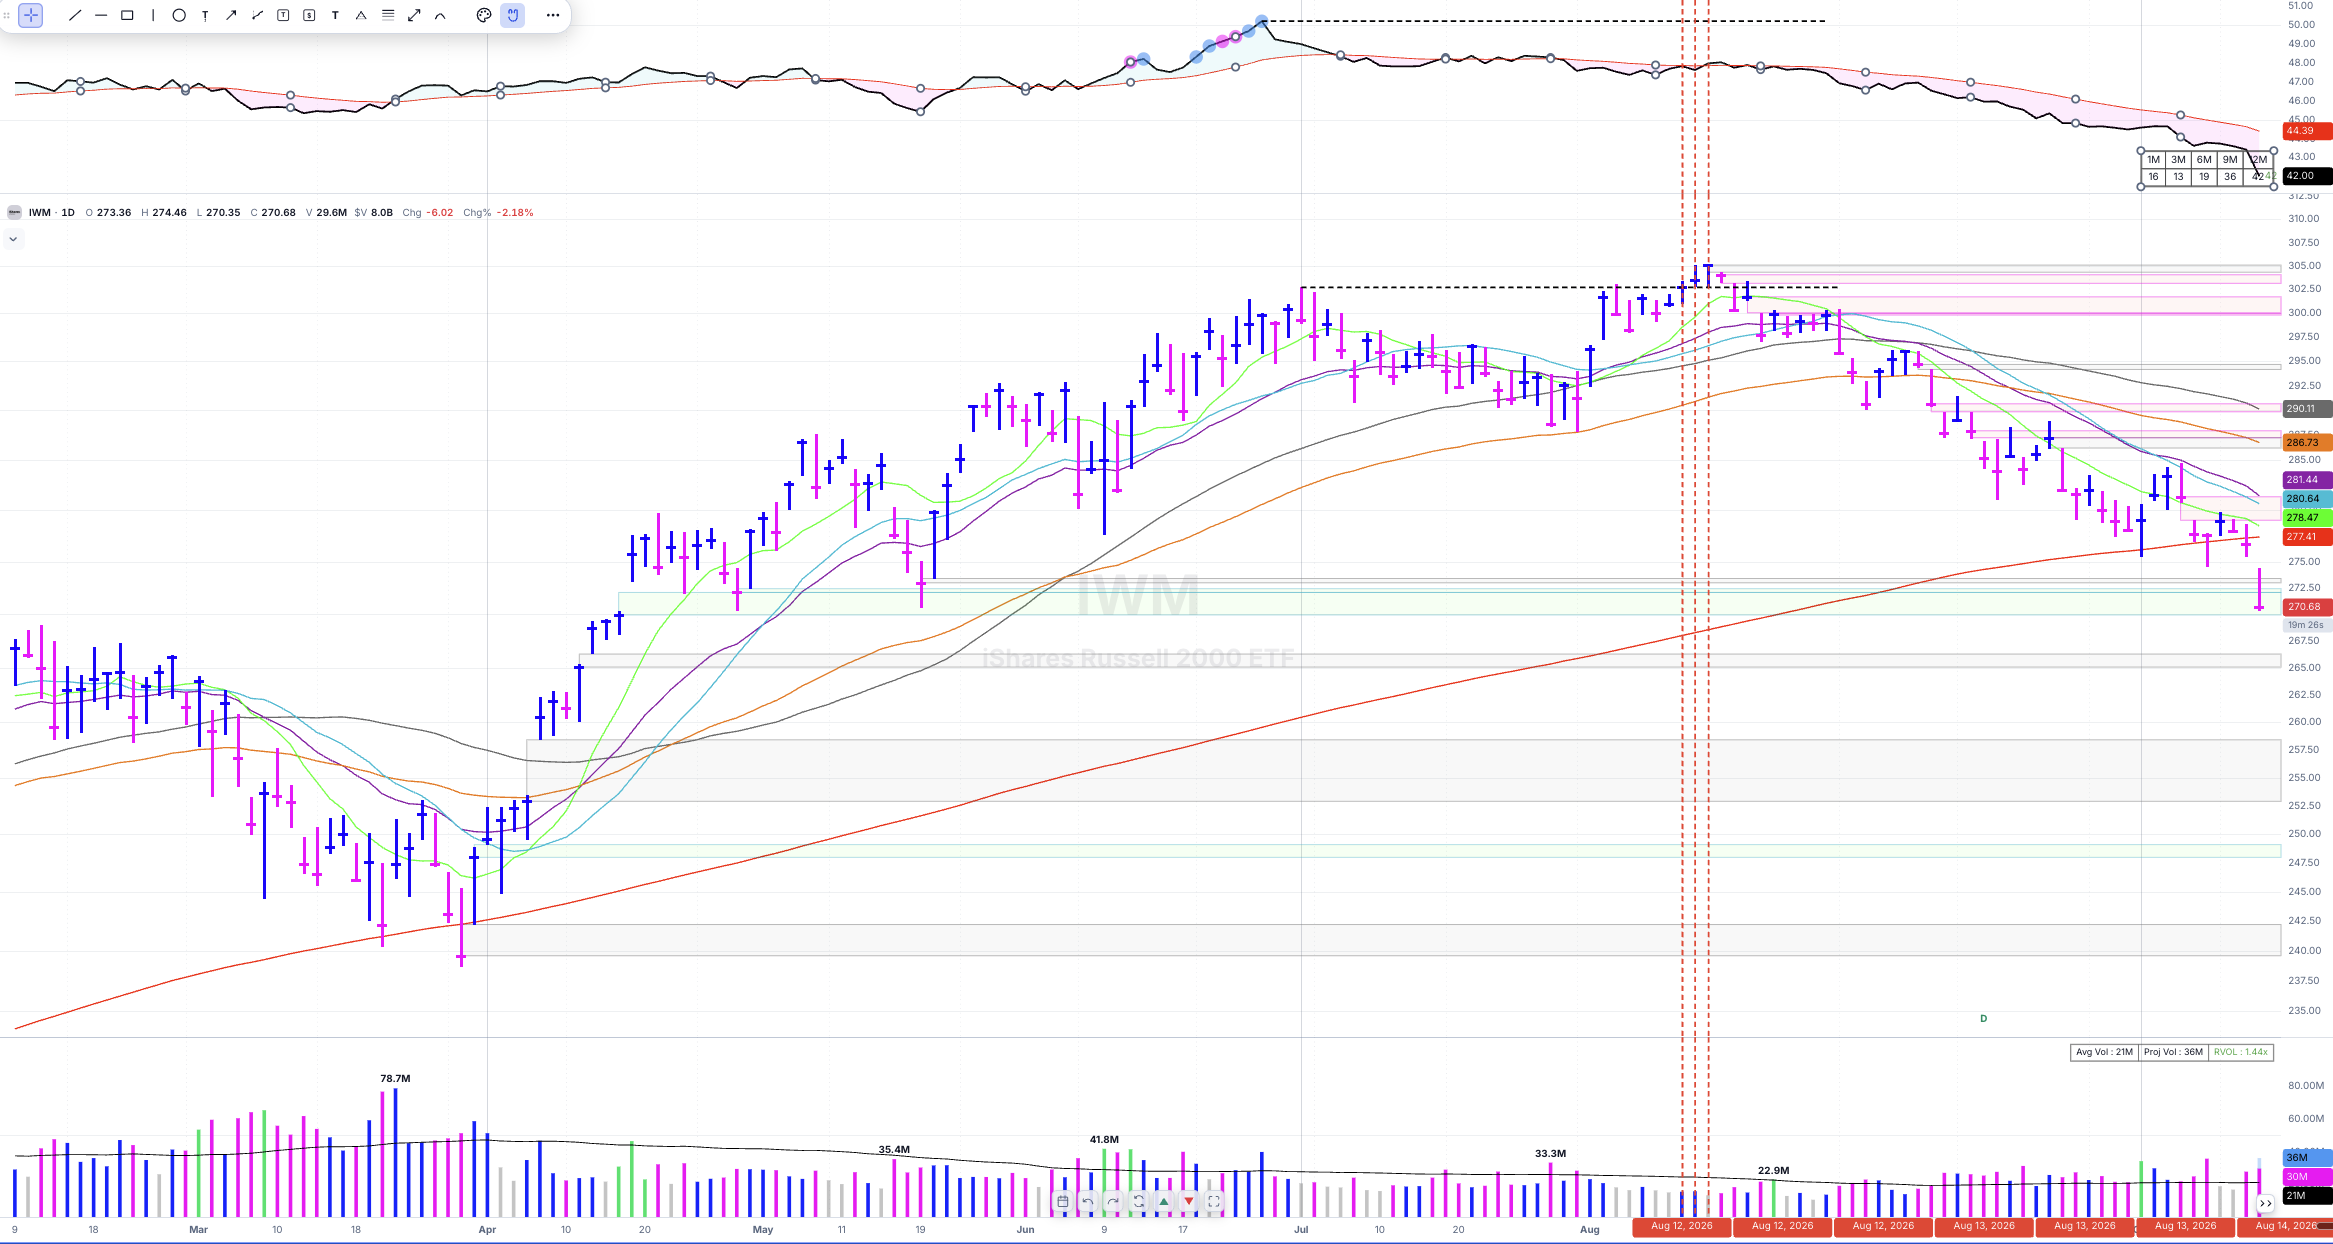
Price broke out. The RS line didn't follow, and the breakout failed.
IWM shows what this looks like. Price breaks out of its base, and on the surface it looks like a buy. But the RS line doesn't follow it higher. It stays below its prior high while price makes a new one. That gap says it's only keeping up with the market, not beating it. Without that confirmation, the move lacks real sponsorship, and the breakout ultimately failed.
Rank a Group This Week
Pick one group and do this once. It takes about twenty minutes.
- Pick a group that's acting well: several names near highs, the group itself outperforming the market. The RS phase framework helps here.
- List every stock in the group. Run it as a screen in Deepvue if you have it, and sort by relative strength.
- Pull up the RS line on the top five. Mark which ones made a new high before price, which made one with price, and which didn't follow at all.
- Compare the bases. Rank them from tightest to loosest.
- Write down your number one and number two, and one line on why. Ignore the rest.
- Check the ranking again next week. If the leader changed, ask what changed.
You don't need to own every group, and you don't need to own more than one or two names in any of them. A short list is fine. A watchlist made of leaders is worth more than a long one made of everything that happens to be in a hot group.
The TML Report
Twice a week, I publish where I think we stand: the market overview, the four index charts, and a focus list of the leaders in the groups that are working, grouped by behavior, with the lines already drawn on them.