
Consolidation Pivot: Buying Before the Breakout

Ross
Ross is a co-founder of TraderLion and Deepvue. He was mentored by William O’Neil, and co-authored The Model Book of Greatest Stock Market Winners at WON + Co.
Published: September 4, 2026


The consolidation pivot came out of a problem I couldn't buy my way around. When I left William O'Neil + Co. to run a hedge fund in New York, the size of my positions increased dramatically, and buying traditional CANSLIM® breakouts at the market became untenable unless the stock was extremely liquid. Try to buy several hundred thousand shares at the market — especially in a stock that's already strong — and by the time you're filled, it's very easy to get shaken out.
The second problem arrived on its own schedule: market volatility and speed picked up noticeably as market structure changed. High-frequency trading, algorithmic trading, and the move from fractions to decimals — instead of trading in fractions of dollars, we now trade in fractions of pennies. All of it added to the difficulty of buying breakouts, which was hard enough to do before the machines took over.
So I needed a way to start accumulating positions before the breakout. The consolidation pivot works that way and goes hand in hand with the launchpad setup I wrote about last time. The launchpad tells me the ground under the entry is solid. The consolidation pivot tells me exactly where to draw the line.
Table of Contents
Ross Haber
Every new post, straight to your inbox
If this was useful, the next one will land in your inbox the day I write it.
Why the Consolidation Pivot Matters
A textbook CANSLIM® breakout typically occurs within 15 to 20 percent of the prior high on the left side of the base. That works — it's how I traded for years, and it's how Bill O'Neil taught it: let the prior uptrend prove the stock is strong, then wait for the consolidation and the push through the pivot at or just below the high. But it means your entry sits near the top of the structure, your sell stop sits somewhere below it, and managing risk gets harder the further the stock has already traveled.
Then I learned about Stan Weinstein's methodology. Stan buys stocks much earlier — what Bill would call off the bottom, which isn't Bill's style at all. After talking with Stan and studying how many of his stocks worked, buying from Stage 1 into Stage 2, in the lower half of the base, often much closer to the long-term moving averages before the stock really gets going, I stopped treating the two approaches as a choice. The consolidation pivot is where I mix them: O'Neil's insistence on a defined level with Weinstein's willingness to take it early.
There's one more advantage, and I'll say up front that this is my observation, not an official study: traditional O'Neil-style breakouts attract what I call breakout watchers — a crowd you're fighting against at the obvious level. Consolidation pivots are not as closely watched. In my experience, that makes them easier to get into, easier to get traction at, and — because you're entering lower in the structure, often near quiet institutional accumulation rather than after it — easier to keep the risk to a minimum.
What Is a Consolidation Pivot?
In general, a consolidation pivot doesn't look much different from a traditional pivot — except that it comes much earlier, while the stock is still forming the right side of its base. What they are is simple: prior significant swing highs, found by looking to the left of the stock's base or consolidation. Each of those highs is a level where supply showed up before. When the stock pushes back through one, that supply has been absorbed, and I have a defined line to buy against.
Where I draw the lines
Before a consolidation pivot becomes actionable
- A real swing high to the left. Significant prior highs inside the base or consolidation, not every minor wiggle. On most charts that's two or three horizontal lines, drawn in the lower half of the structure.
- The launchpad underneath. As often as I can, I want the key moving averages converging in a tight bunch to the upside beneath price as the level breaks — ideally the full set, but a shorter-term pad of the 10-day SMA, 21-day SMA, and 23 EMA counts. Best of all is when it's happening across the whole group at once.
- The stock's own personality. Look left. Which moving average did it respect on the prior advance? That's the line I'll manage against after entry, not whichever average looks best today.
- Volume picking up at the level. A consolidation pivot broken on rising volume, after the base has tightened up, carries far more weight than one drifted through quietly.
- Confluence. My sweet spot is when the consolidation pivot and the declining tops trendline cross at the same level, and the stock pushes through both. GILD below is exactly that.
Pro tip: The names don't matter — the levels do. Call it a consolidation pivot, a prior swing high, or resistance. What you're marking is where supply lived last time, so you know the moment it's gone.
The line that keeps me out
Here's the rule: it's how I know when I'm wrong to even be interested: I don't start buying a stock — even after what I'd consider a consolidation pivot — while it's still trading below its long-term declining tops trendline. Below that line, at best you're at the end of Stage 1. The stock hasn't officially started moving out of Stage 1 into Stage 2, consolidation pivot or not, and most of the time I leave it alone.
The one exception is context: a stock that hasn't caught up to a group that's moving powerfully through, all together. I may make an exception there based on the environment. Otherwise the rule stands, and it's done more to keep me out of dead money than any screen I run. A level in the wrong stage isn't an early entry — it's just early.
Five Consolidation Pivots, Marked on Real Charts
ANF — three lines and a 23-day EMA that does the work
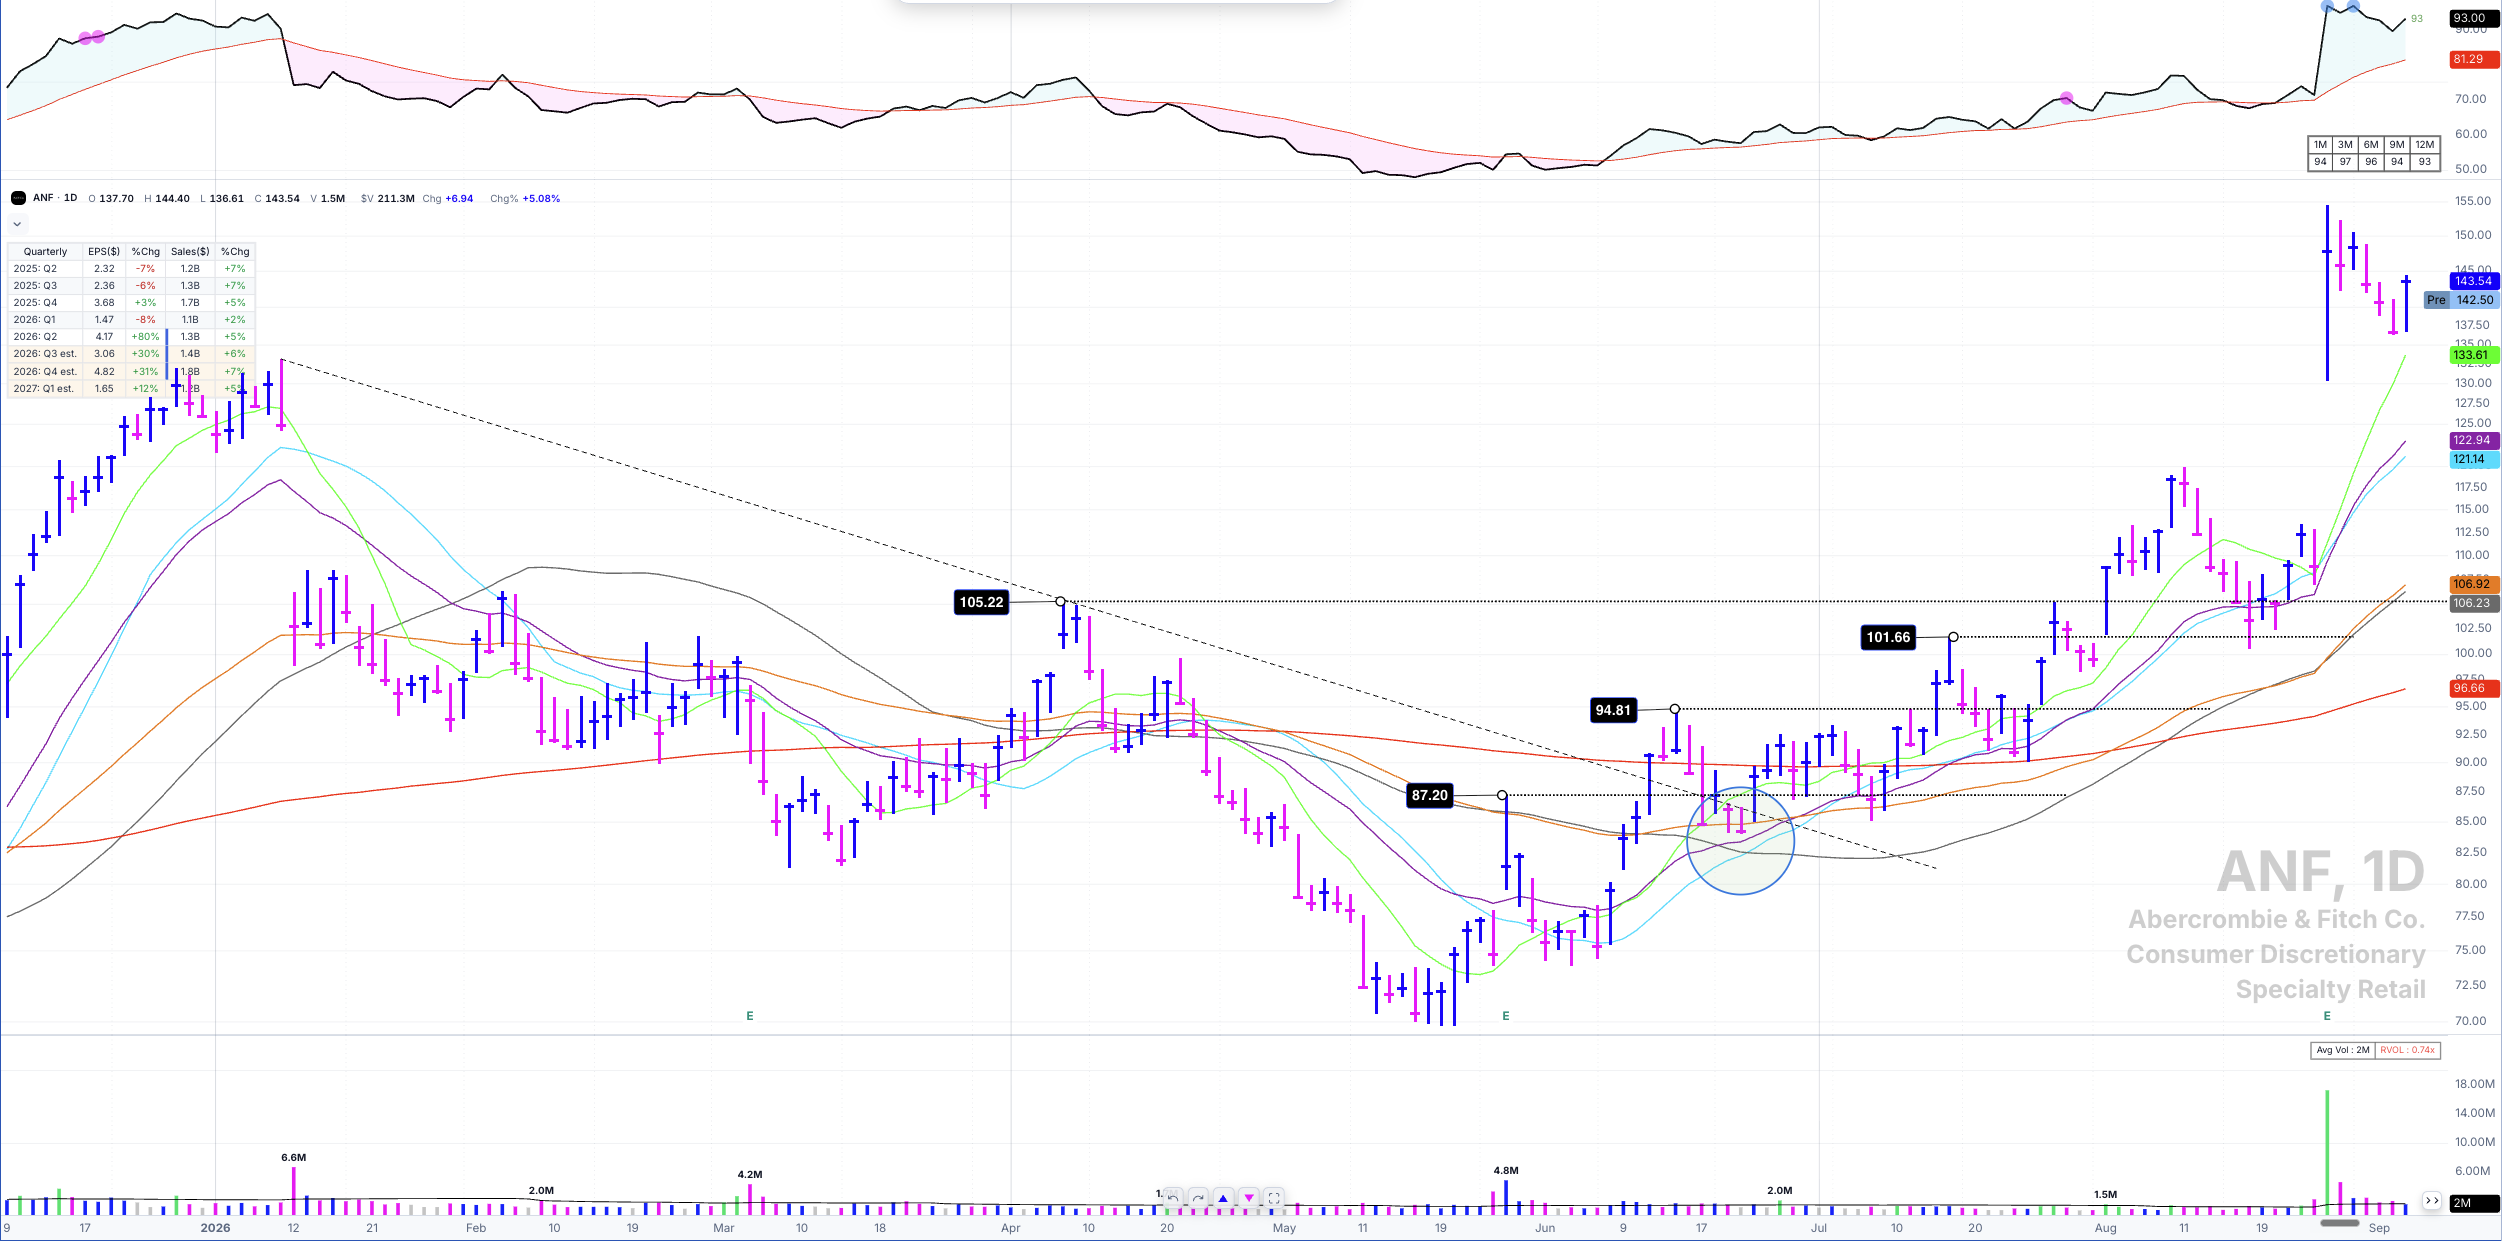
From the January 9th high through today. The averages converge in June, tighten again in July, and the three consolidation pivots stack up on the right side — each one actionable only after the declining tops line was behind it.
I'm looking at ANF from its high on January 9th, 2026 through today. The key moving averages begin converging in a tight bunch beneath price around June 18th to the 22nd, with further tightening around July 6th, and then they expand as price rides up. Which average matters here? Look left: during the prior run, ANF picked up support at its 23 EMA again and again, and respected it much better than the 21-day SMA. That's why the 23 EMA is the management line on this chart.
The consolidation pivots are marked at $87.20, $94.81, and $101.66. The $87.20 level becomes actionable once the stock is past its declining tops line; the first fully tenable entry then comes through the $94.81 pivot, just above the 200-day SMA and very close to where the moving average cross is happening. Since then, the stock has held its 23-day EMA for the most part, and the few times it dipped below, the longer-term averages picked it up — constructive action, exactly what you want to see. One honest note on personality: ANF can whip back and forth around its short-term averages, so take that into account as you add shares.
GILD — the confluence I look for
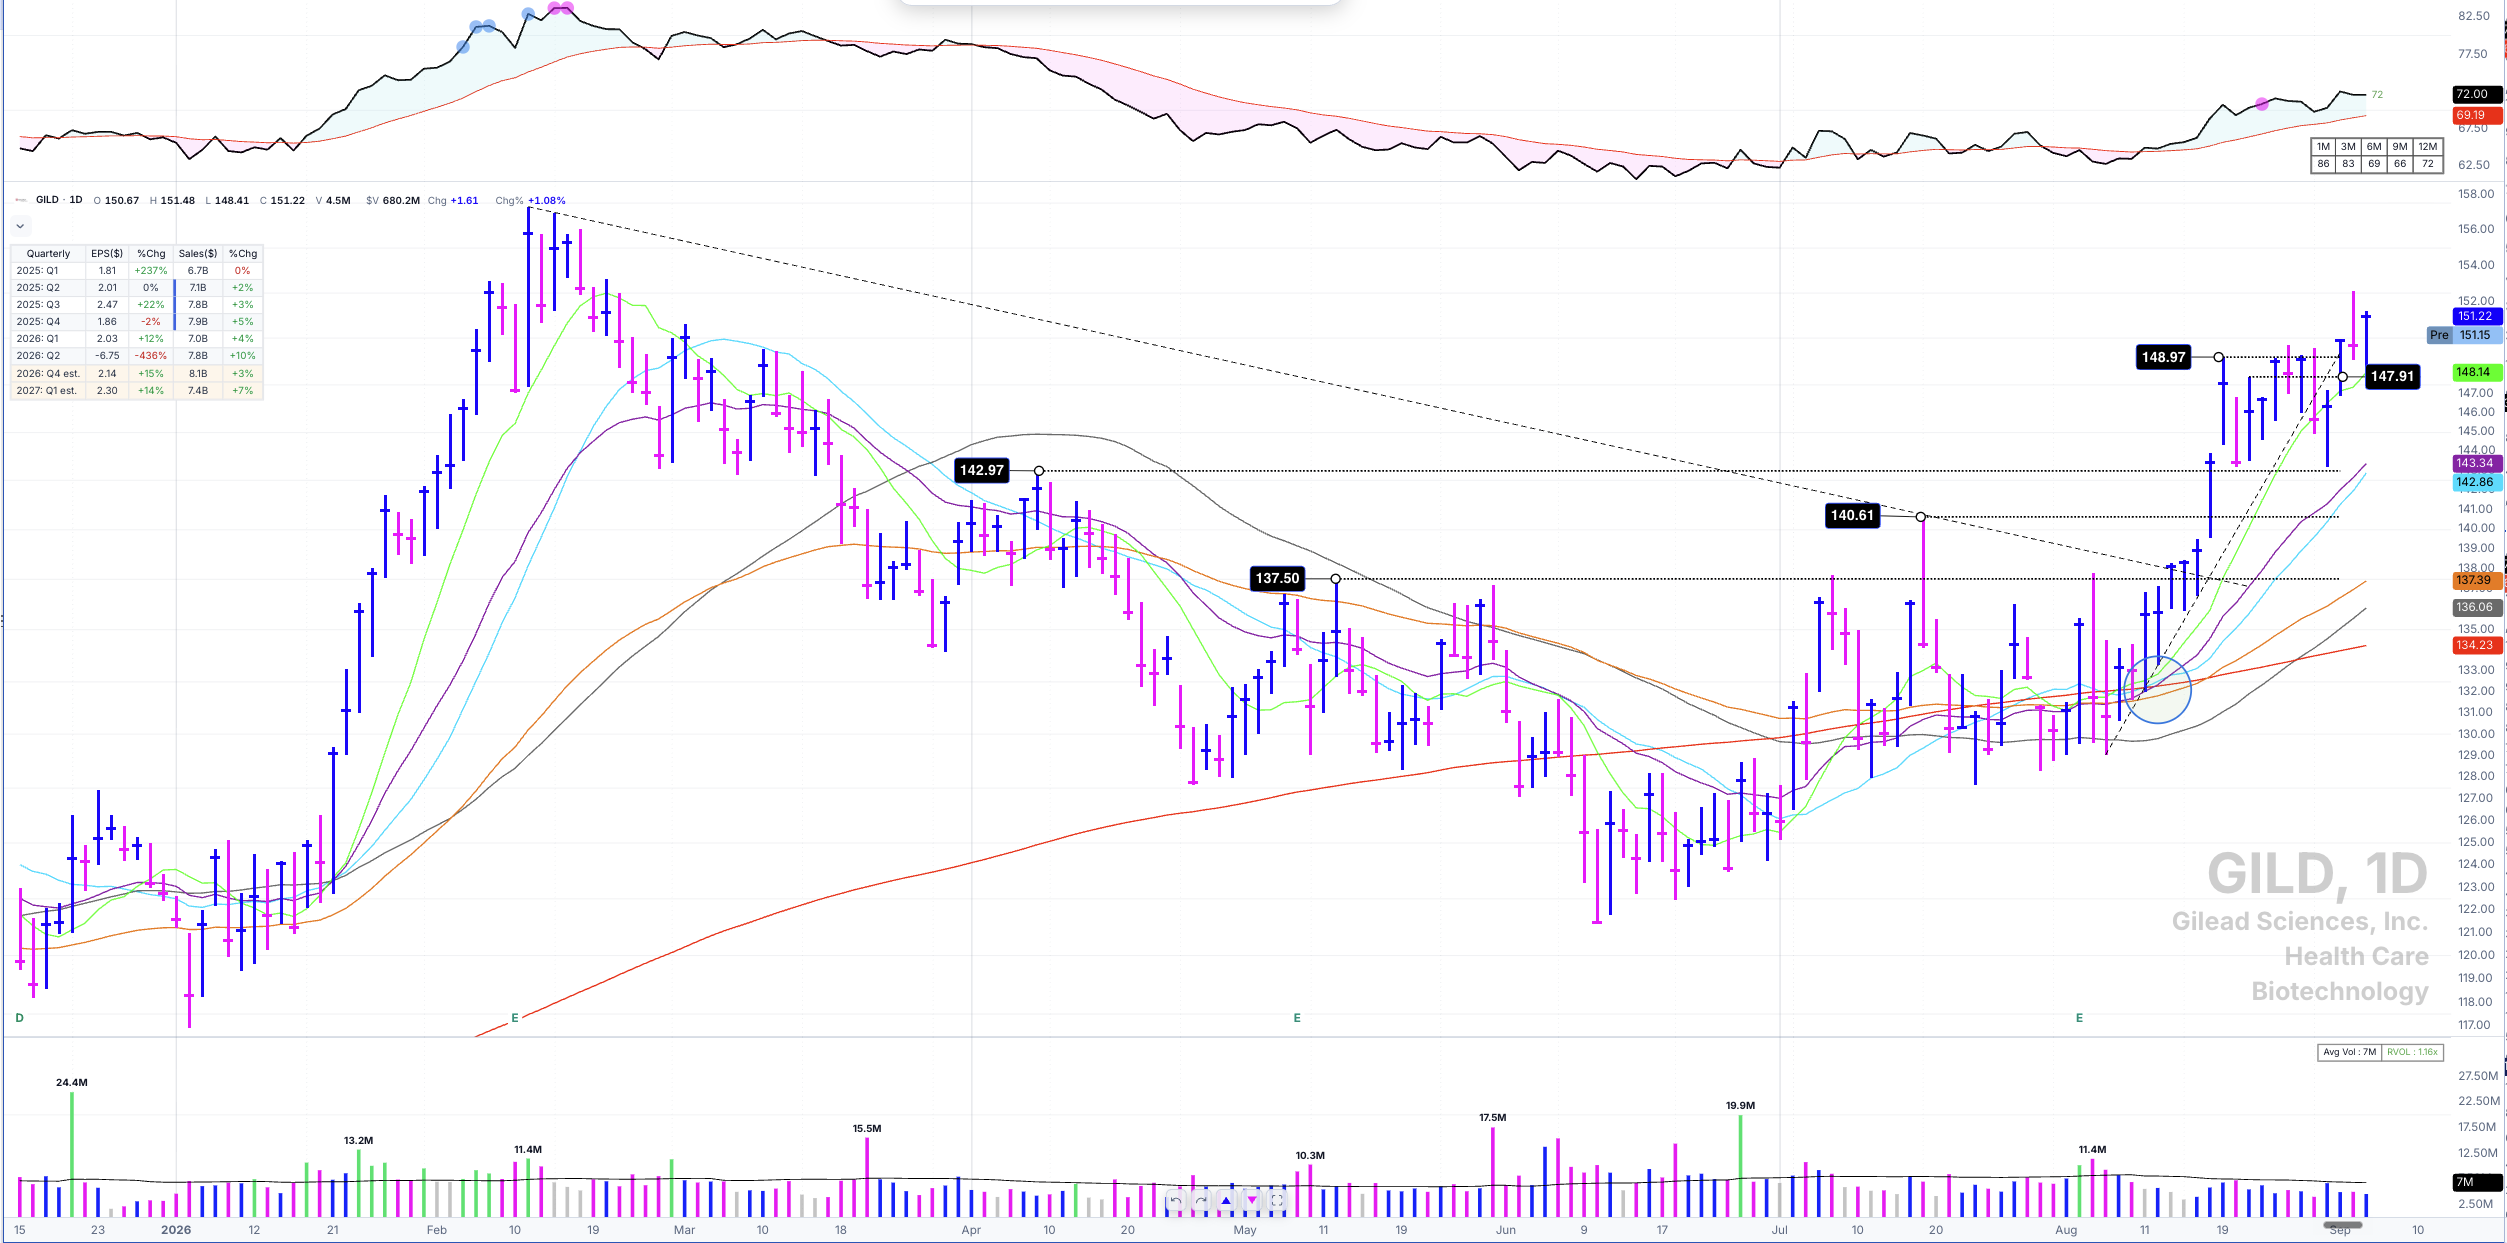
The $137.50 line runs across the prior highs right where the declining tops line meets it. The stock pushes through both together, and volume picks up. That's the sweet spot.
GILD's base starts from the high on February 11th, 2026, and the main launchpad cross lands on August 12th. Look all the way to the left, and there's resistance at $137.50 — and notice that the declining tops line comes down across those same highs. When the stock finally pushed through the confluence of the $137.50 consolidation pivot and the declining tops line, volume started to pick up. That is my sweet spot for entering, if I can get it.
And look at what it buys you. The stock now trades in the 150s. Getting started in the 130s, much closer to the bottom of the base, instead of waiting for it to travel — that's the difference between managing risk from a logical level and chasing. It's the same argument I made in why the lowest price isn't the best price, run in the other direction: I don't want the low. I want the earliest level I can defend.
SPCX — a new issue with no left side to lean on
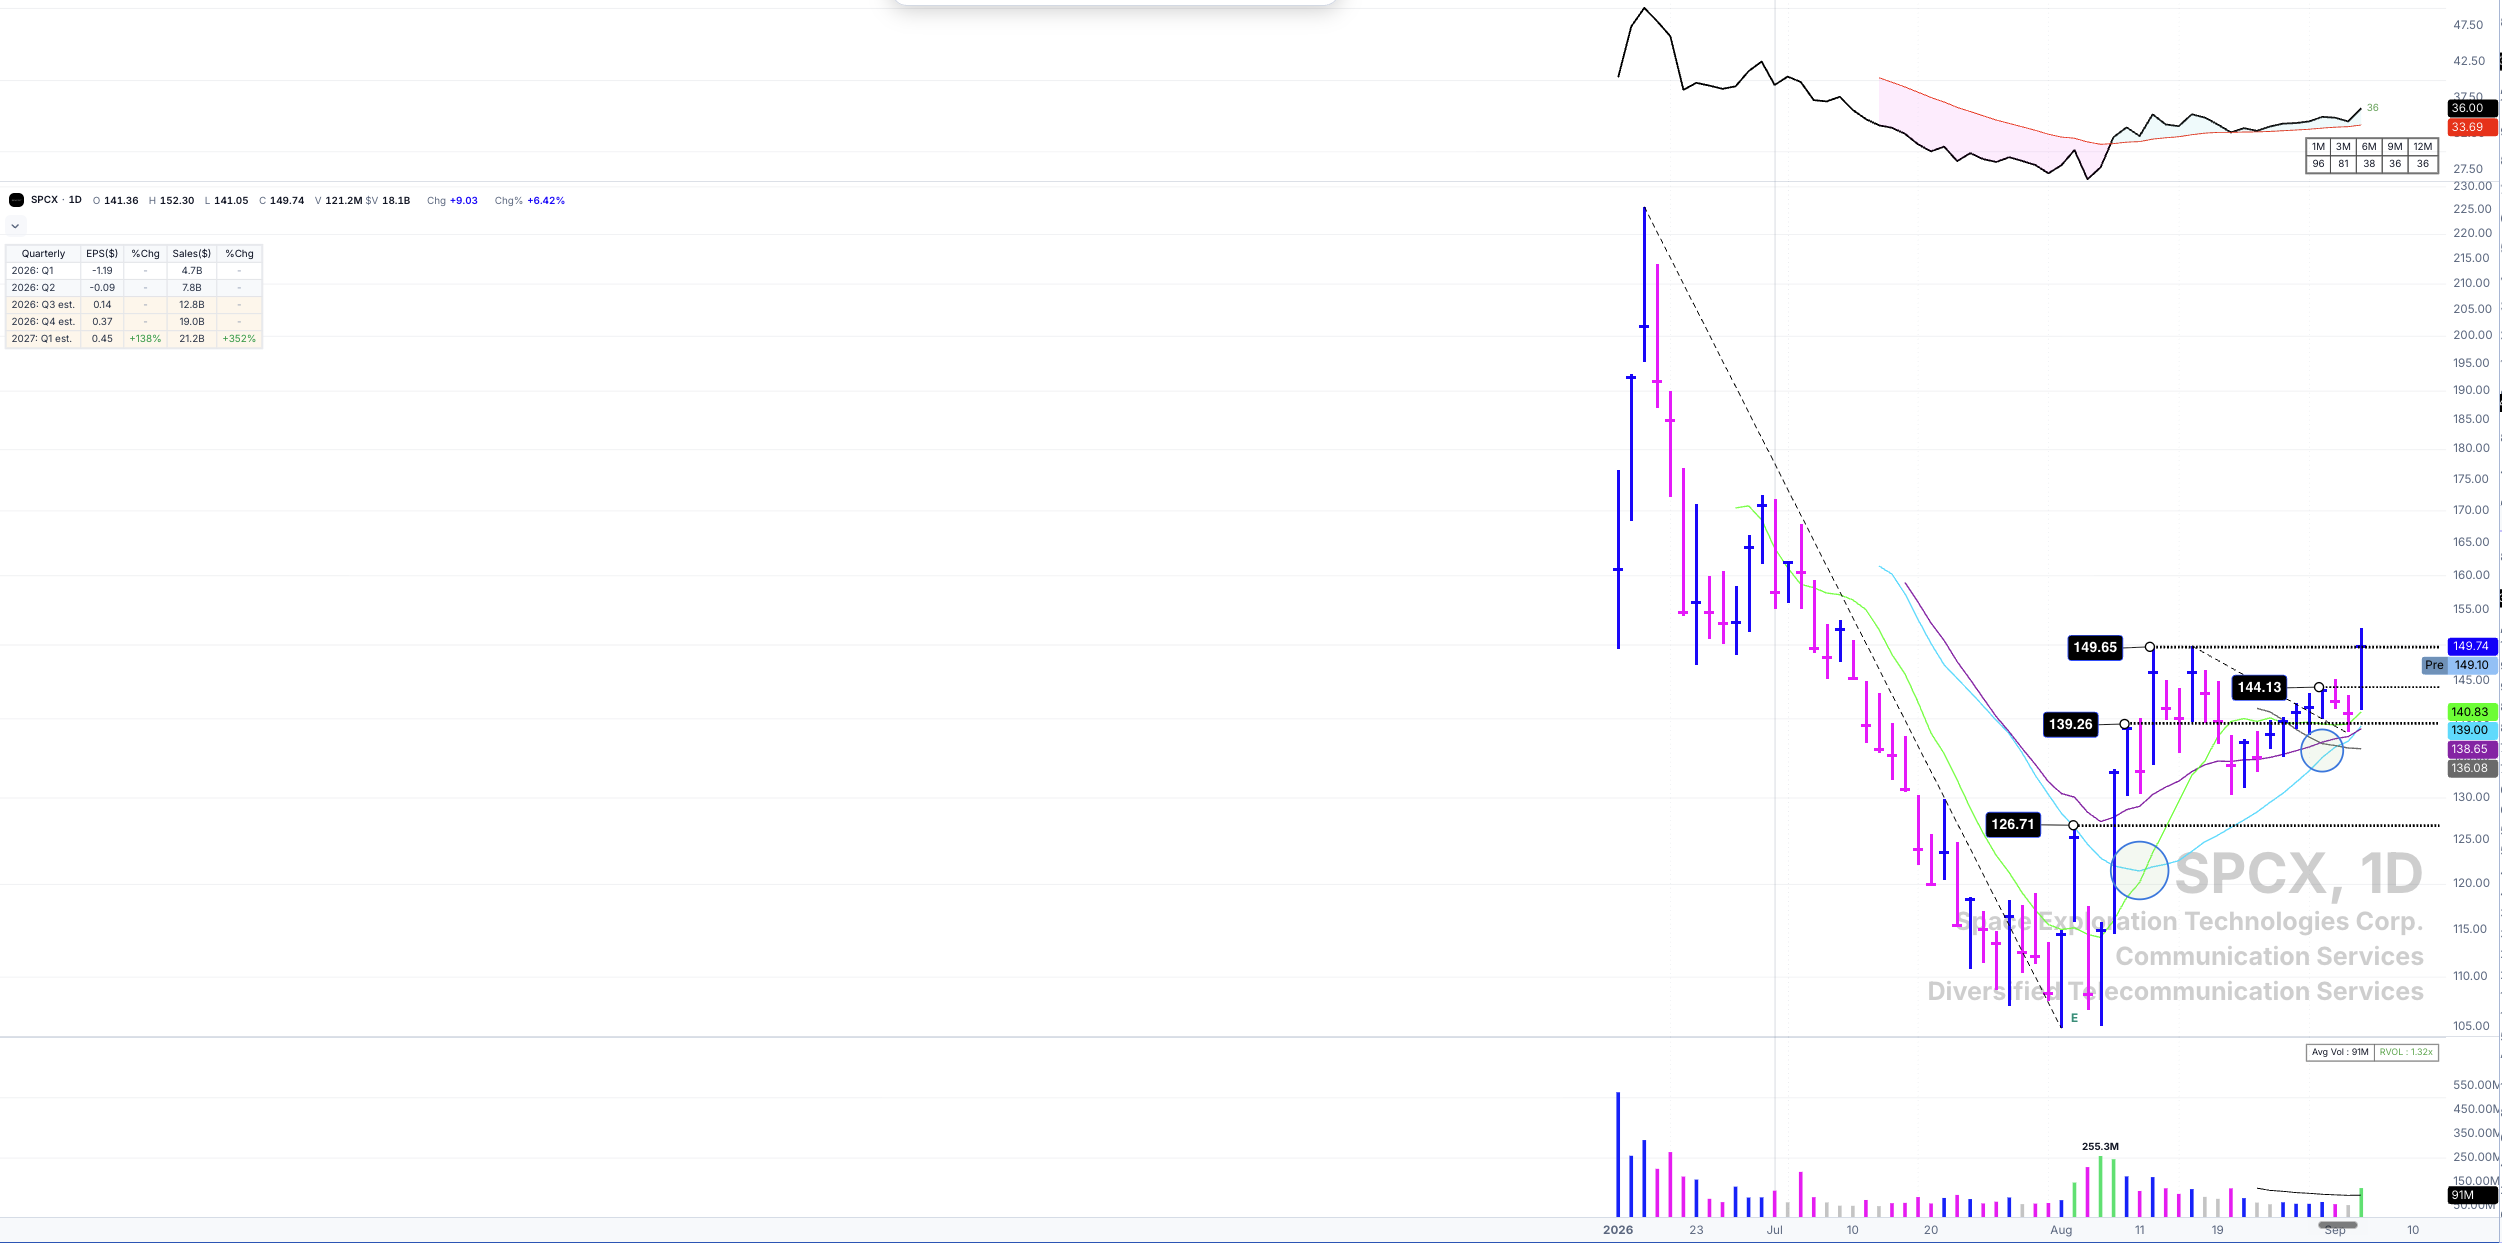
Three months of trading history, three usable lines. Today it took out the 149.65 pivot on volume with the young averages bunched right underneath.
SpaceX — SPCX — went public on June 12th, 2026, so there's no multi-year base to study. But the swing highs are already there: consolidation pivots at $126.71, $139.26, and $149.65 from August 12th, which is the one it broke through on a pickup in volume. If you were paying attention, you could have even cheated your way in at the August 31st high of $144.13, just under the official line.
The moving averages a stock this young has — the 10-day SMA, 21-day SMA, 23 EMA, and a 50-day SMA that's only just started curving around — were converged in a tight bunch beneath price right as it pushed through. To me, that's a very feasible spot to add. And here's the point of the whole exercise: this action is happening in the 140s while the all-time high sits up near $224. A traditional breakout entry doesn't exist yet. The consolidation pivot gets you working long before it does — assuming, as always, the stock holds up its end.
NVDA — the lower half, illustrated
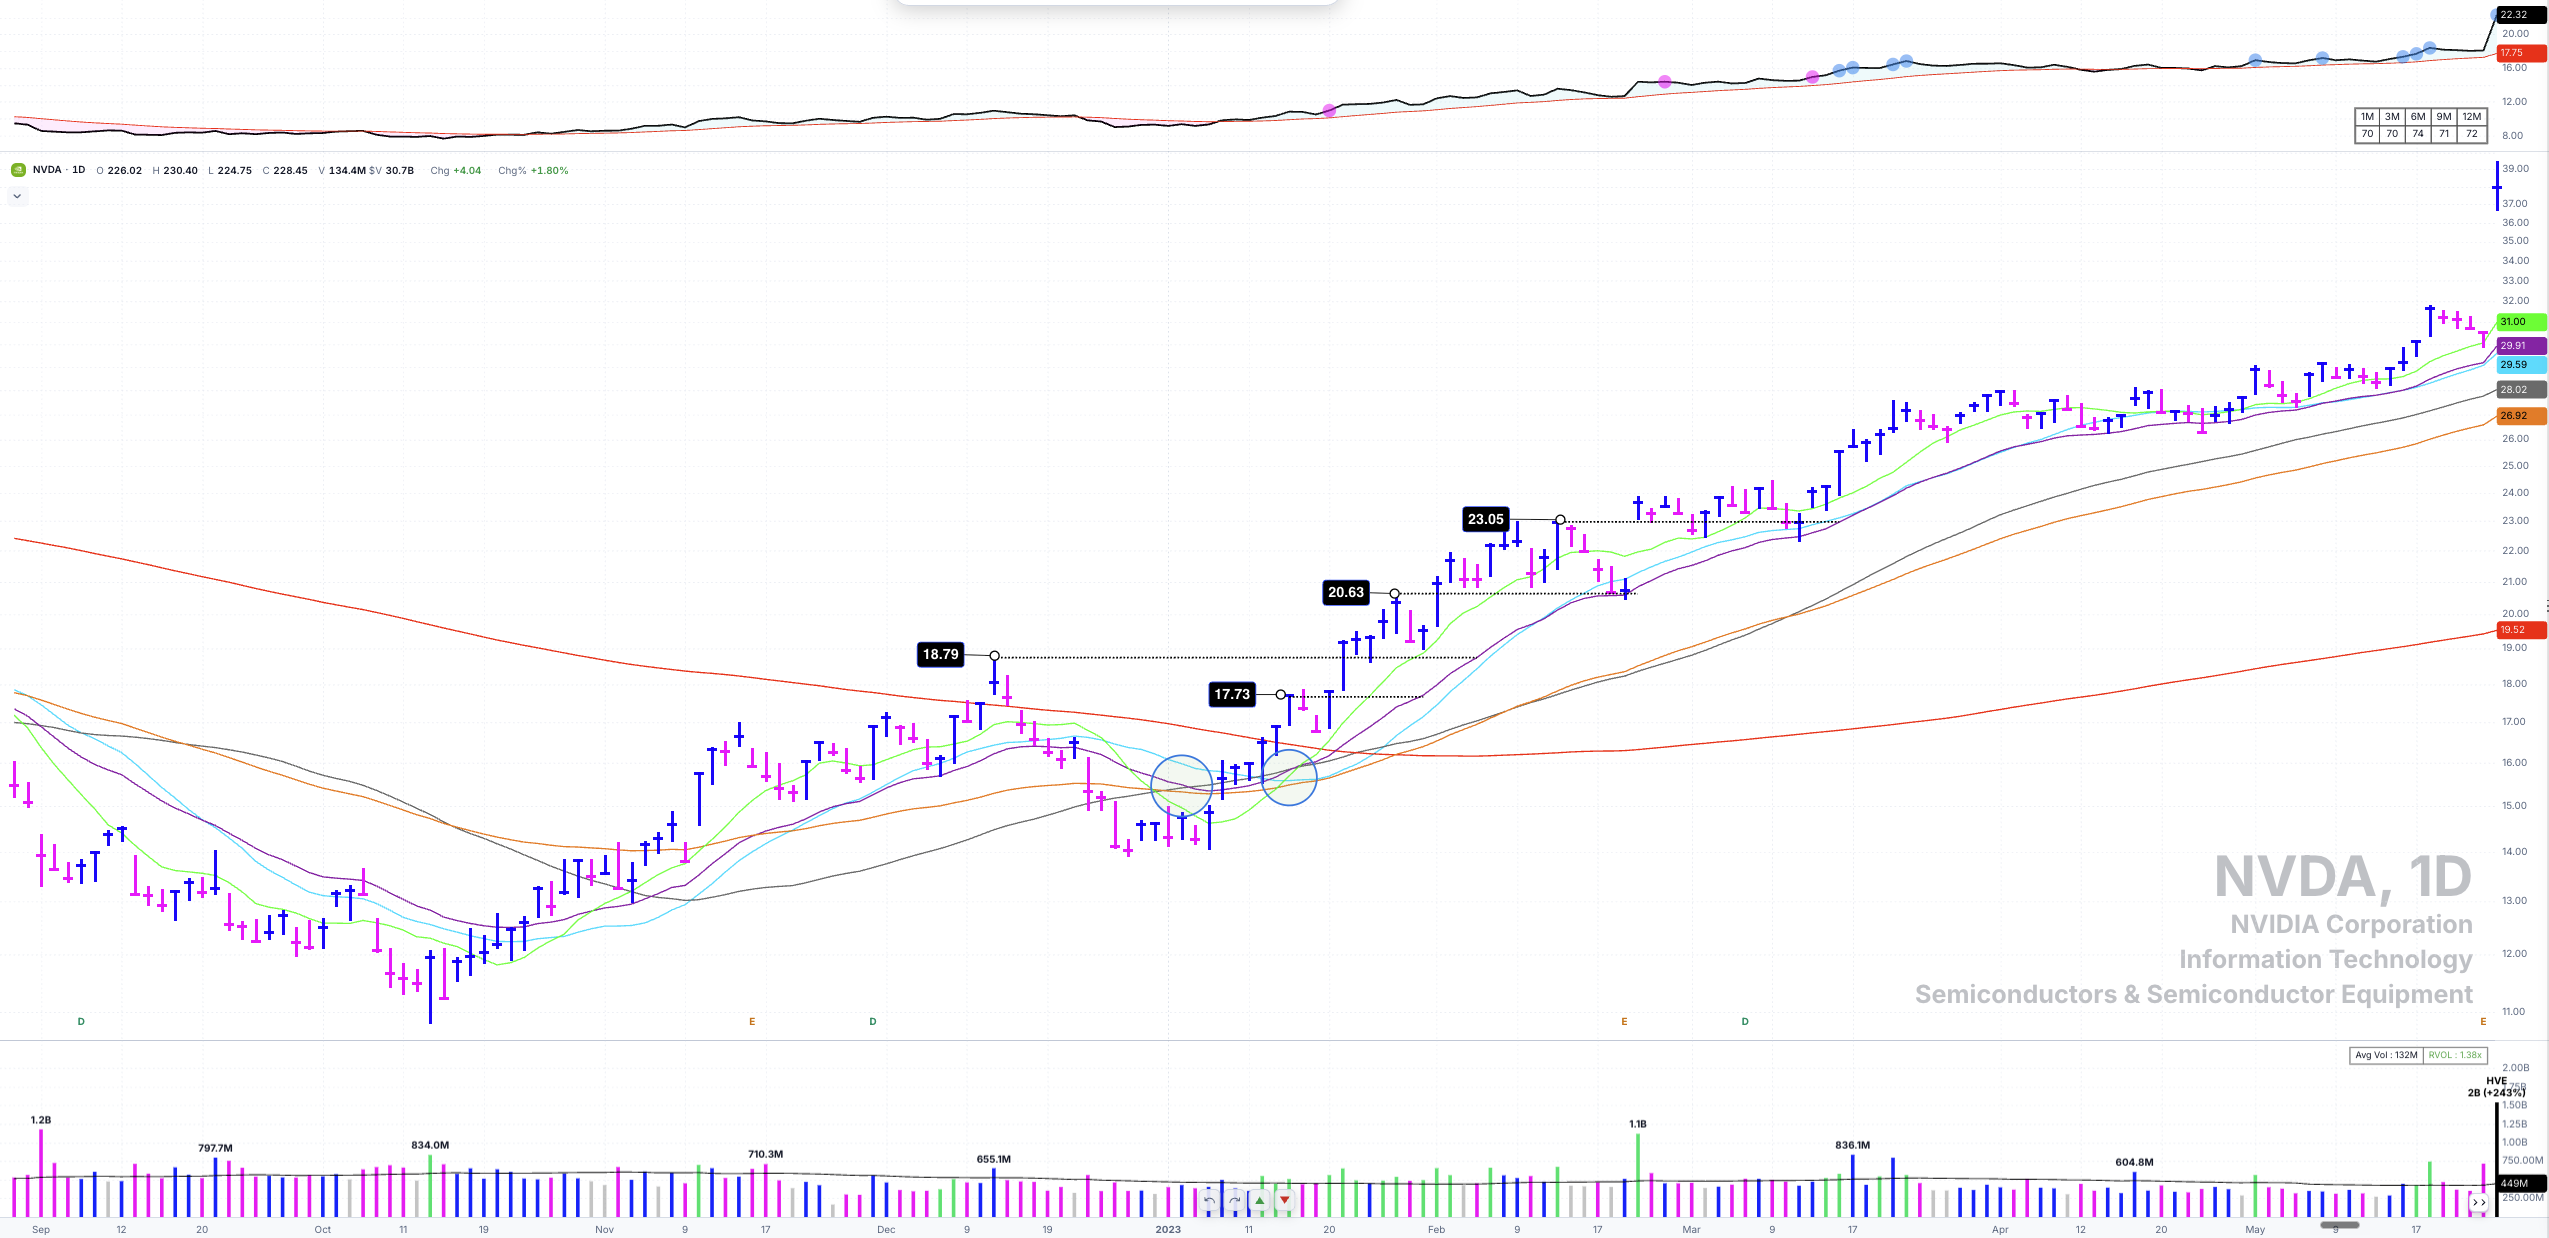
Left-side high at 34.65. First viable consolidation pivots under 19. If "lower half of the base" ever needed one chart, this is it.
Go back in time with me on NVDA. The high on the left side of the base is $34.65, set on November 22nd, 2021. Through 2022, the stock builds out the base, and as the right side forms, the longer-term moving averages give a slight cross around January 4th, 2023 — I take note of that, almost as part of the launchpad — with the official cross on January 18th as price is moving up and all the averages are pointing higher.
The first two viable consolidation pivots: $17.73, the high from January 17th, 2023, and $18.79, the high from December 12th, 2022. Both sit at roughly half the left-side high. Once the stock is out of Stage 1, into Stage 2, and better still above all of its key moving averages, those are the levels to enter at — a full year before price ever revisits $34.65. That's what buying the right side of a base early actually looks like, and it's why I'd rather mark swing highs than wait for the one at the top.
APA — the one that gapped away
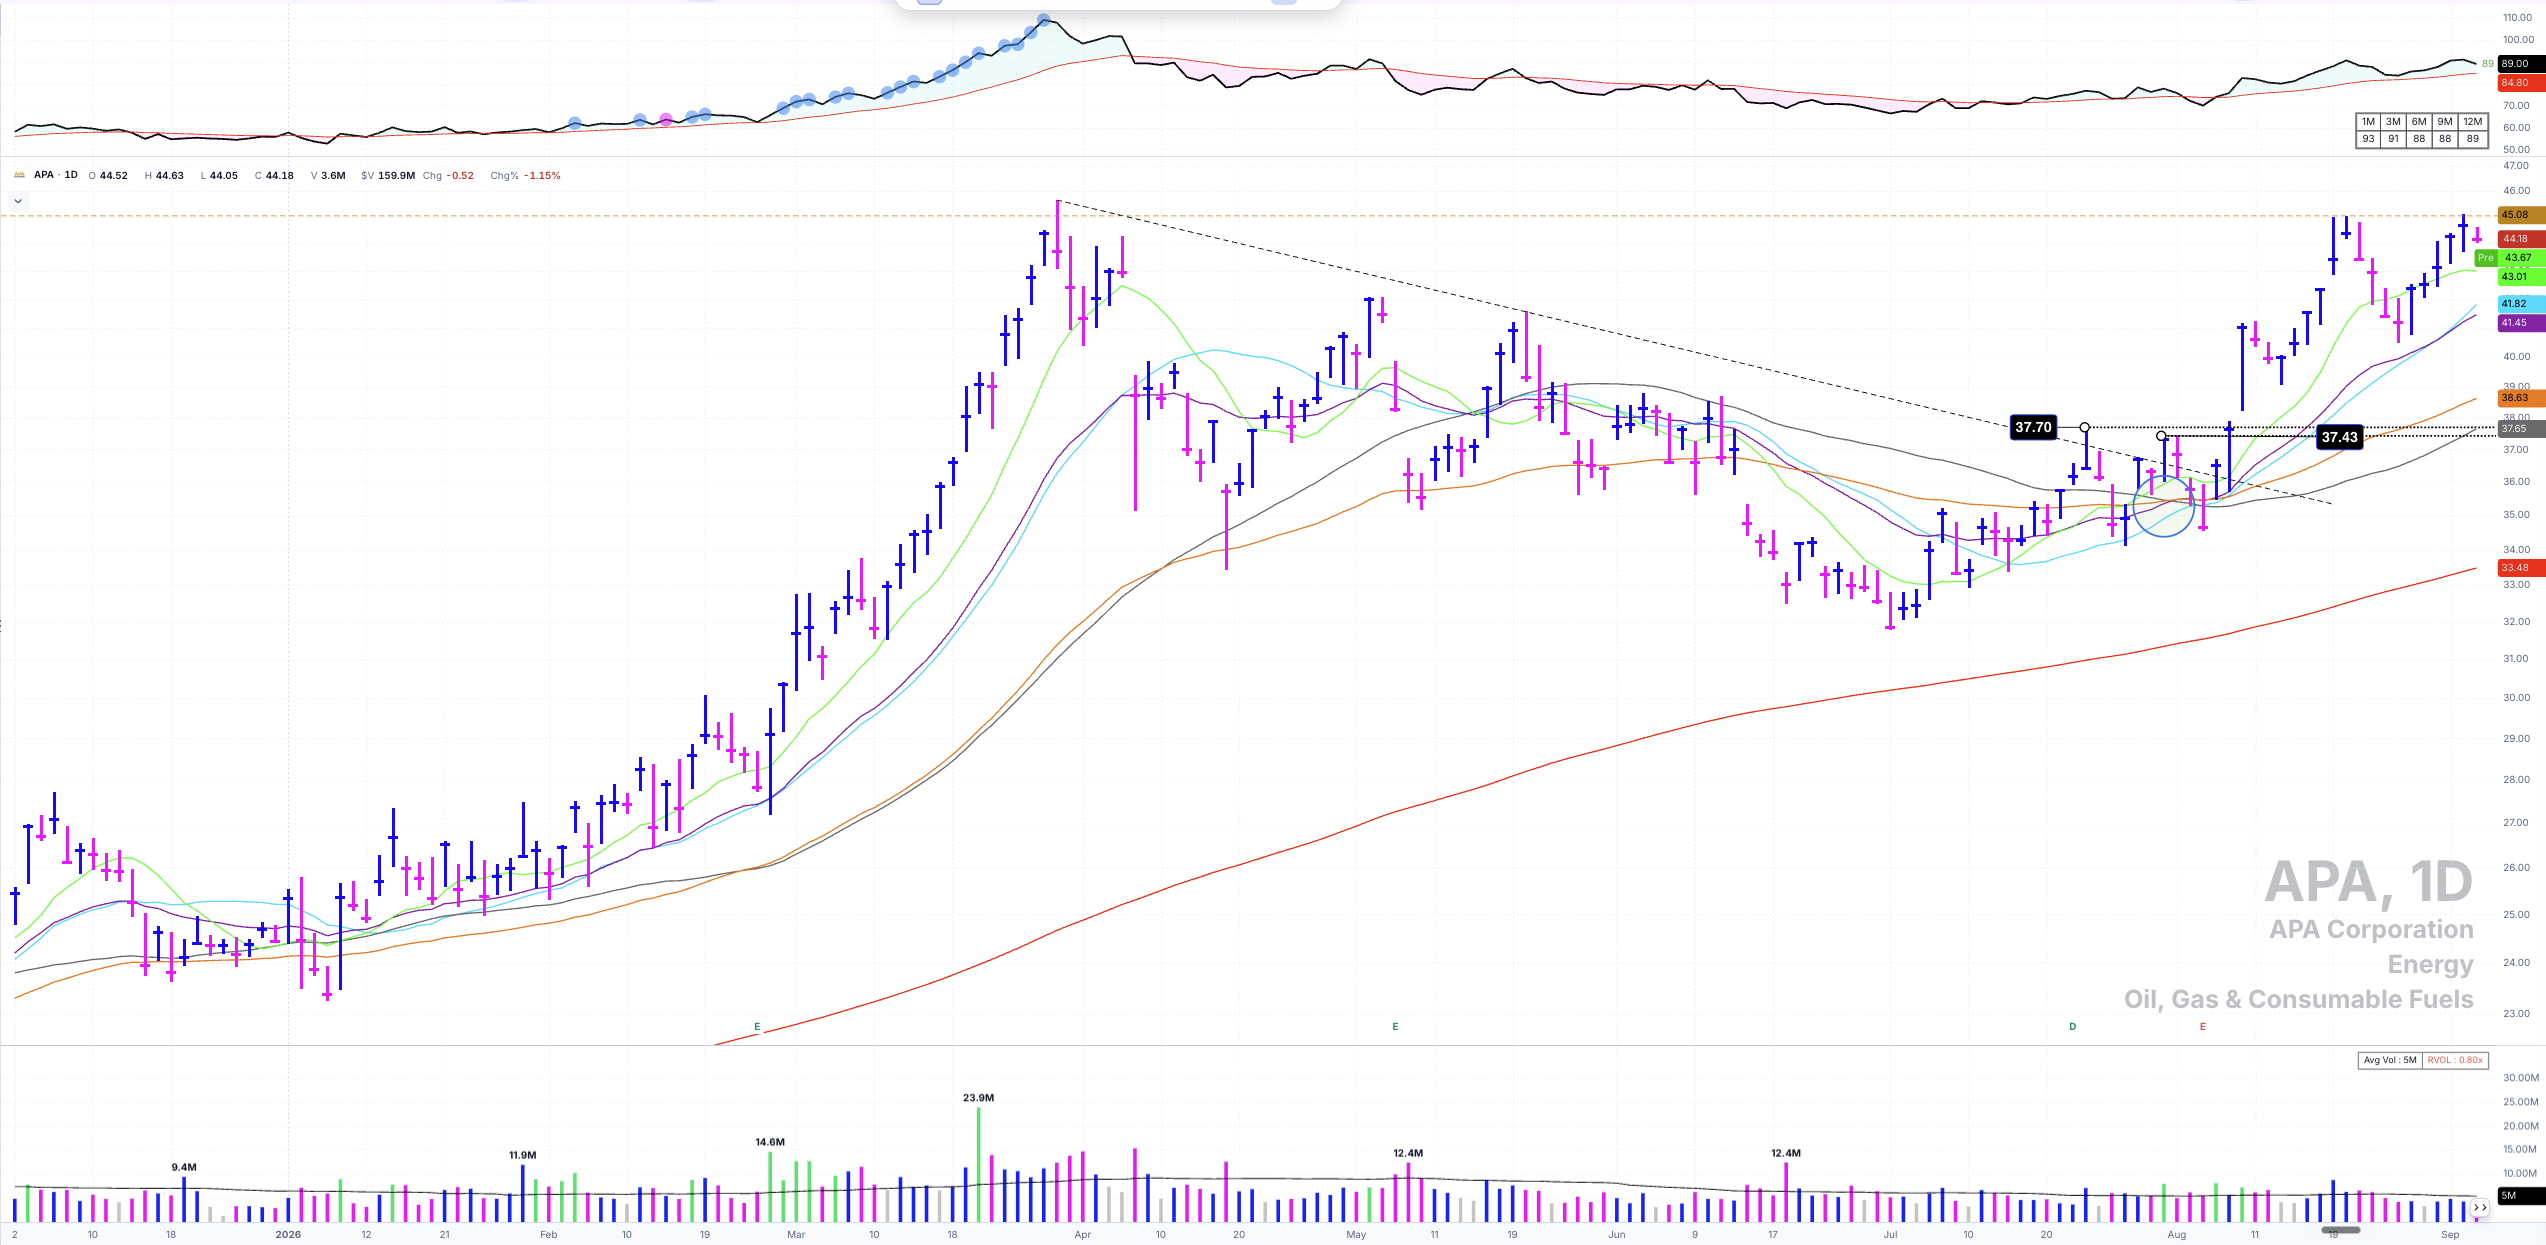
The 37.70 line was the spot. The August 10th gap took it without me. Now it's working on the traditional cup-with-handle everyone else is watching.
I owe you a miss, so here's APA. Downtrend from December 2025, high on the left side of the base on March 30th, 2026. The moving average cross comes on August 3rd — every key average except the 200-day SMA — and the averages begin to expand. The first consolidation pivot to me was the $37.70 high from July 23rd. Unfortunately, on August 10th, the stock gapped straight through it. No fill at the level, no entry to manage from it. You could have cheated your way in the day prior through $37.43 if you were so inclined — it has maintained a heck of an uptrend since — but the clean early entry was gone in one open.
Worth saying plainly: APA now sits just prior to its old high, working on what you'd call a cup-with-handle, a traditional O'Neil-style base breakout. Those still work. I'm just very selective about which ones I'll do — and this is actually one I'd consider buying on the breakout. The consolidation pivot didn't replace the traditional entry for me. It gave me an earlier one when the market allowed it, but this time it didn't.
What to Do This Week
- Pull the top ten relative strength names in the two or three strongest groups. The Deepvue screener builds the list in about 20 minutes.
- On each chart forming a right side, look left and mark every significant swing high inside the base. Two or three horizontal lines per chart. Those are your consolidation pivots.
- Draw the long-term declining tops trendline. Cross off every pivot that sits below it — those aren't entries yet, no matter how clean the level looks.
- Check what's underneath the surviving levels. Deepvue's Launch Pad indicator flags the moving average convergence for you; without it, you want the averages bunched tight beneath price, turning up.
- Write the exit before the entry: which average does this stock respect, and where does selling against that average put your stop? If you can't answer both, you don't have a trade — set the alert at the pivot and wait for volume.
The Consolidation Pivots on My Focus List Right Now
Twice a week in The TML Report, I walk through the market's posture and a Focus List of 8–12 True Market Leaders — with the consolidation pivots, declining tops lines, and launchpads marked on every chart, at the levels I'm actually managing against.
Read The TML ReportFrequently Asked Questions
CAN SLIM® is a registered trademark of O’Neil Capital Management, Inc. (U.S. Reg. No. 3,081,940). TraderLion is not affiliated with, sponsored by, endorsed by, or licensed by O’Neil Capital Management, Inc., Investor’s Business Daily, MarketSurge, or their affiliates. Any reference to CAN SLIM® is for descriptive purposes only.