
Buying Cheap Stocks? Why I Buy Strength Instead

Ross
Ross is a co-founder of TraderLion and Deepvue. He was mentored by William O’Neil, and co-authored The Model Book of Greatest Stock Market Winners at WON + Co.
Published: October 29, 2026


 Ross Haber
Every new post, straight to your inbox
If this was useful, the next one will land in your inbox the day I write it.
Should You Buy Cheap Stocks?
Everything we learn about shopping says to wait for a sale. A stock down 50% from its high looks like a bargain, and a stock at an all-time high looks like you missed it. Bill O’Neil called this the great paradox: the stocks that look too high to most people often go higher, and the ones that look cheap often get cheaper.
But the paradox isn’t really about where a stock sits relative to its high. It’s about why you’re buying it. I wrote about the price side of this in why the lowest price isn’t the best entry. This post is about the reason behind the buy: strength, not cheapness.
Why Buying Cheap Stocks Fails
Bill O’Neil studied the biggest winners and found they were showing strength before their major moves, not sitting at their lows waiting to be discovered. Stan Weinstein gave me the other half: a way to see where a stock is in its cycle.
Weinstein breaks every stock into four stages. Stage 1 is the base, where a stock goes sideways after a decline. Stage 2 is the advance. Stage 3 is the top. Stage 4 is the decline, with the stock below a falling 30-week moving average, making lower highs and lower lows. The stock that “looks cheap” is almost always in Stage 4. Every rally runs into people who bought higher and want out, and every low gives way to a lower one.
Combining the two is the core of how I trade. O’Neil tells me what a leader looks like. Weinstein tells me whether the stock is in a stage worth owning. A stock can be a great company and still be in Stage 4. I don’t care how far it’s fallen. I care whether it has stopped falling and started acting strong.
What Buying Strength Looks Like
Strength shows up in two places, and I buy both.
Near the highs
The classic O’Neil buy. A stock comes out of a proper base, like a flat base, at or near all-time highs. No overhead supply, the RS line leading, and volume coming in. Big blue, small red.
Off the highs, moving into Stage 2
This is where Weinstein comes in. A stock can be 40% off its high and still be a buy if it has spent time basing in Stage 1, the 30-week moving average has flattened or turned up, and it’s starting to move into Stage 2. That’s where a launchpad or a consolidation pivot gives me an early entry. I’m not buying it because it’s down. I’m buying it because it stopped going down and started acting strong.
The difference in one line: Two stocks can both be 40% off their highs. One is in Stage 4, still falling. The other is in Stage 1, tight and organized, moving averages converging underneath. The price is the same. The setup isn’t.
What it looks like when it fails
Strength signals fail too. A breakout closes back in the base. A Stage 2 attempt rolls over and the stock drops back under the 30-week moving average. A launchpad breaks the low of the setup. When that happens, the strength I bought is gone, and so is my reason to own it. I sell, take the small loss, and wait for the next setup.
One Cheap Stock, Two Strong Ones
Three charts. One looked like a bargain, and two showed strength.
One that looked cheap
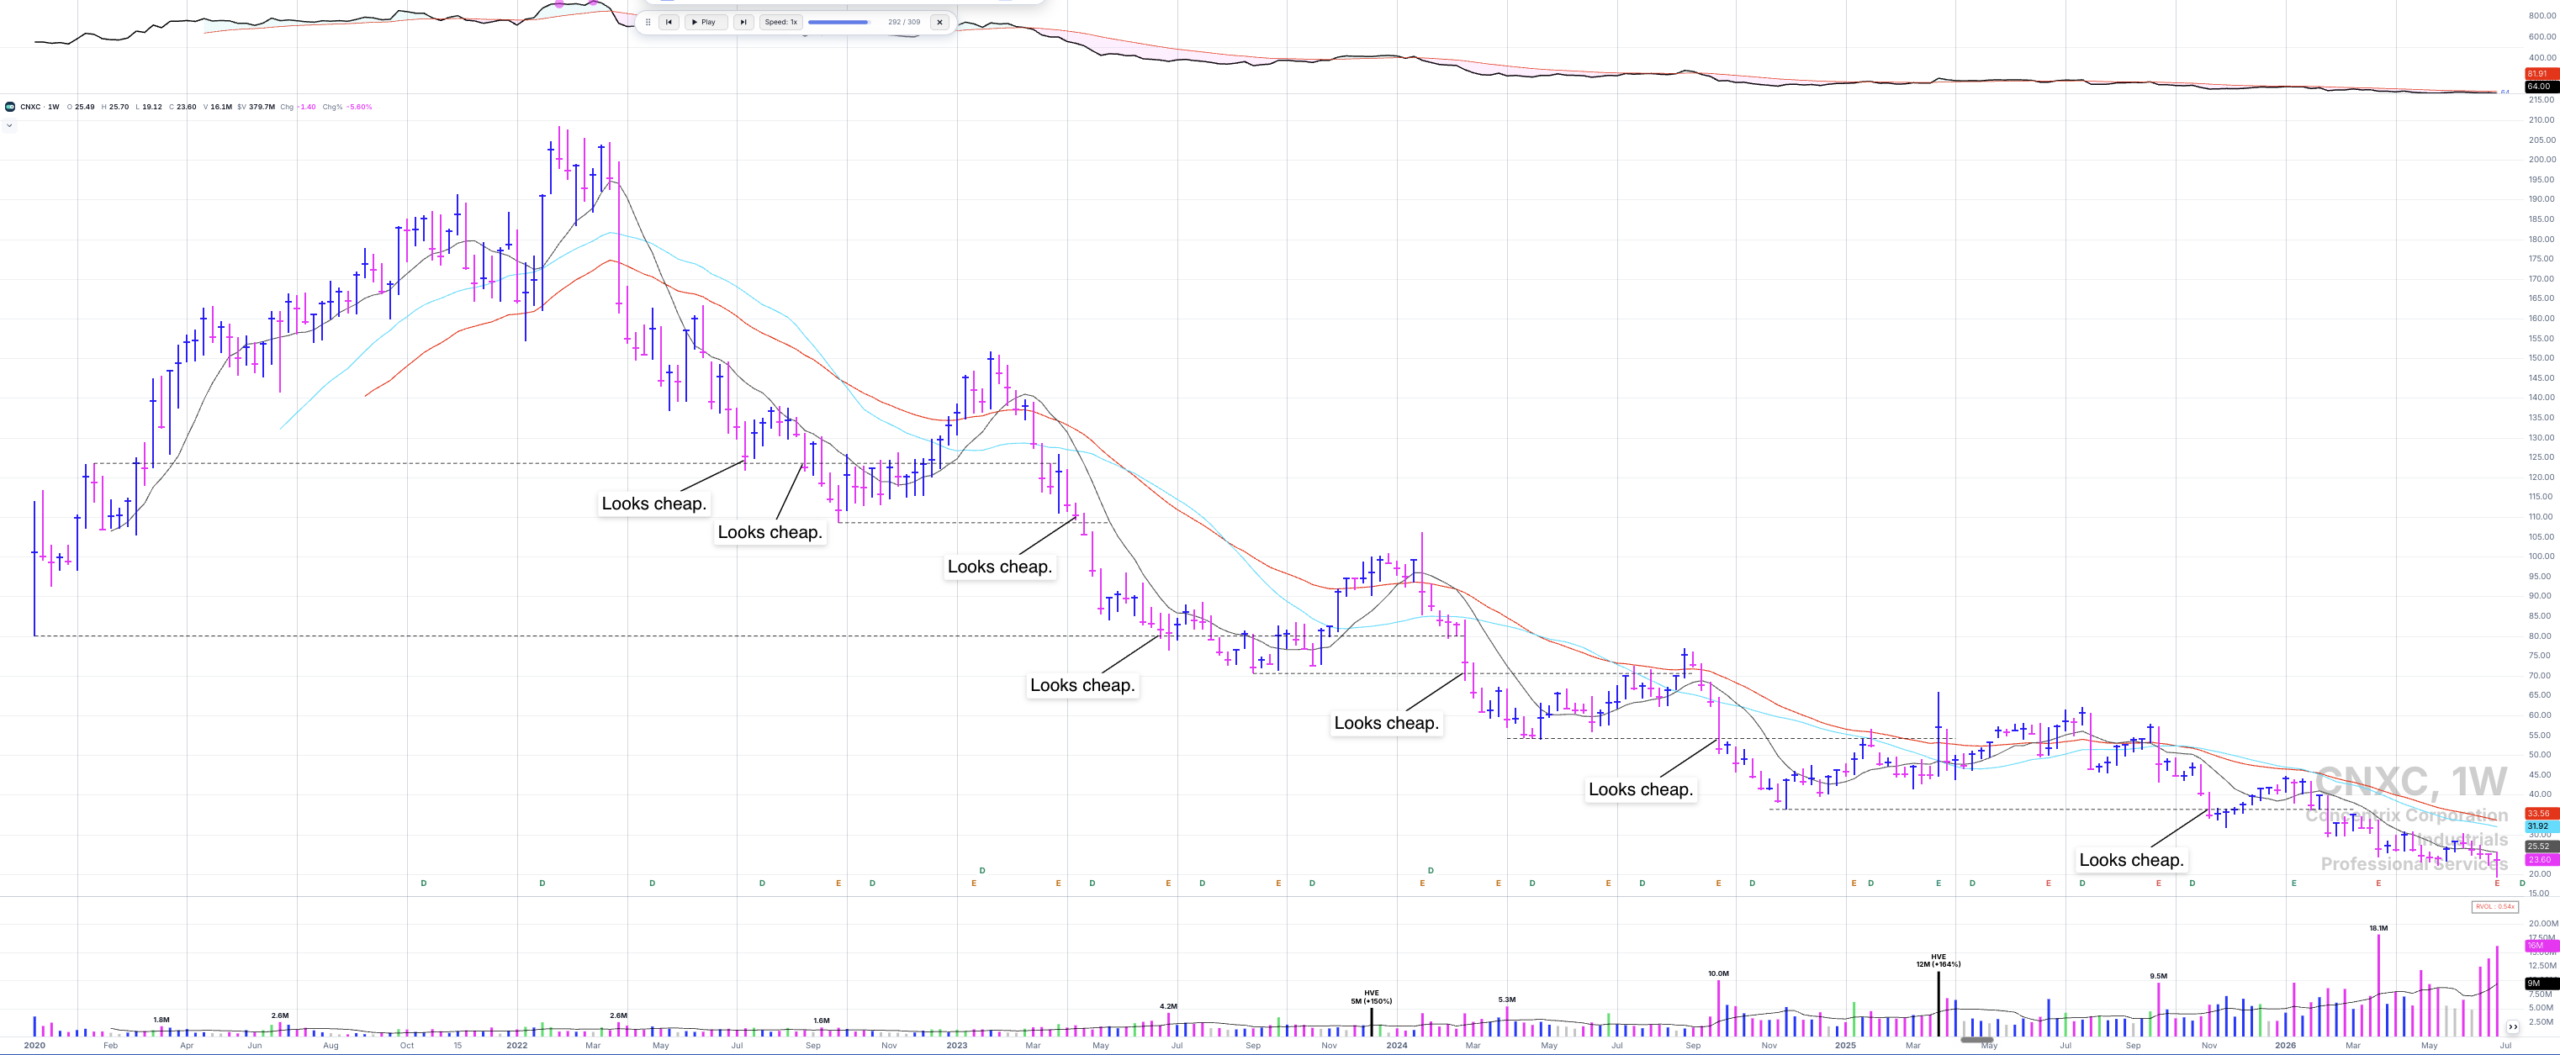
Down 50%, under a falling 30-week moving average. It looked cheap. It got cheaper.
A good company and a story everyone knew. It was down a lot, and that was exactly why so many bought it. But it was in Stage 4: below a falling 30-week moving average, lower highs, lower lows. Each bounce sold off, and each low gave way to a lower one.
Strength off the highs
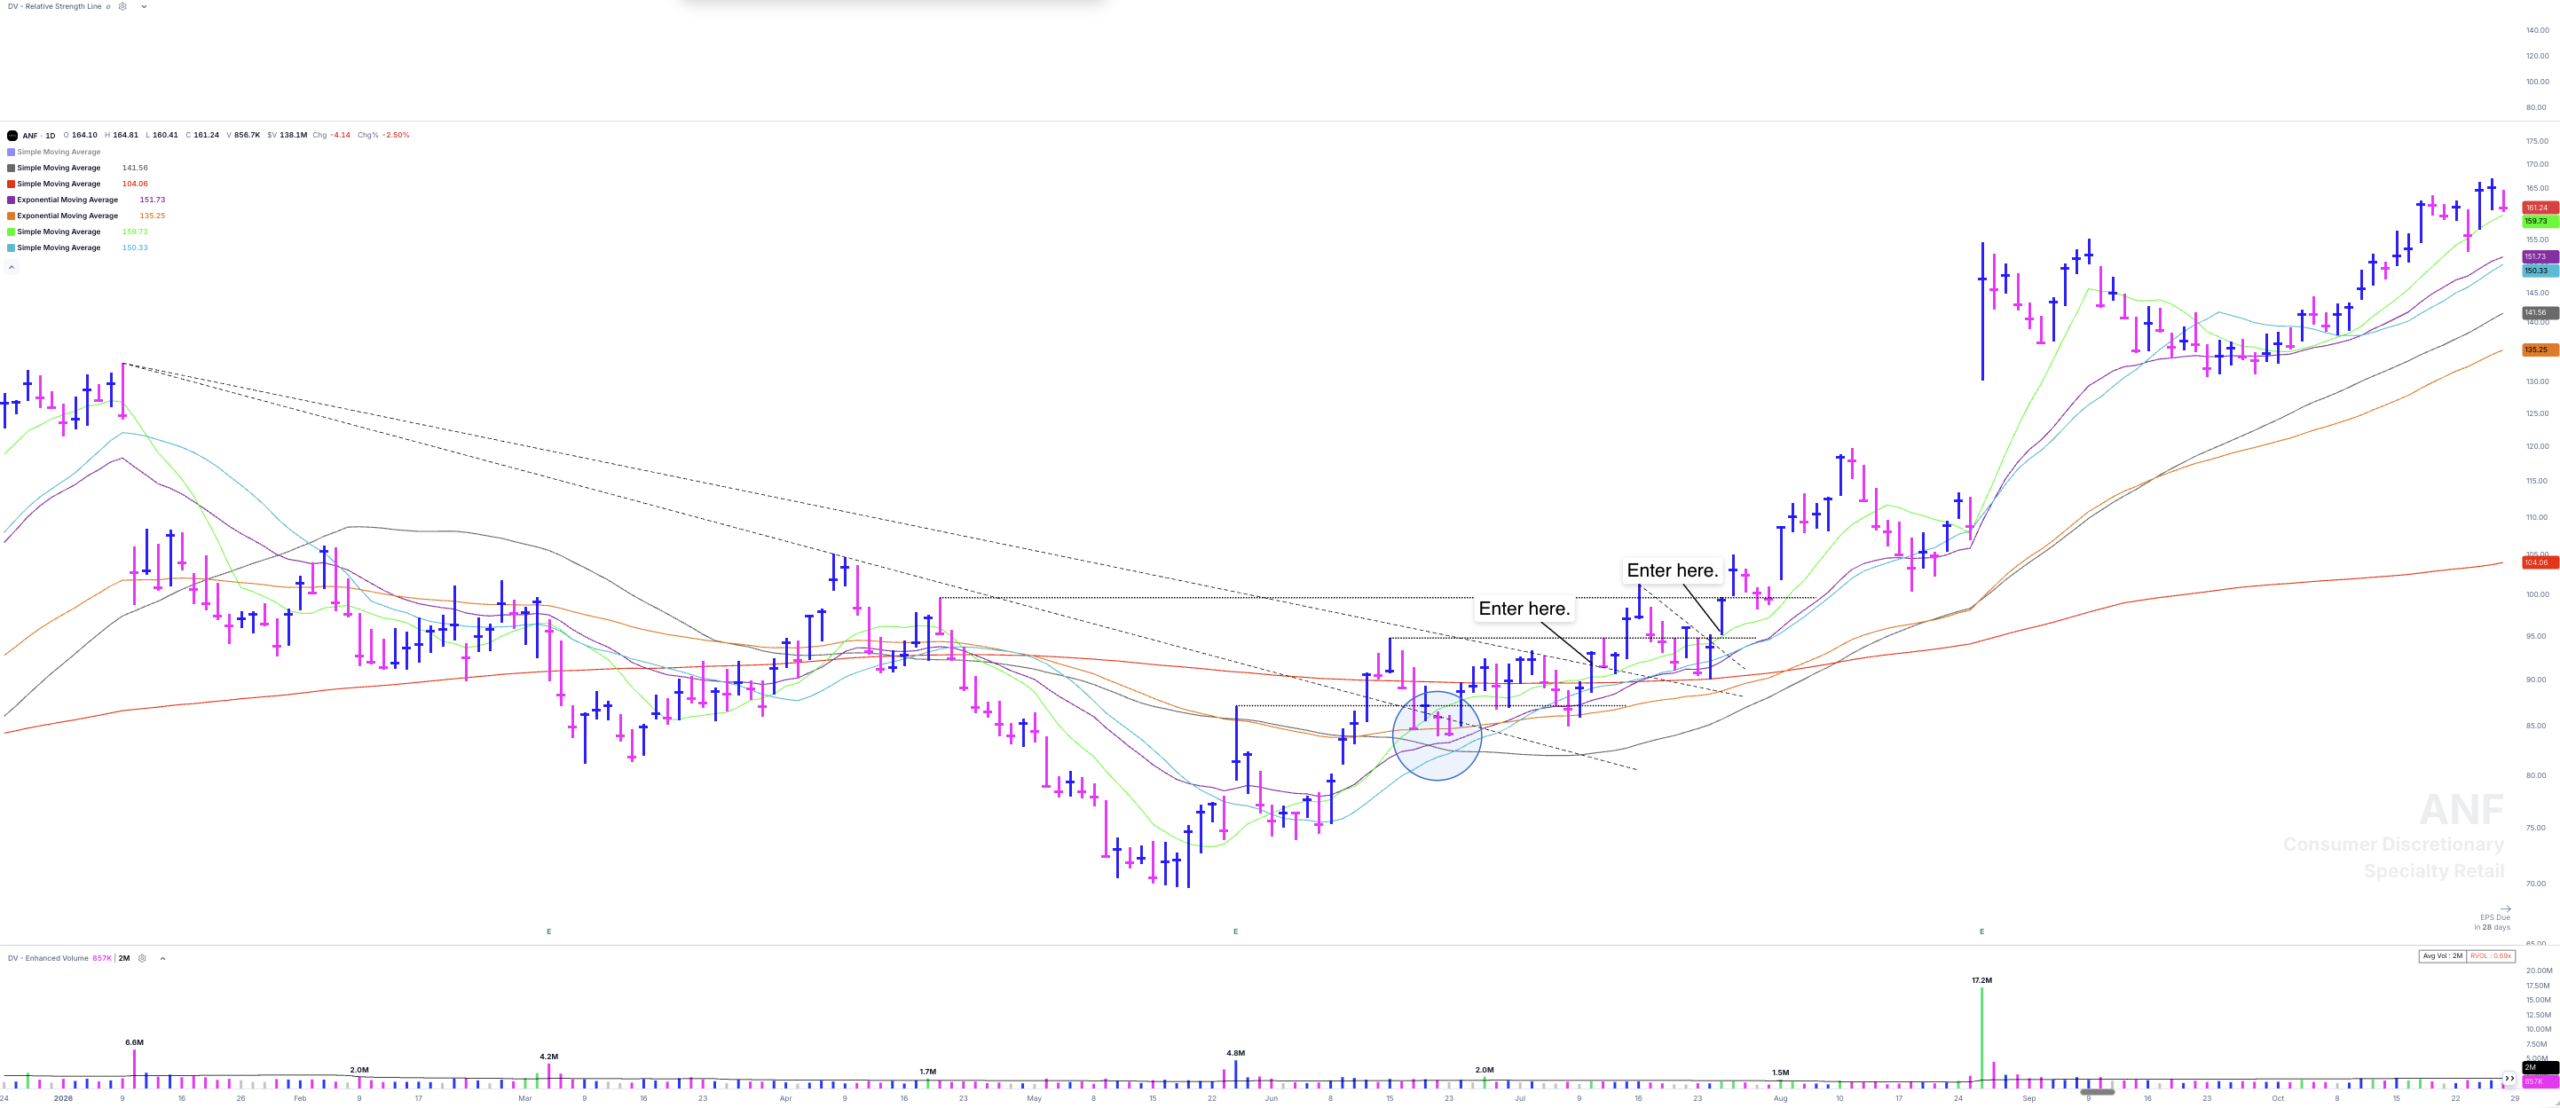
Well off the high, but tight in Stage 1, with the moving averages converging underneath. Then Stage 2.
This one was also well off its high. The difference was what it was doing. It stopped falling, built a tight base, and the 30-week moving average flattened. The launchpad gave an early entry as it moved into Stage 2.
Strength at the highs
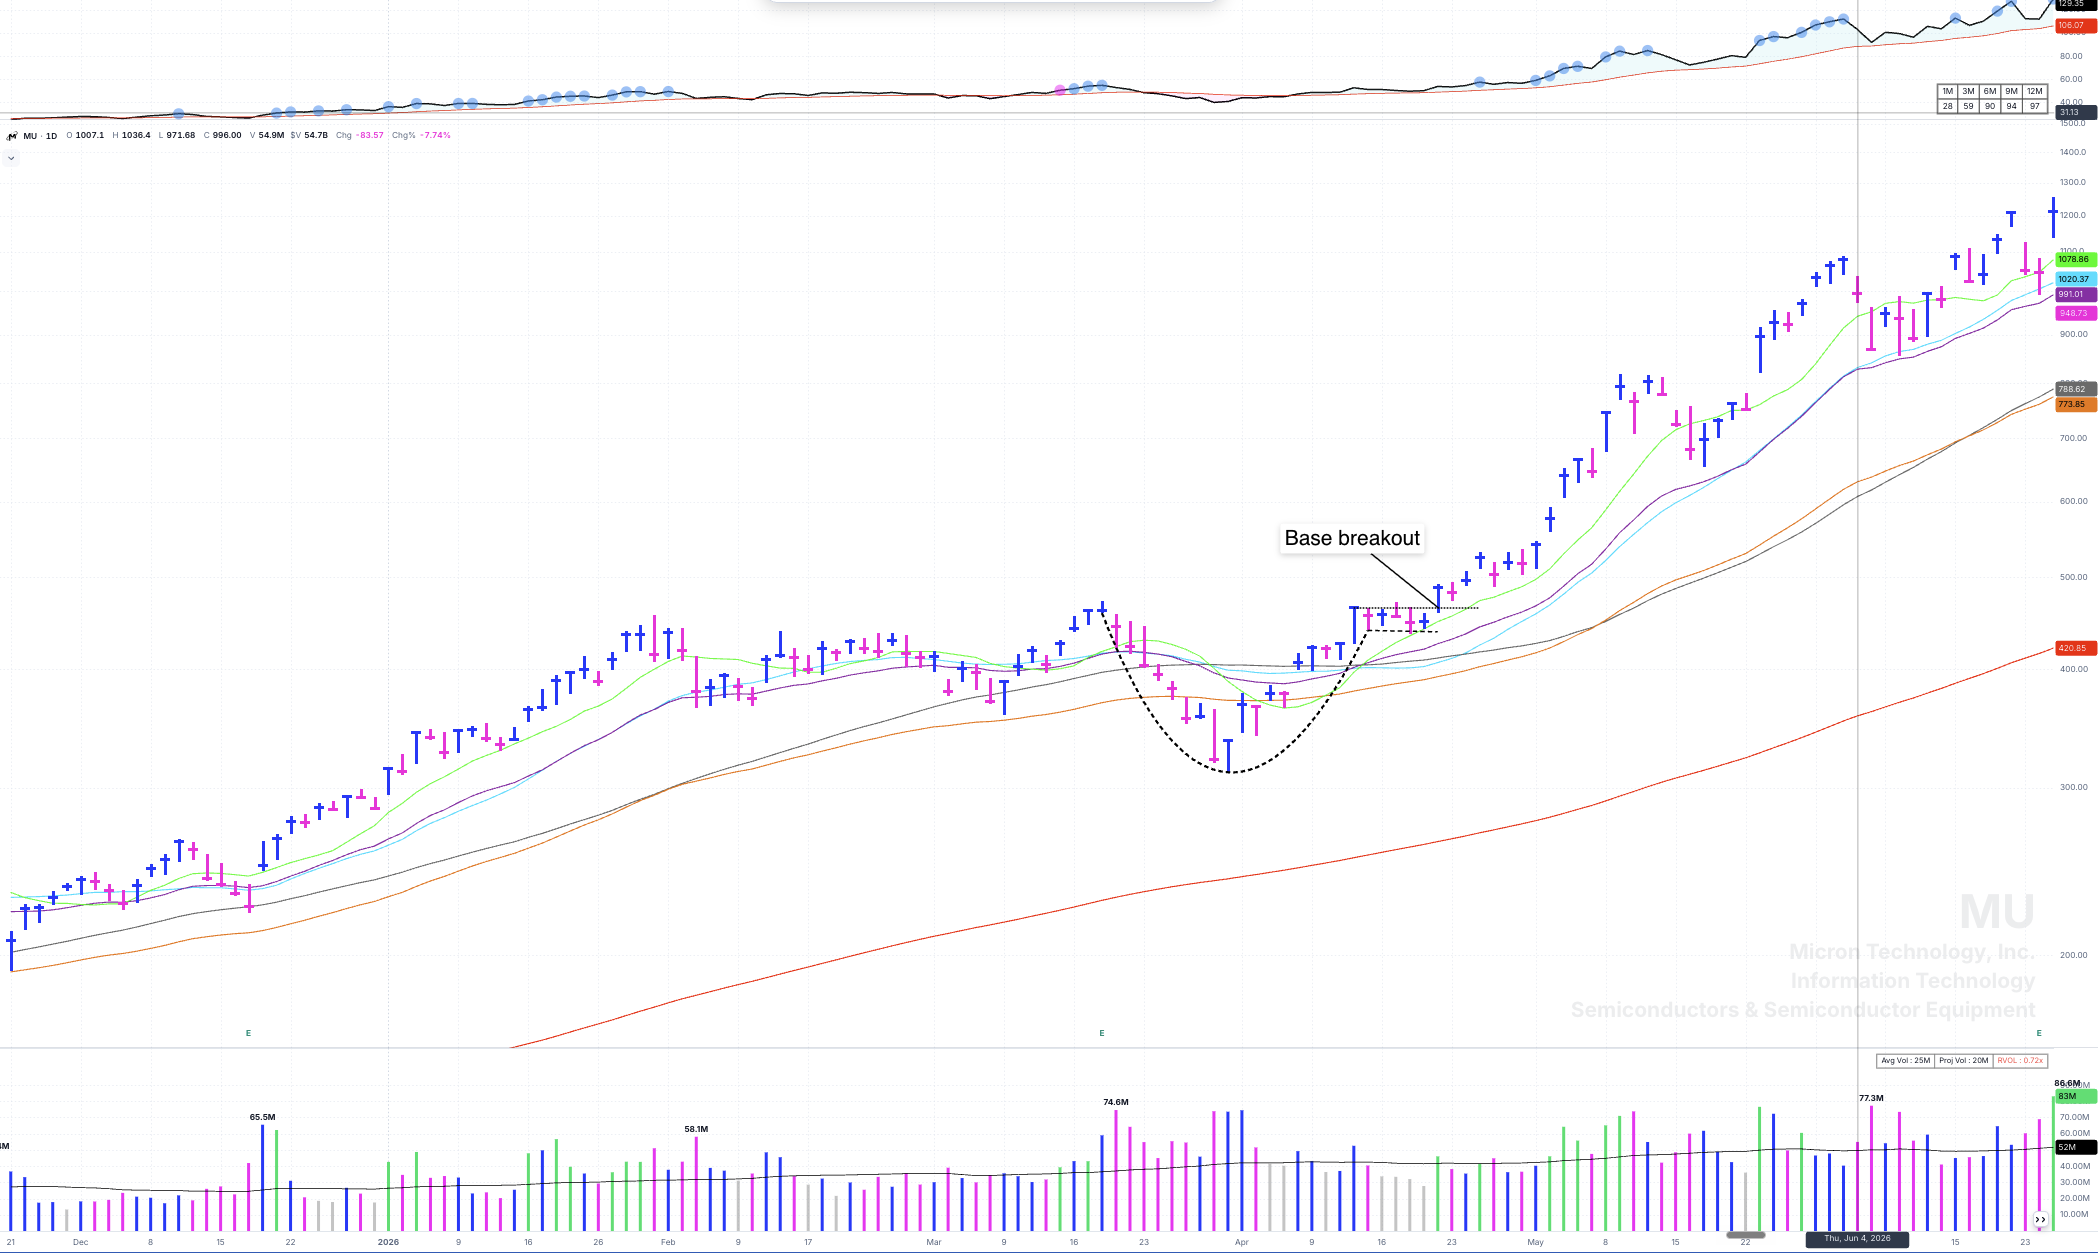
It looked too high at the pivot. It kept making new highs.
The classic paradox. A proper base near all-time highs, the RS line leading, volume on the breakout. Most people passed because it had already gone up. Every new high looked like the top, and every new high was followed by another one.
How to Practice Buying Strength This Week
- Pull up five well-known stocks that are down 40% or more from their highs. For each one, mark the 30-week moving average and decide its stage.
- Sort them: still falling in Stage 4, or basing in Stage 1? Most will be Stage 4. Those look cheap.
- From the Stage 1 group, look for anything tightening up, with moving averages converging underneath. That’s your launchpad watchlist.
- Separately, run a new-highs screen and find five names coming out of proper bases.
- Check both lists again in four weeks. Don’t trade them yet. Just watch which ones were acting strong and which were only cheap.
If buying a breakout at a high still feels uncomfortable, start smaller. It’s OK to take a half position and add only if it works. The habit you’re building is simple: ask what the stock is doing, not how far it has fallen.
The TML Report
Twice a week, I publish where I think we stand: the market overview, the four index charts, and a focus list with the lines already drawn on them. Breakouts near highs and launchpads off the highs both show up there, marked the way I’d trade them.