Launchpad Setup: How I Find Early Entries

Ross
Ross is a co-founder of TraderLion and Deepvue. He was mentored by William O’Neil, and co-authored The Model Book of Greatest Stock Market Winners at WON + Co.
Published: August 21, 2026


The launchpad setup is my go-to early entry technique. I refer to it as my favorite 'Stan SLIM' entry, because it's really a marriage of Stan Weinstein's stage analysis and Bill O'Neil's CANSLIM® methodology. There are parts of each that the other might disagree with, yet there is a ton of overlap, and for this one purpose the two blend extremely well. I've leaned on the combination for years.
The setup itself is simple to state: a stock's key moving averages converge to the upside in a tight bunch beneath price. That's it. When I see that happening on a sound name in a group that's turning, I know where support is, I know where my risk is, and I can get positioned before the obvious move — instead of chasing it.
I wrote recently about why I stopped buying breakouts the way I did in 1999. This post is the other half of that answer. If I'm entering earlier at consolidation pivots, the launchpad tells me the ground beneath the entry is solid.
Table of Contents
Ross Haber
Every new post, straight to your inbox
If this was useful, the next one will land in your inbox the day I write it.
Why the Launchpad Setup Matters
One launchpad setup on one chart is interesting. A dozen of them across a group is information. When I see multiple potential leaders in the same group forming launchpads just as the broader market is turning at the beginning of a new trend, that's typically a very bullish sign. It tells me that the rotation through the market leadership is healthy, especially when it's happening across several groups of traditional growth stocks in unison.
Recently I went through the Health Care Services group. Of the top ten relative-strength names in the group, most had solid launchpads. When an entire group turns like that — moving averages converging below healthy, constructive, preferably early-stage base structures — that's when I assess each stock's personality and look to put on size where I feel the risk and reward can be managed best. It's often a sign of quiet institutional accumulation before the move gets obvious.
The indexes do it too. QQQ and SPY both formed launchpads just as the market gapped up and started its new uptrend. And here's the useful part: nine times out of ten, by the time the index averages have converged, the true leaders have already converged and begun to expand. The index launchpad confirms the environment. The leaders' launchpads are where the money is.
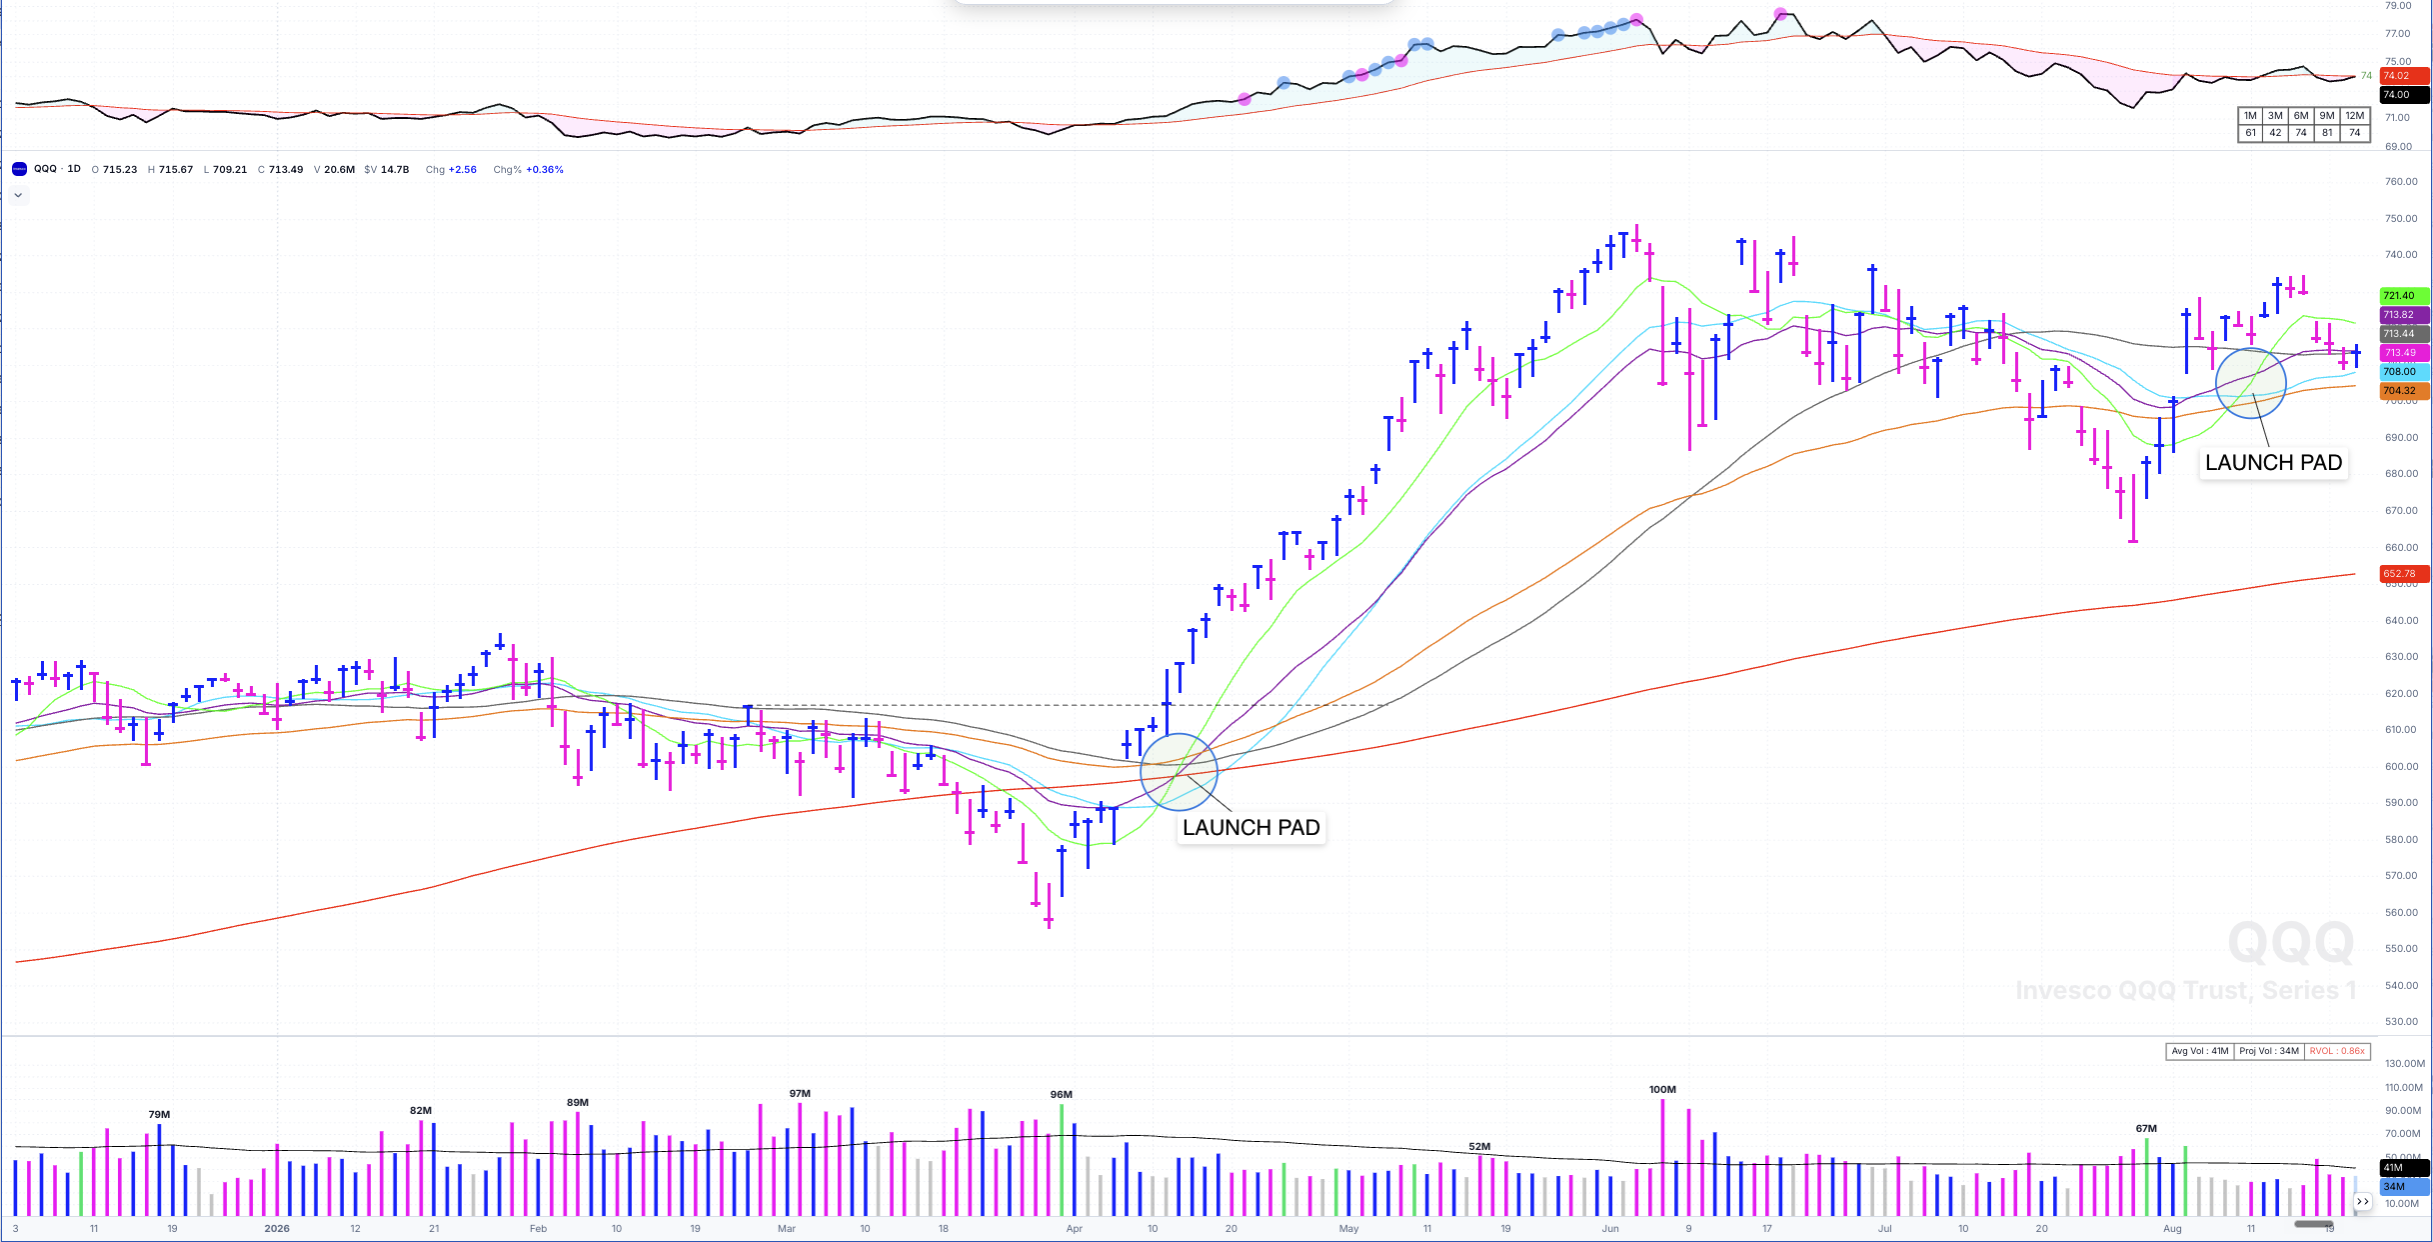
The classic version. Every average converges to the upside in a tight bunch beneath price — compare it to how wide they were a few months earlier — and then the explosion. No easy entry here, but by the time the index does this, the leaders have usually already done it.
What a Launchpad Setup Looks Like
I run six moving averages on my daily charts: four simples — the 10-day SMA, 21-day SMA, 50-day SMA, and 200-day SMA — plus the 23 EMA and 65 EMA. Six makes the convergence easier to spot, but I always suggest simplicity. The four simples are enough. A launchpad forms when those averages converge to the upside in a tight bunch beneath price.
Why does it work? Converging averages mean every timeframe of holder — the two-week money, the two-month money, the ten-month money — has arrived at roughly the same cost basis, stacked under the stock. When they begin to expand upward, those expanding averages act as major support and give me a logical place to manage risk from. Not an indicator someone sold me. The actual footprint of demand.
What I look for
Before a launchpad makes my list
- Tight relative to itself. The bunch should be visibly tighter than the averages were during the prior decline or base. Not wide and loose.
- Beneath price, turning up. Price above the bunch, averages curling higher. A pile of flat averages above price is a ceiling, not a launchpad.
- Early in the cycle. A launchpad forming on an early-stage base at the start of a new uptrend carries far more weight than one forming after the stock has already doubled.
- The right personality. Liquid names that trade in tight, orderly ranges and respect logical support — tops of prior bases, highs and lows of prior gaps, key averages. Look left: the chart tells you which averages this stock actually honors, and those are the ones I'll manage against going forward.
- Group confirmation. Other high relative strength names in the same group doing the same thing.
What it looks like when it fails
Wide, loose stocks with huge average daily ranges can form something that looks like a launchpad, but it's often a trap — there's no clean place to manage risk, so even when they work, you can't hold them properly. I pass on those and stick to the orderly names.
A launchpad forming late in a stock's cycle, or in a group under pressure, carries far less weight than the same moving average convergence in an early-stage base — MRVL is working on exactly that kind right now, a later-stage launch pad in the semiconductor group which is under pressure, so it's one to be careful of rather than one to buy. Same ingredients on the surface, different trade. Either way, my invalidation is written before I enter: if my sell stop price is triggered, I'm out. Everything about position risk starts there — risk management first, entry second.
And some launchpads simply never offer an entry. The QQQ chart above gapped away from its pad without a pullback — nowhere to manage risk from. That's fine. The setup told me about the environment. It doesn't owe me a trade.
Three Launchpads From This Year
NTRA — respect for the 10-day and the 23 EMA
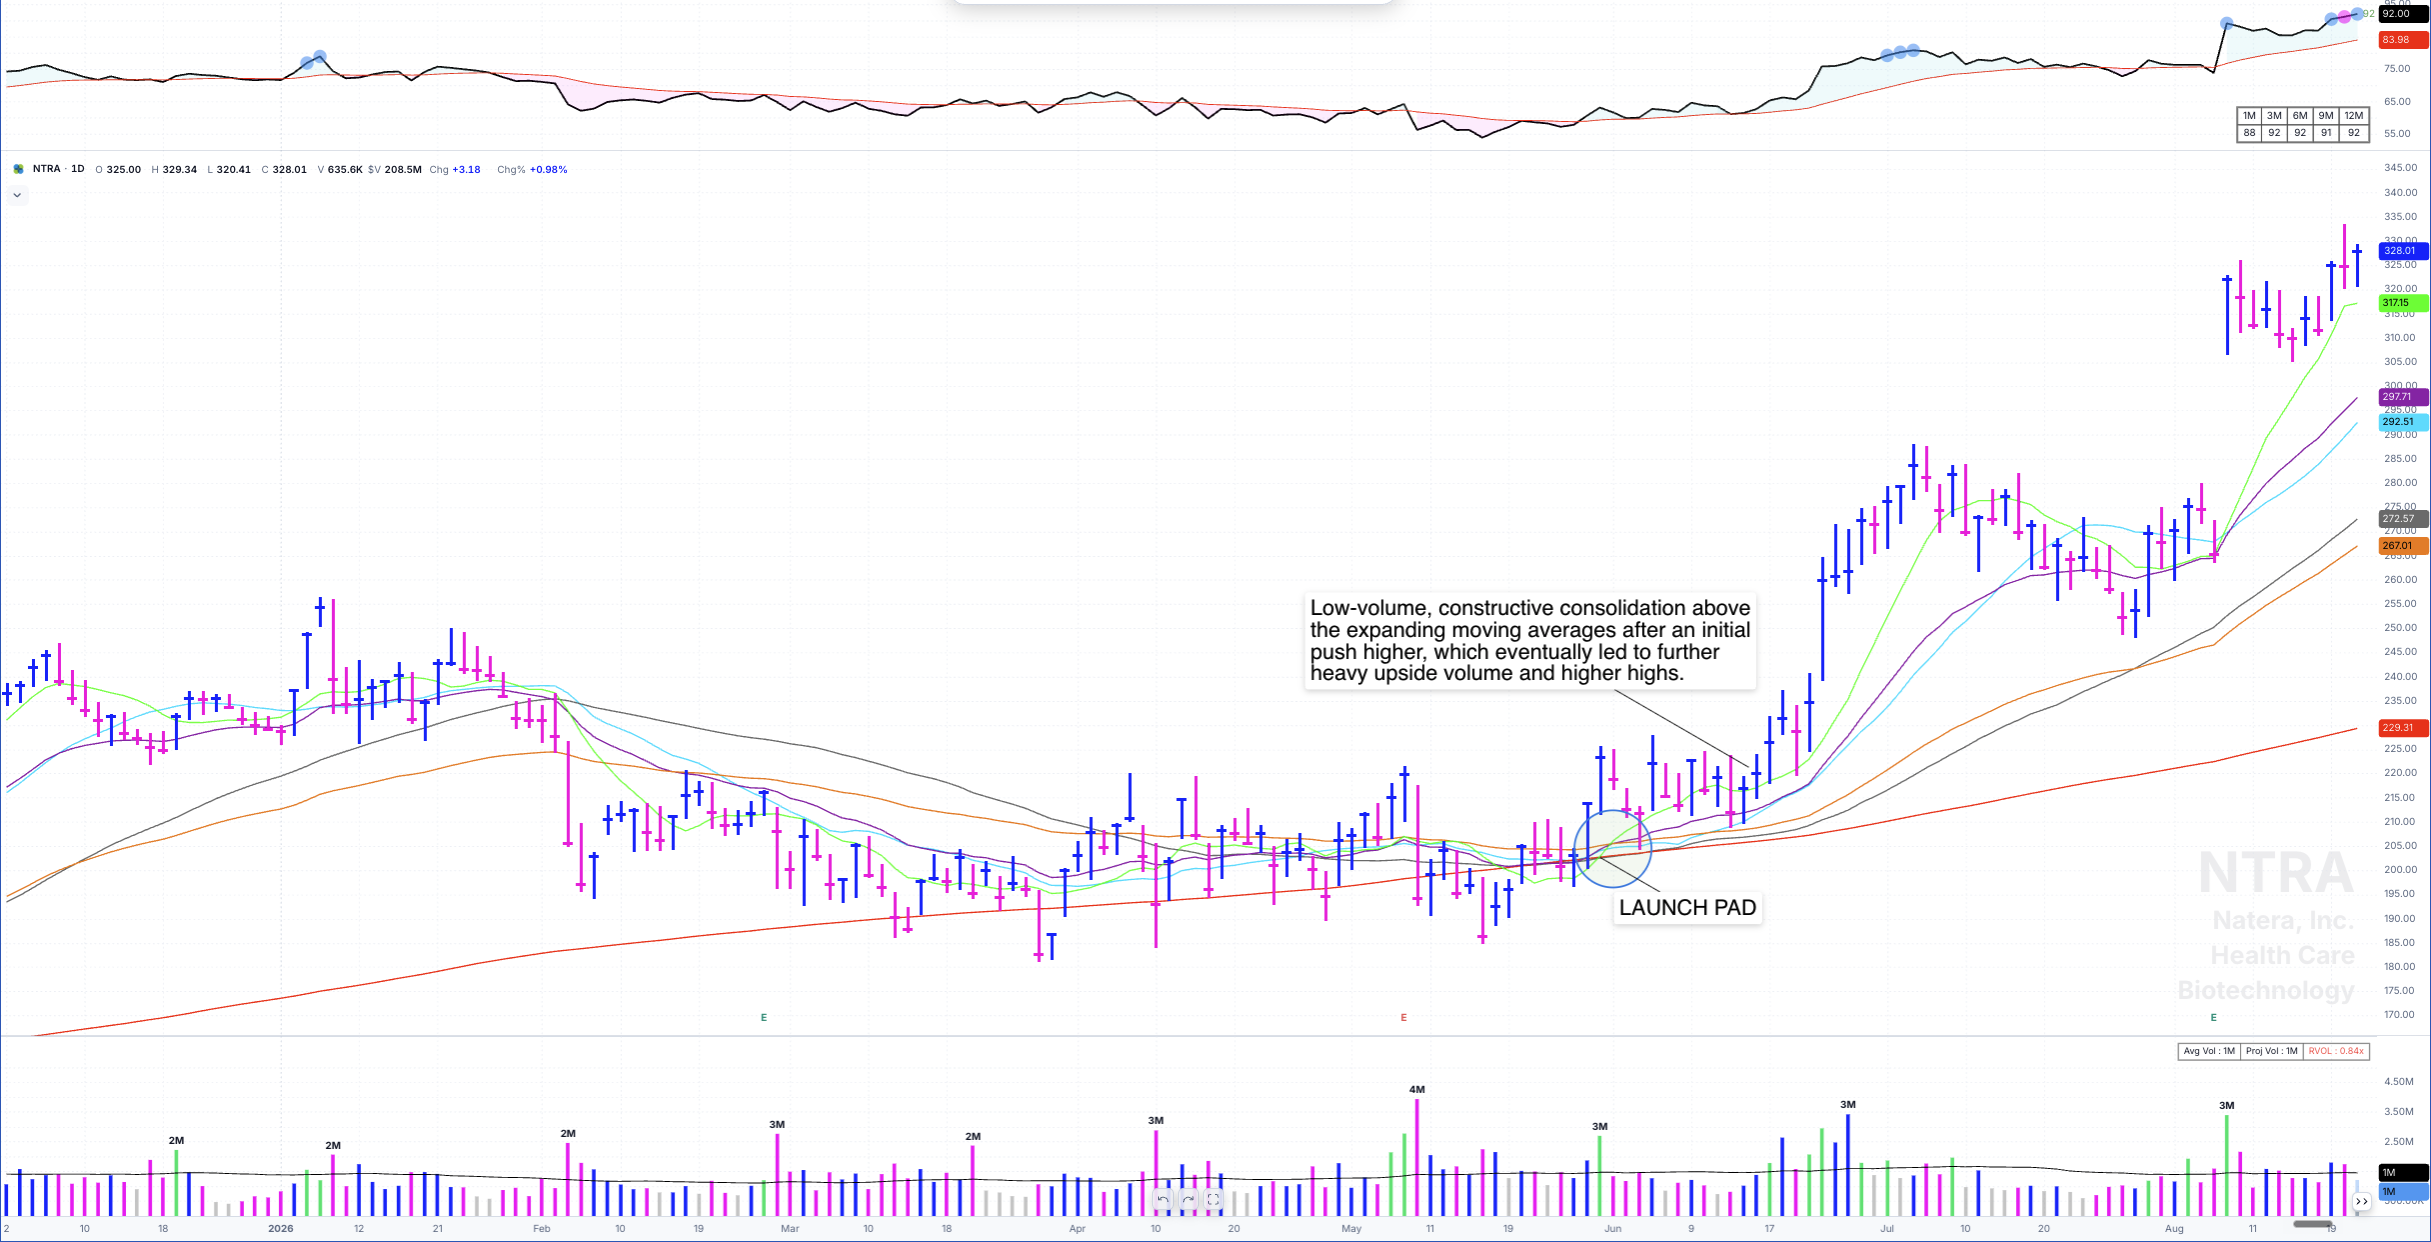
All the key averages converging tight beneath price at the end of May.
The launchpad on NTRA formed at the end of May 2026: all the key moving averages converged to the upside, nice and tight, just beneath price, with volume coming into the market as it happened. That convergence is the whole example — everything after it is just the launchpad doing its job. The stock pulled back into the bunch, shook below, and closed back above. From that point it showed clear respect for its 10-day SMA and 23 EMA — look left, and you'll see it honored the same two lines before. That's the stock's personality, and it hands you the risk: at the widest point, the 10-day to the 23 EMA ran roughly $217 down to $210, about a 3% swing. If I can keep my risk between 2% and 3% against an average the stock demonstrably respects, that's exactly what I want.
GH — the entry I consider ideal
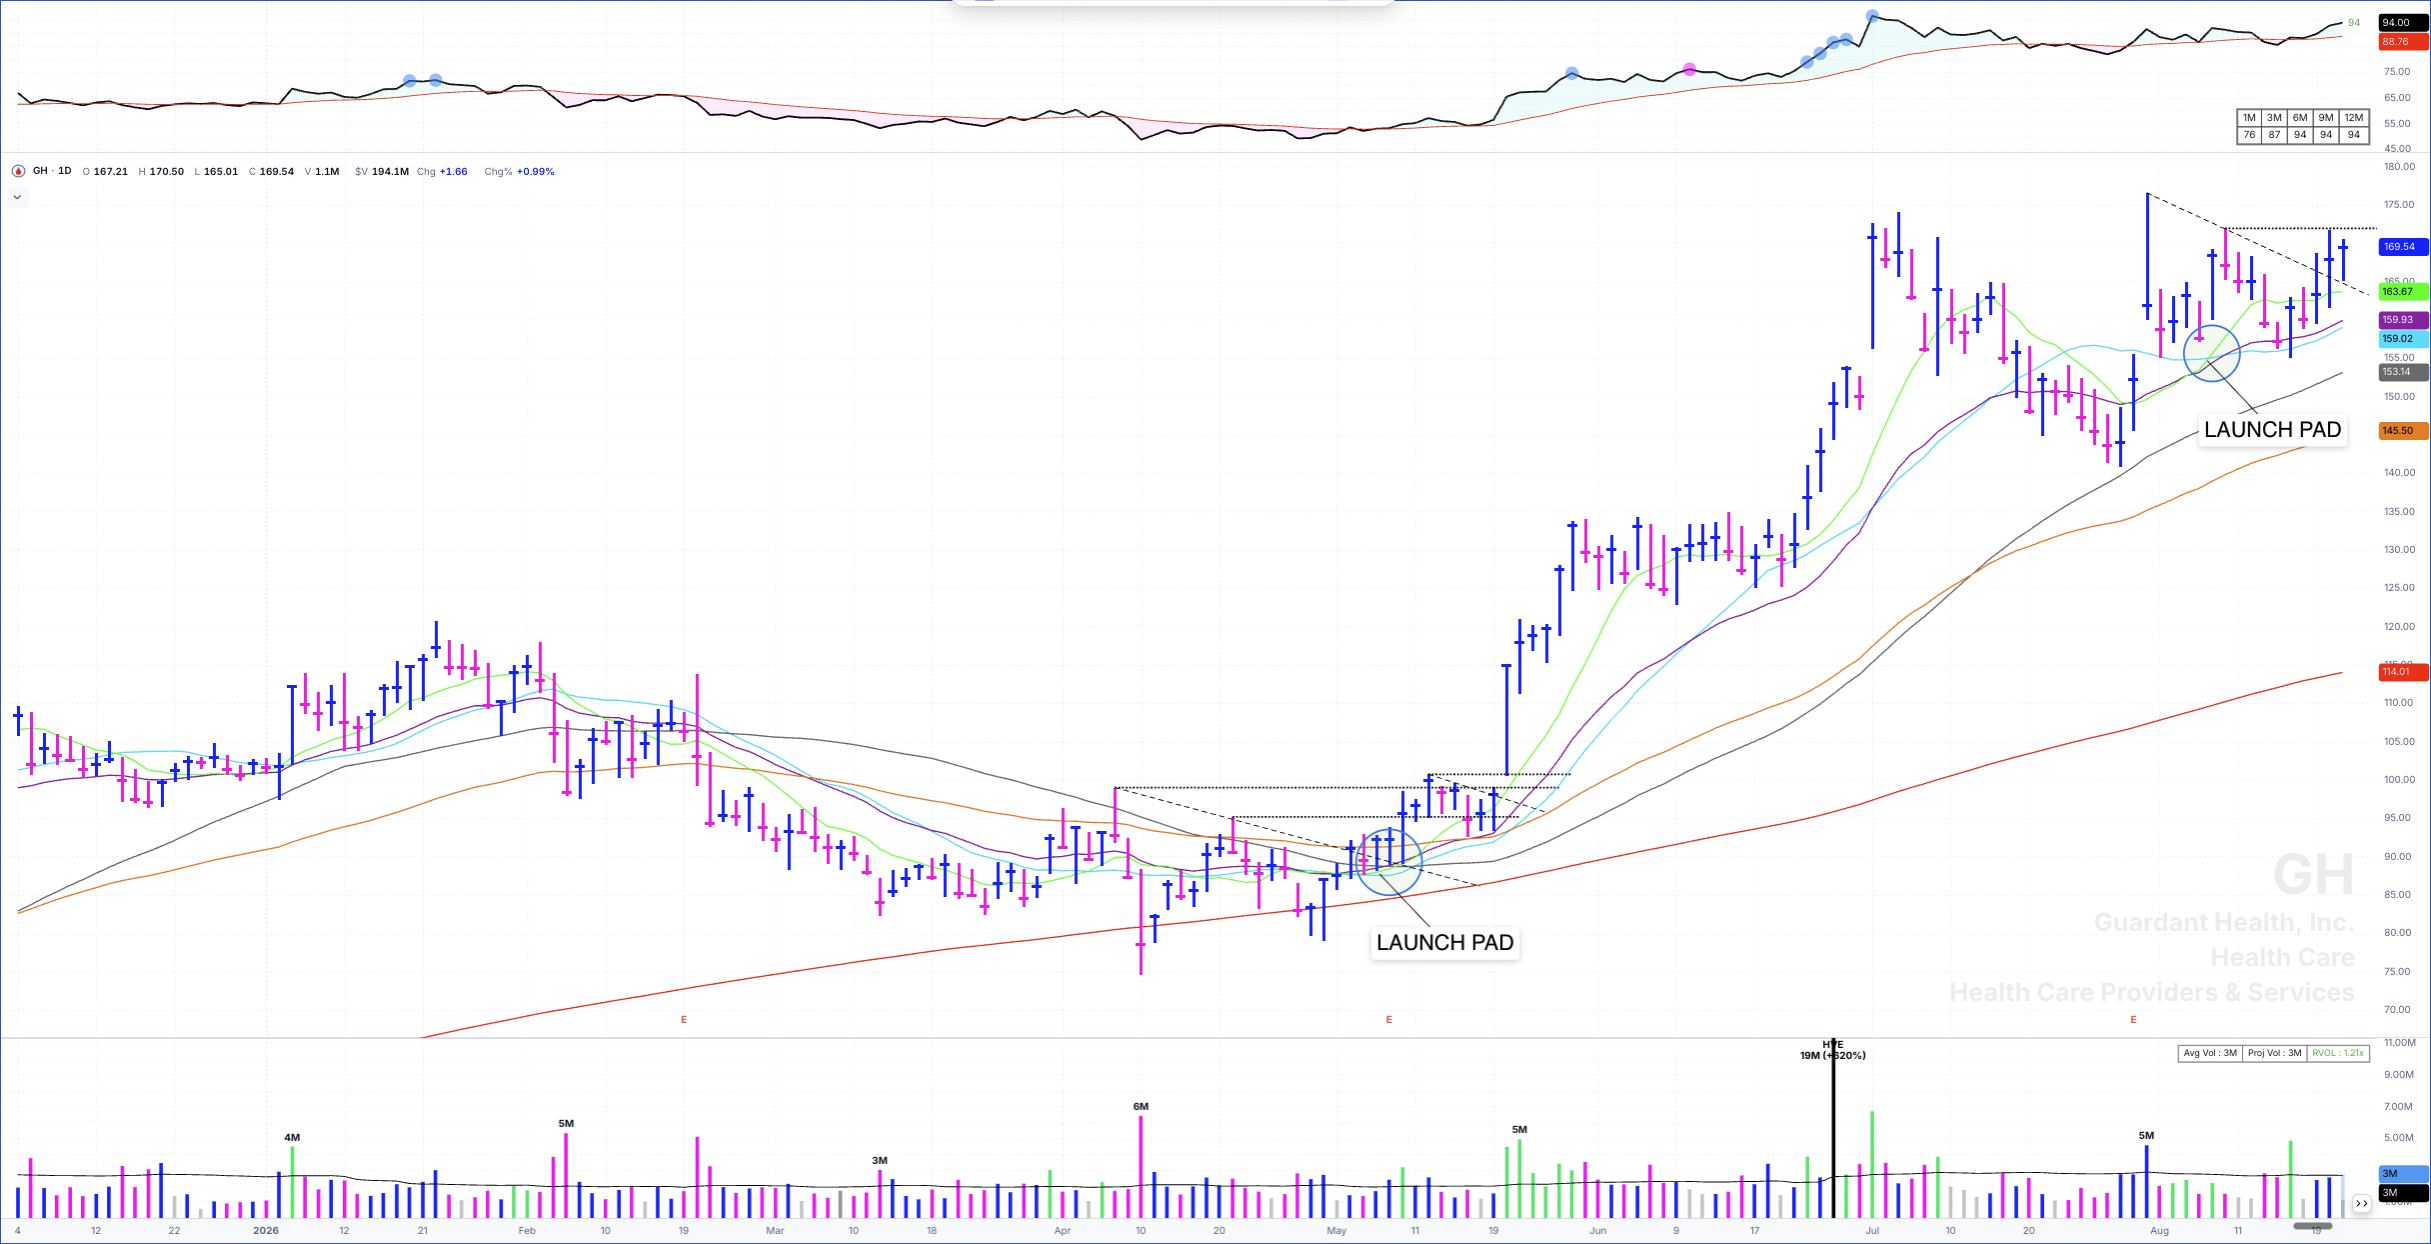
Pullback to the 23 EMA it favors, then through the high of the post-earnings consolidation pivot.
Around May 9th through 11th of 2026, GH got its earnings-related push and then pulled back to its 23 EMA — which, look left, is the average this stock tends to favor. All the moving averages were crossing, price support sat everywhere beneath, so you could start buying in anticipation of the move. Then it gapped higher, and instead of panicking over whether to chase strength, you would already be positioned. That's what getting started a little early buys you: peace of mind.
Even without the anticipation buy, the launchpad handed over what I consider the ideal risk-reward spot: the move through the high of the post-earnings consolidation pivot, sell stop at the low of that pivot. It stayed viable on the breakout and after. On the monthly, it's now working on a Dr. Wish Green Line breakout — the prior all-time high dates back to February 2021 — so for all intents and purposes, this one could just be getting going.
OSCR — shakeouts still happen
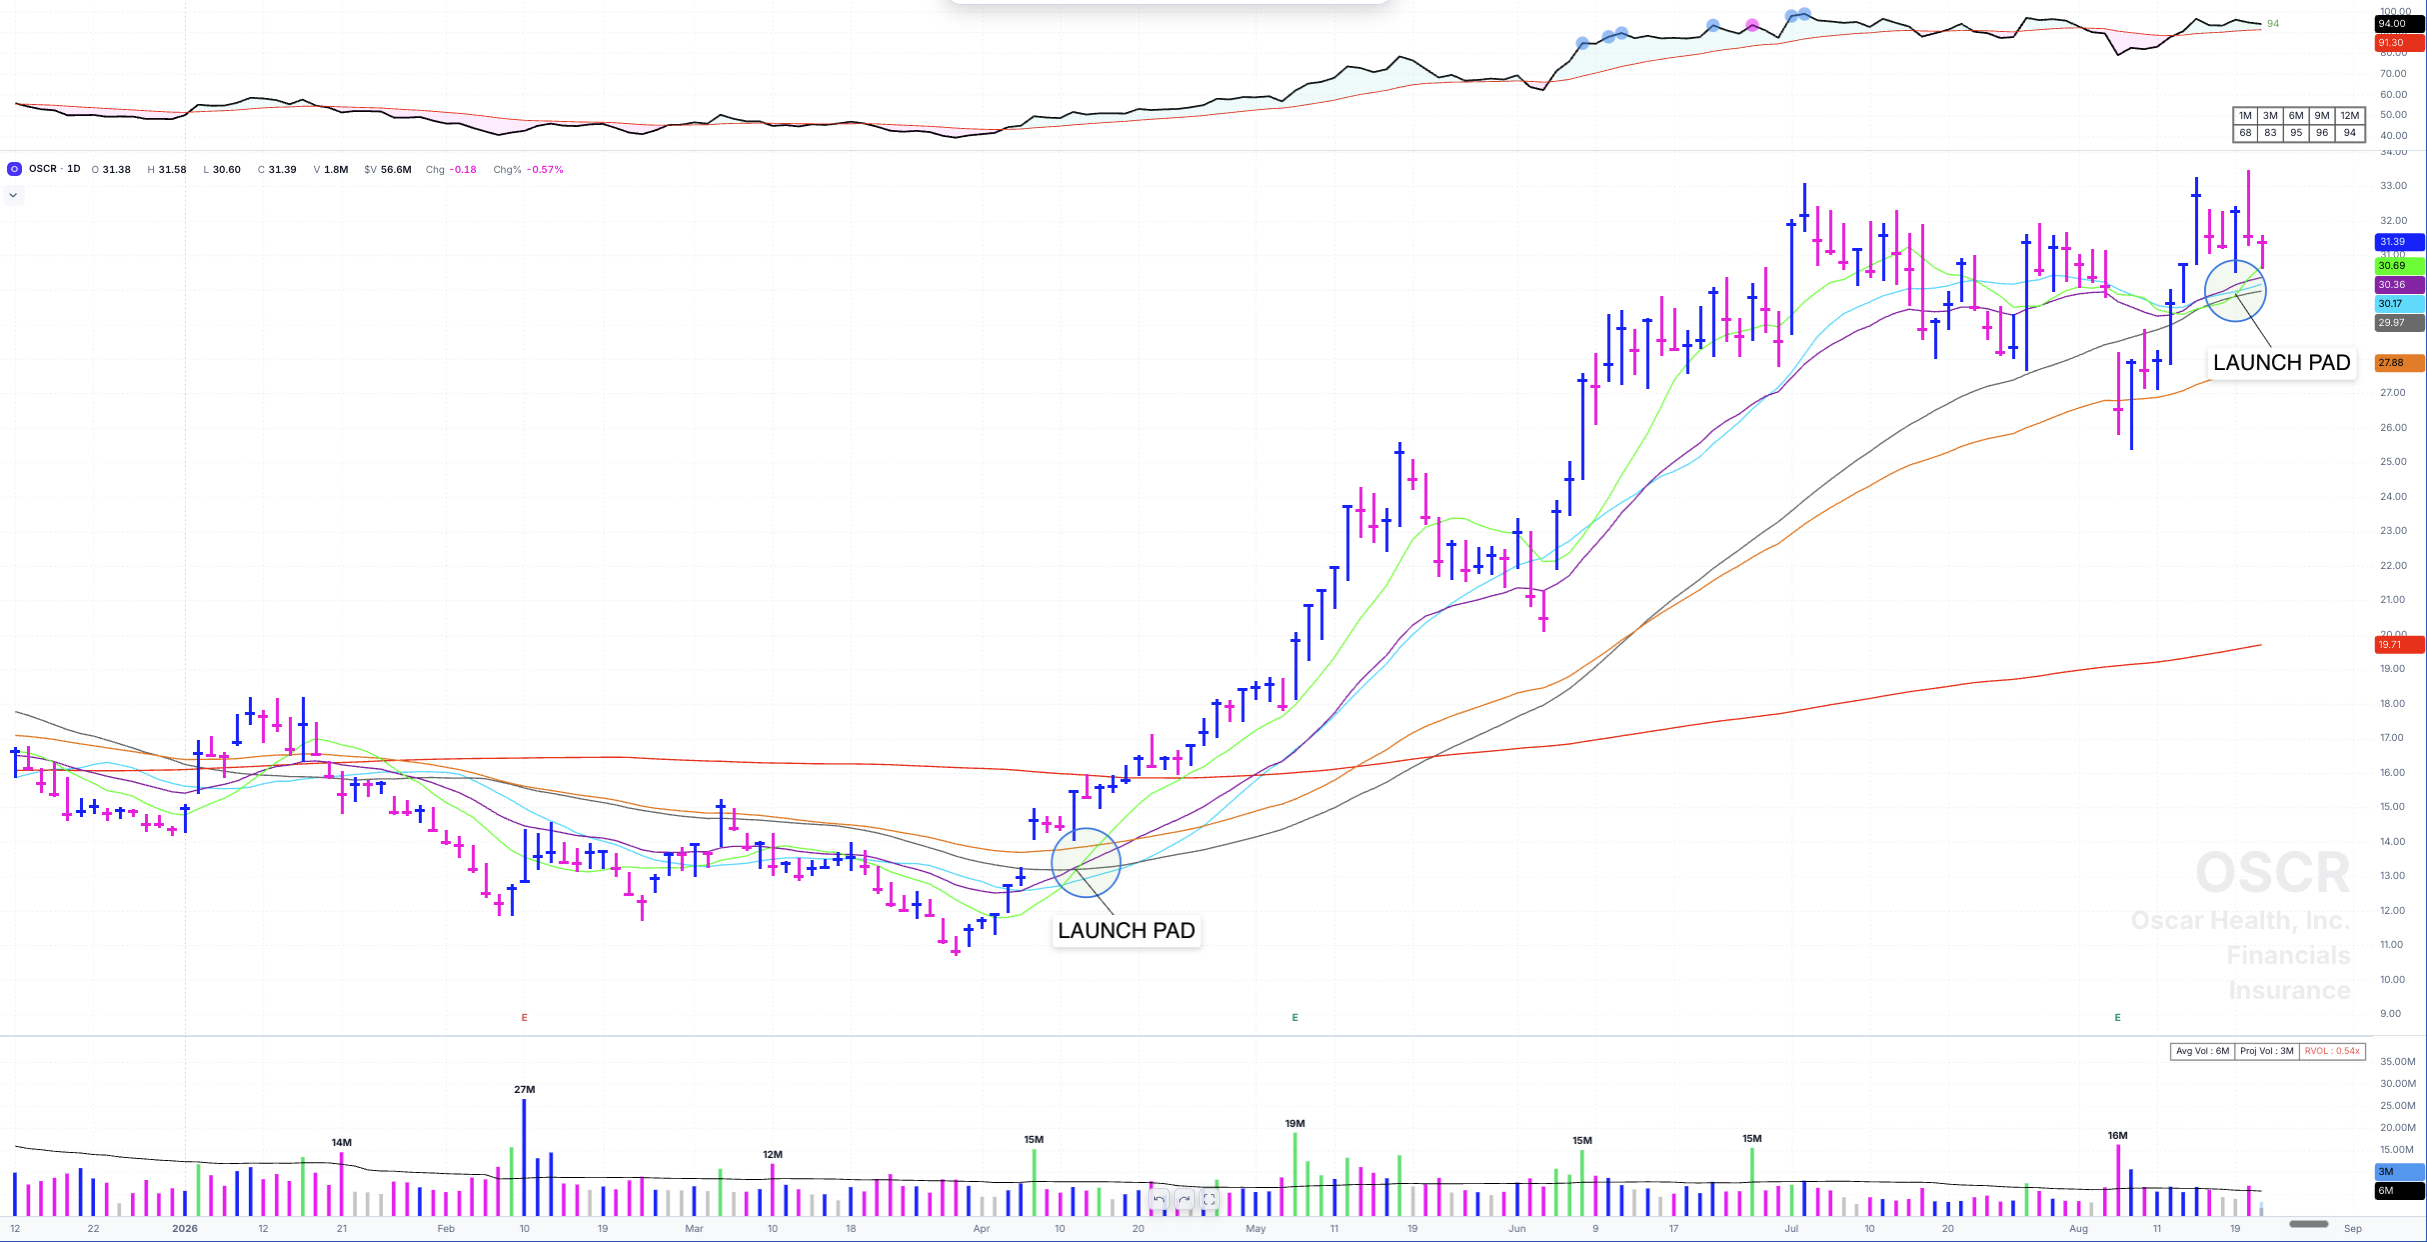
The two closes in a row below the 21-day SMA/23-day EMA after the first launch pad would have stopped me out — right before it exploded higher. The gap on volume is where I buy it back.
Spring 2026, OSCR's averages all crossed below a 200-day SMA that wasn't quite rising yet. As the 200-day started to turn and the stock tightened up, it signaled strength — a tight advance respecting its 10-day SMA — and the first pivot clear of the 200-day. I like to set my stop based on a moving average when I can, and that would have worked well here.
Then came the shakeout below the 21-day SMA and 23-day EMA. That one would have stopped me out, for sure — right before the stock exploded higher again. I'm not going to dress that up: my rule fired, I'd have been out. But when there's a big gap with that sort of volume, I'll tend to buy the stock right back, as long as I can find a tight, logical self-stop. Usually I'm pretty good about it. The stop isn't there to be right every time; it's there so that the one time the shakeout keeps going, I still have an account.
What to Do This Week
- Put the four simple moving averages on your daily charts — 10-day SMA, 21-day SMA, 50-day SMA, 200-day SMA. Add the 23 EMA and 65 EMA if your platform allows; six makes launchpads easier to spot, four is enough.
- Pull the top ten relative strength names in the two or three strongest industry groups. The Deepvue screener gets this done in a few minutes.
- Flag every name where the averages are converging in a tight bunch beneath price. Count how many per group. Four or more in one group's top ten is the signal worth acting on.
- For each flagged name, look left. Which averages did it respect on its last advance? Write those down — they're your management lines for this trade, not whichever average looks best today.
- Write the stop before the entry: the low of the consolidation pivot, or a close below the average the stock respects. If the distance is more than 3%, the entry isn't there yet. Wait, or pass.
See the Launchpads I'm Watching Right Now
Twice a week in The TML Report, I walk through the market's posture and a Focus List of 8–12 True Market Leaders — including the launchpad setups forming in real time, with the levels I'm managing against marked on every chart.
Read The TML ReportFrequently Asked Questions
CAN SLIM® is a registered trademark of O’Neil Capital Management, Inc. (U.S. Reg. No. 3,081,940). TraderLion is not affiliated with, sponsored by, endorsed by, or licensed by O’Neil Capital Management, Inc., Investor’s Business Daily, MarketSurge, or their affiliates. Any reference to CAN SLIM® is for descriptive purposes only.