Stock Market Model Book: How to Study Past Winners

Ross
Ross is a co-founder of TraderLion and Deepvue. He was mentored by William O’Neil, and co-authored The Model Book of Greatest Stock Market Winners at WON + Co.
Published: September 30, 2026


In 1994, I was a retail broker with a quote screen, a phone, and no real idea what a big winner looked like before it ran. I had opinions. I did not have evidence. What fixed that was a stock market model book — a bound set of charts of a cycle's biggest winners, marked up by hand and studied after the move was over, when there was nothing left to be right or wrong about. I have built one every year since, and I still print it.
When I got to William O'Neil + Co., the model book was not a side project. It was the homework. Bill's whole argument was that the patterns repeat because the behavior behind them repeats — institutions still have to buy in size, and they still cannot do it quietly. If that is true, then the best teacher available to you is a stock that has already finished running.
I like to see them printed on a page I can touch, which forces me to look through them in hard copy. That sounds like a preference. It is closer to a control. Below is what actually goes on a page, why the paper matters more than it should, and the one thing that turns a model book into a scrapbook.
Ross Haber
Every new post, straight to your inbox
If this was useful, the next one will land in your inbox the day I write it.
Why a Stock Market Model Book Matters
If the only market you have studied is the one you traded in, you have a sample size of one. That is the problem a stock market model book solves, and it is not a small one. A trader who started in 2020 learned that pullbacks get bought and that owning the most aggressive name works. A trader who started in 2007 learned the opposite. Both of them are convinced they learned the market. They learned a regime.
The fix is to study cycles you did not trade. A model book puts the biggest leaders of every year side by side, marked the same way, so the patterns that repeat stand out from the ones that belonged to a single market.
The part most people skip: marking the sell. Almost everyone circles the breakout. Very few go back and mark where the stock should have been sold, and that half of the page is worth as much as the first.
There is also a reason to do this that has nothing to do with pattern recognition. Going through a marked-up chart slowly, on paper, with no position on, and without money on the line, is the best way to dig in, study a chart, and make observations from a neutral standpoint. Otherwise, observations may be contaminated. You are either in and hoping, or out and annoyed. Risk management gets easier when you have already seen, in cold blood, what the failure looks like — and how fast it happens. Lose 7%, and you need 7.5% to get back. Lose 30%, and you need 43%. A model book is where that stops being arithmetic and starts being a picture.
What I Put on the Page
A page is one stock, one advance, start to finish. Not a screenshot of a pretty chart — a reconstruction of the whole decision, including the parts that were not obvious at the time.
What I look for on a page
- The daily chart of the pivot area, with the key moving averages, and all relevant price levels and trendlines drawn, because that is where the entry and the first test actually happen.
- Volume underneath both. Big blue on the advances, small red on the rest. Quiet accumulation shows up here before it shows up in price.
- The RS line, and a mark where it made a new high. If it made that high before price did, I circle it. That is the tell I trust most.
- The fundamentals as they stood then — the earnings and sales numbers that were printed before the move, not the ones we know now. Fundamental context read with hindsight teaches you nothing.
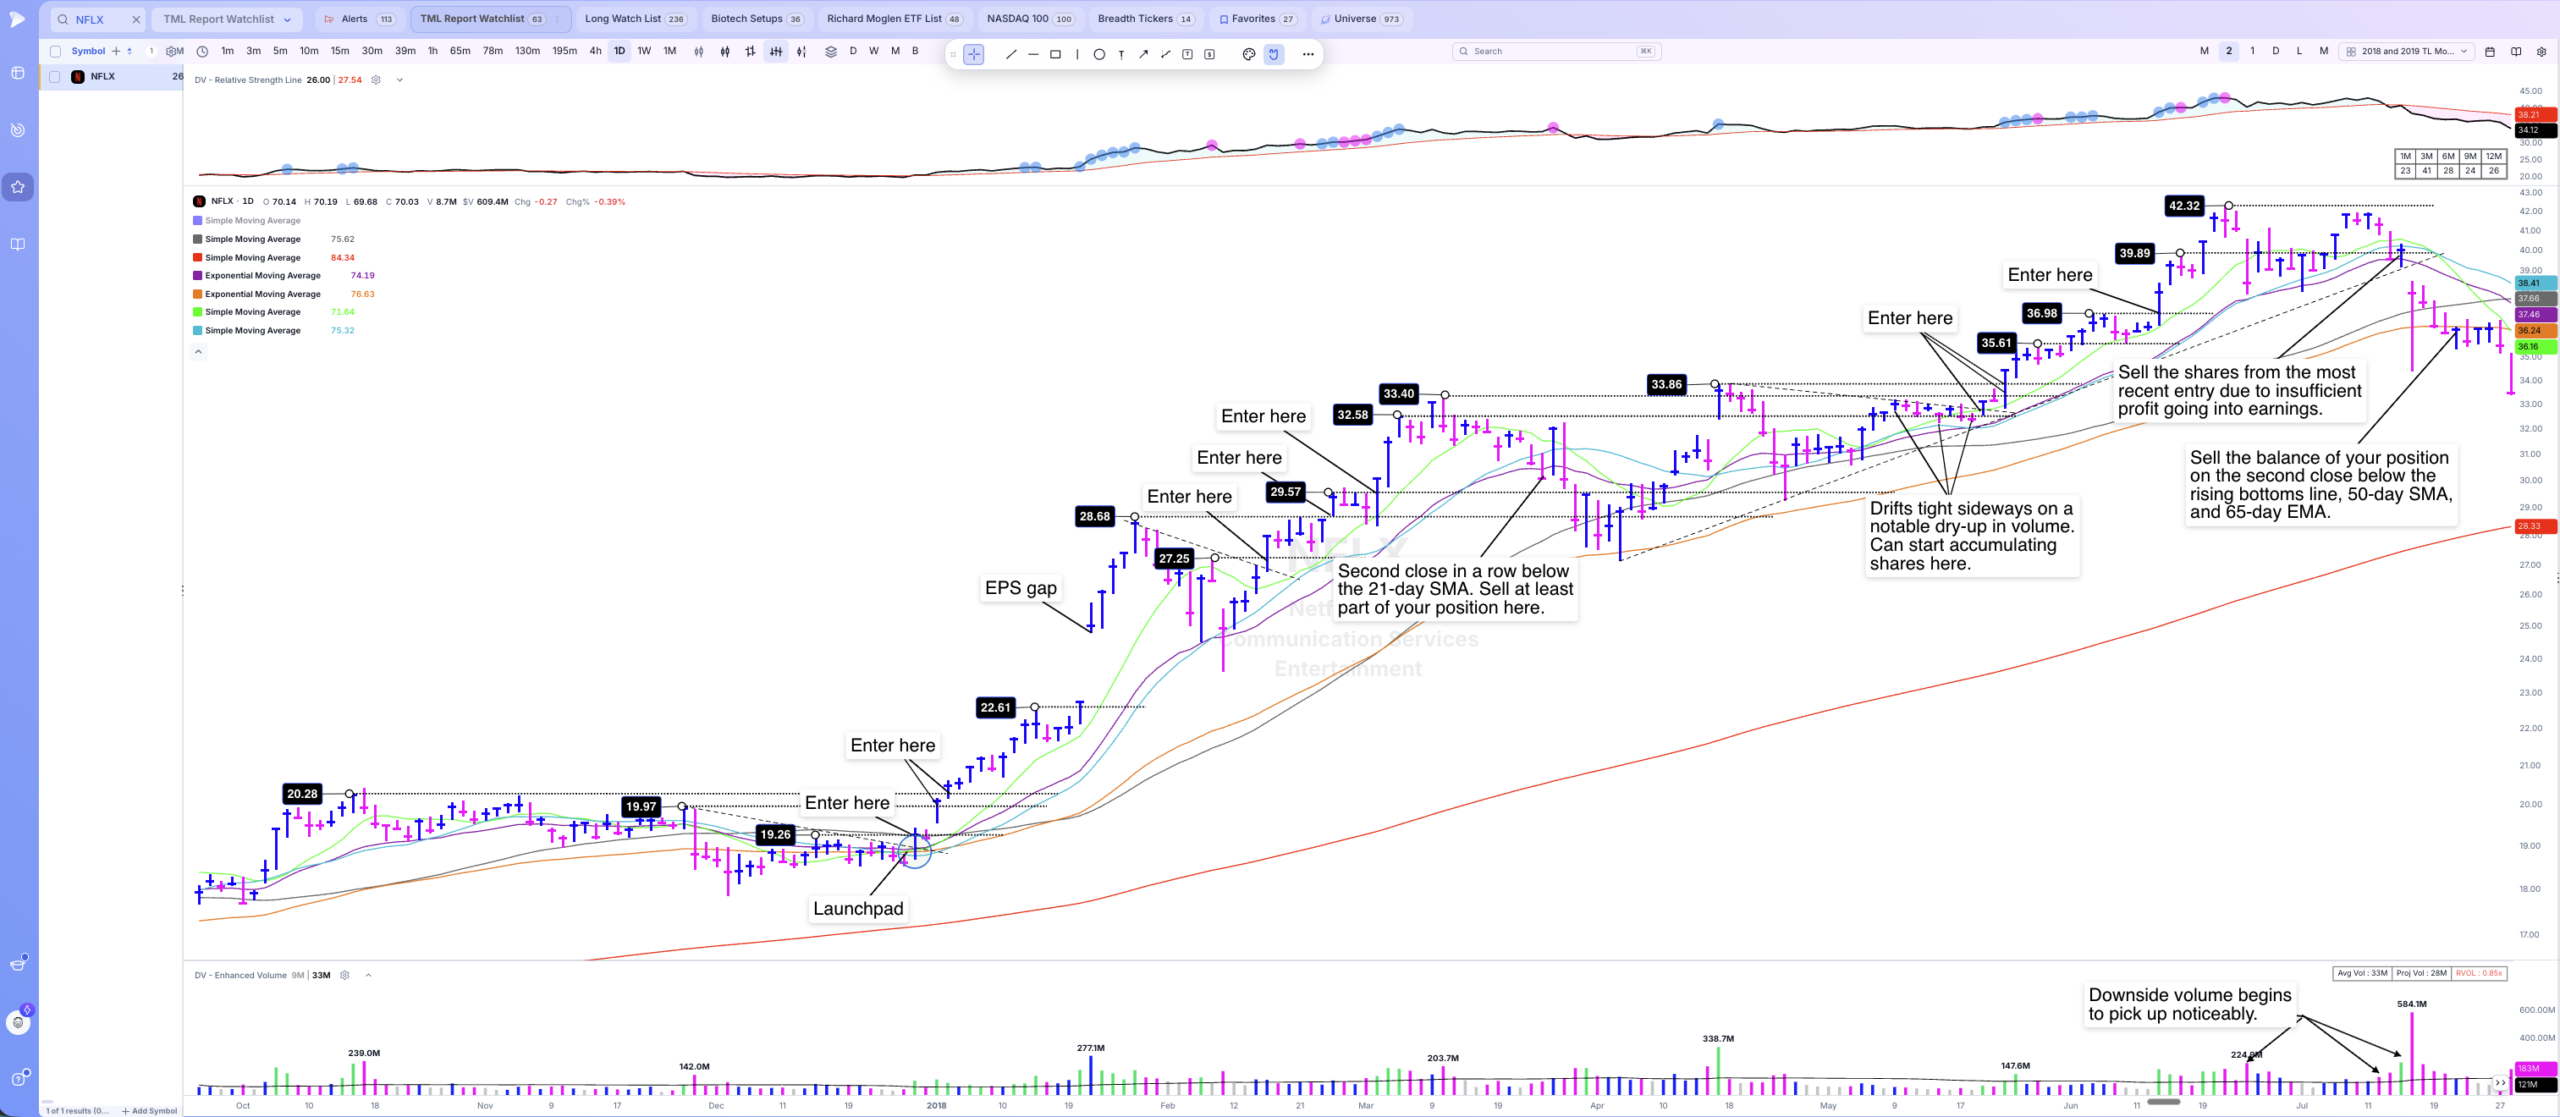
Then the annotations, which are the actual product. Horizontal lines across prior highs and the consolidation pivot. Diagonals down the declining tops. A circle where the moving averages pinched together underneath price — the launchpad. A mark at the shakeout, if there was one, because there usually was and nobody remembers it afterward.
Why I Print It Instead of Scrolling It
Because a screen lets you skip and paper does not.
That is most of the answer. When the book is a file on my computer, I go to the four names I already find interesting, and I am done in nine minutes. When it is bound and sitting on the desk, I turn every page, including the twenty I would have scrolled past, and roughly one in five of those has something on it I did not expect. The friction is the feature. I am not trying to be efficient here — efficiency is what I want from a screener. I want the opposite from the book.
Print it at the size you will actually read. I do not mean this as a design note. A chart printed too small hides the volume bars, and the volume bars are usually where the story is.
Three Things Every Page Records
A model book page is about the stock, not about anyone who traded it. I go through the biggest leaders of the cycle and mark two things: where it should have been bought and where it should have been sold. Then I write down how it behaved in between, because that is what I carry forward.
Where it should have been bought
The correct entry, marked by the rules.
This is the first mark on every page: all relevant price levels and trend lines, followed by all of the valid entry areas. The pivot, the launchpad, the shakeout that set it up, and the days the stock became buyable by the rules. I also write down what was visible the week before, usually a volatility contraction, a volume dry-up, and an RS line already at a new high. Knowing where the entry actually sits on a finished chart is what makes it recognizable on a live one.
Where it should have been sold
Mark the exit the same way you mark the entry: by the rule, in ink.
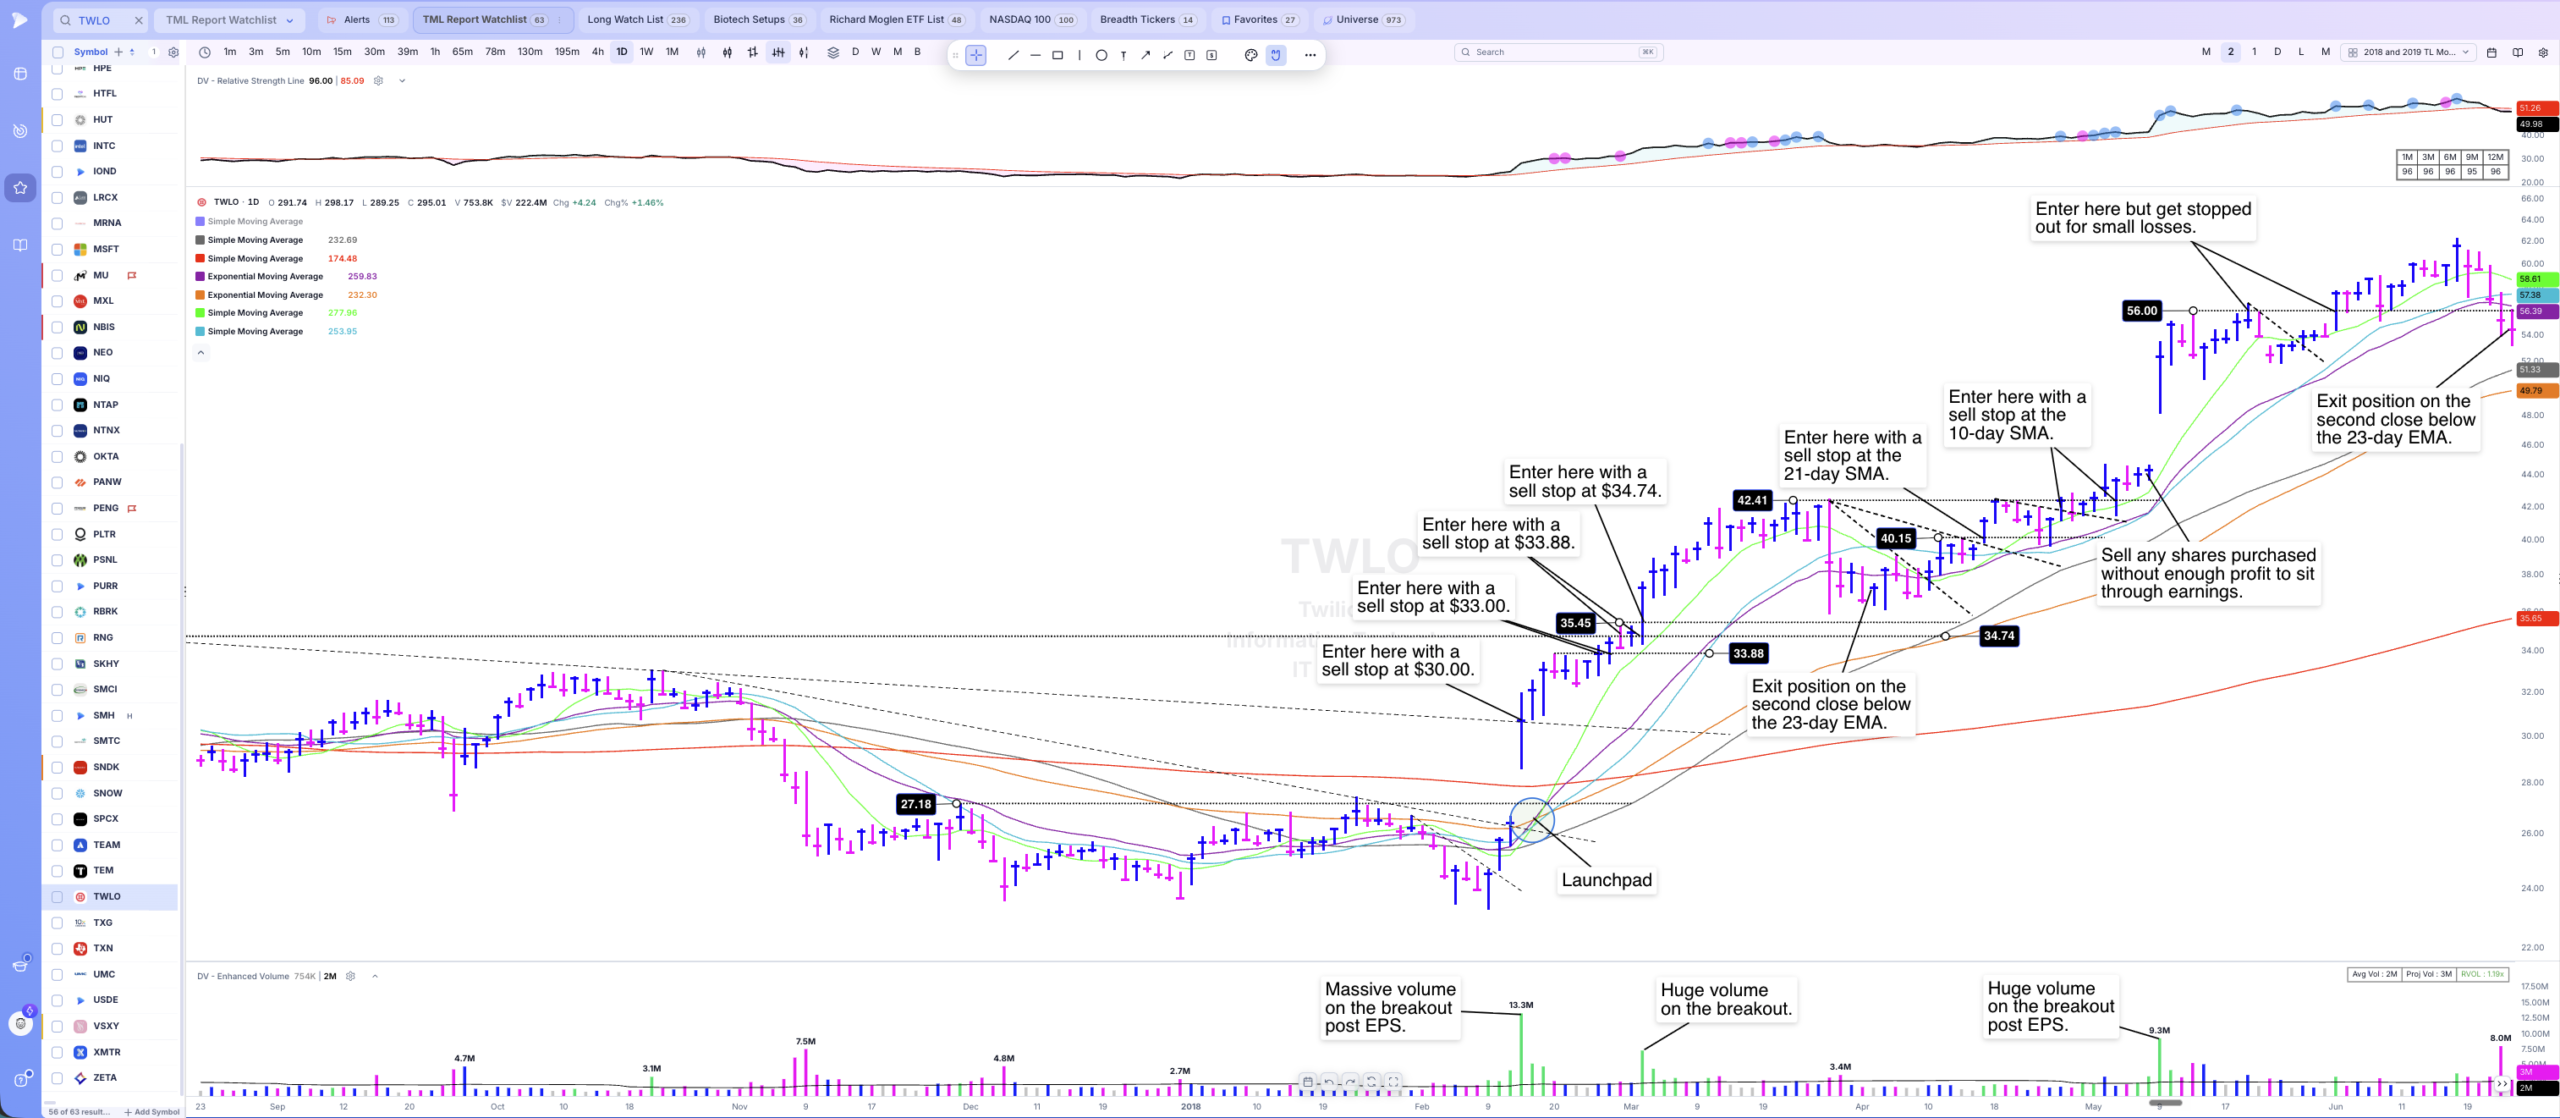
The second mark is the exit. My rule is the second consecutive close below the 21-day SMA (or relevant key moving average), where I sell at least a third to half, depending on the setup and where a stock is in its overall cycle. Marking that point across twenty leaders shows you, in cold blood, how often it kept the gain and how often it took you out early. It is not the best exit on every page. It is the one you can execute every time, and selling with moving averages only works if you do.
How it behaved in between
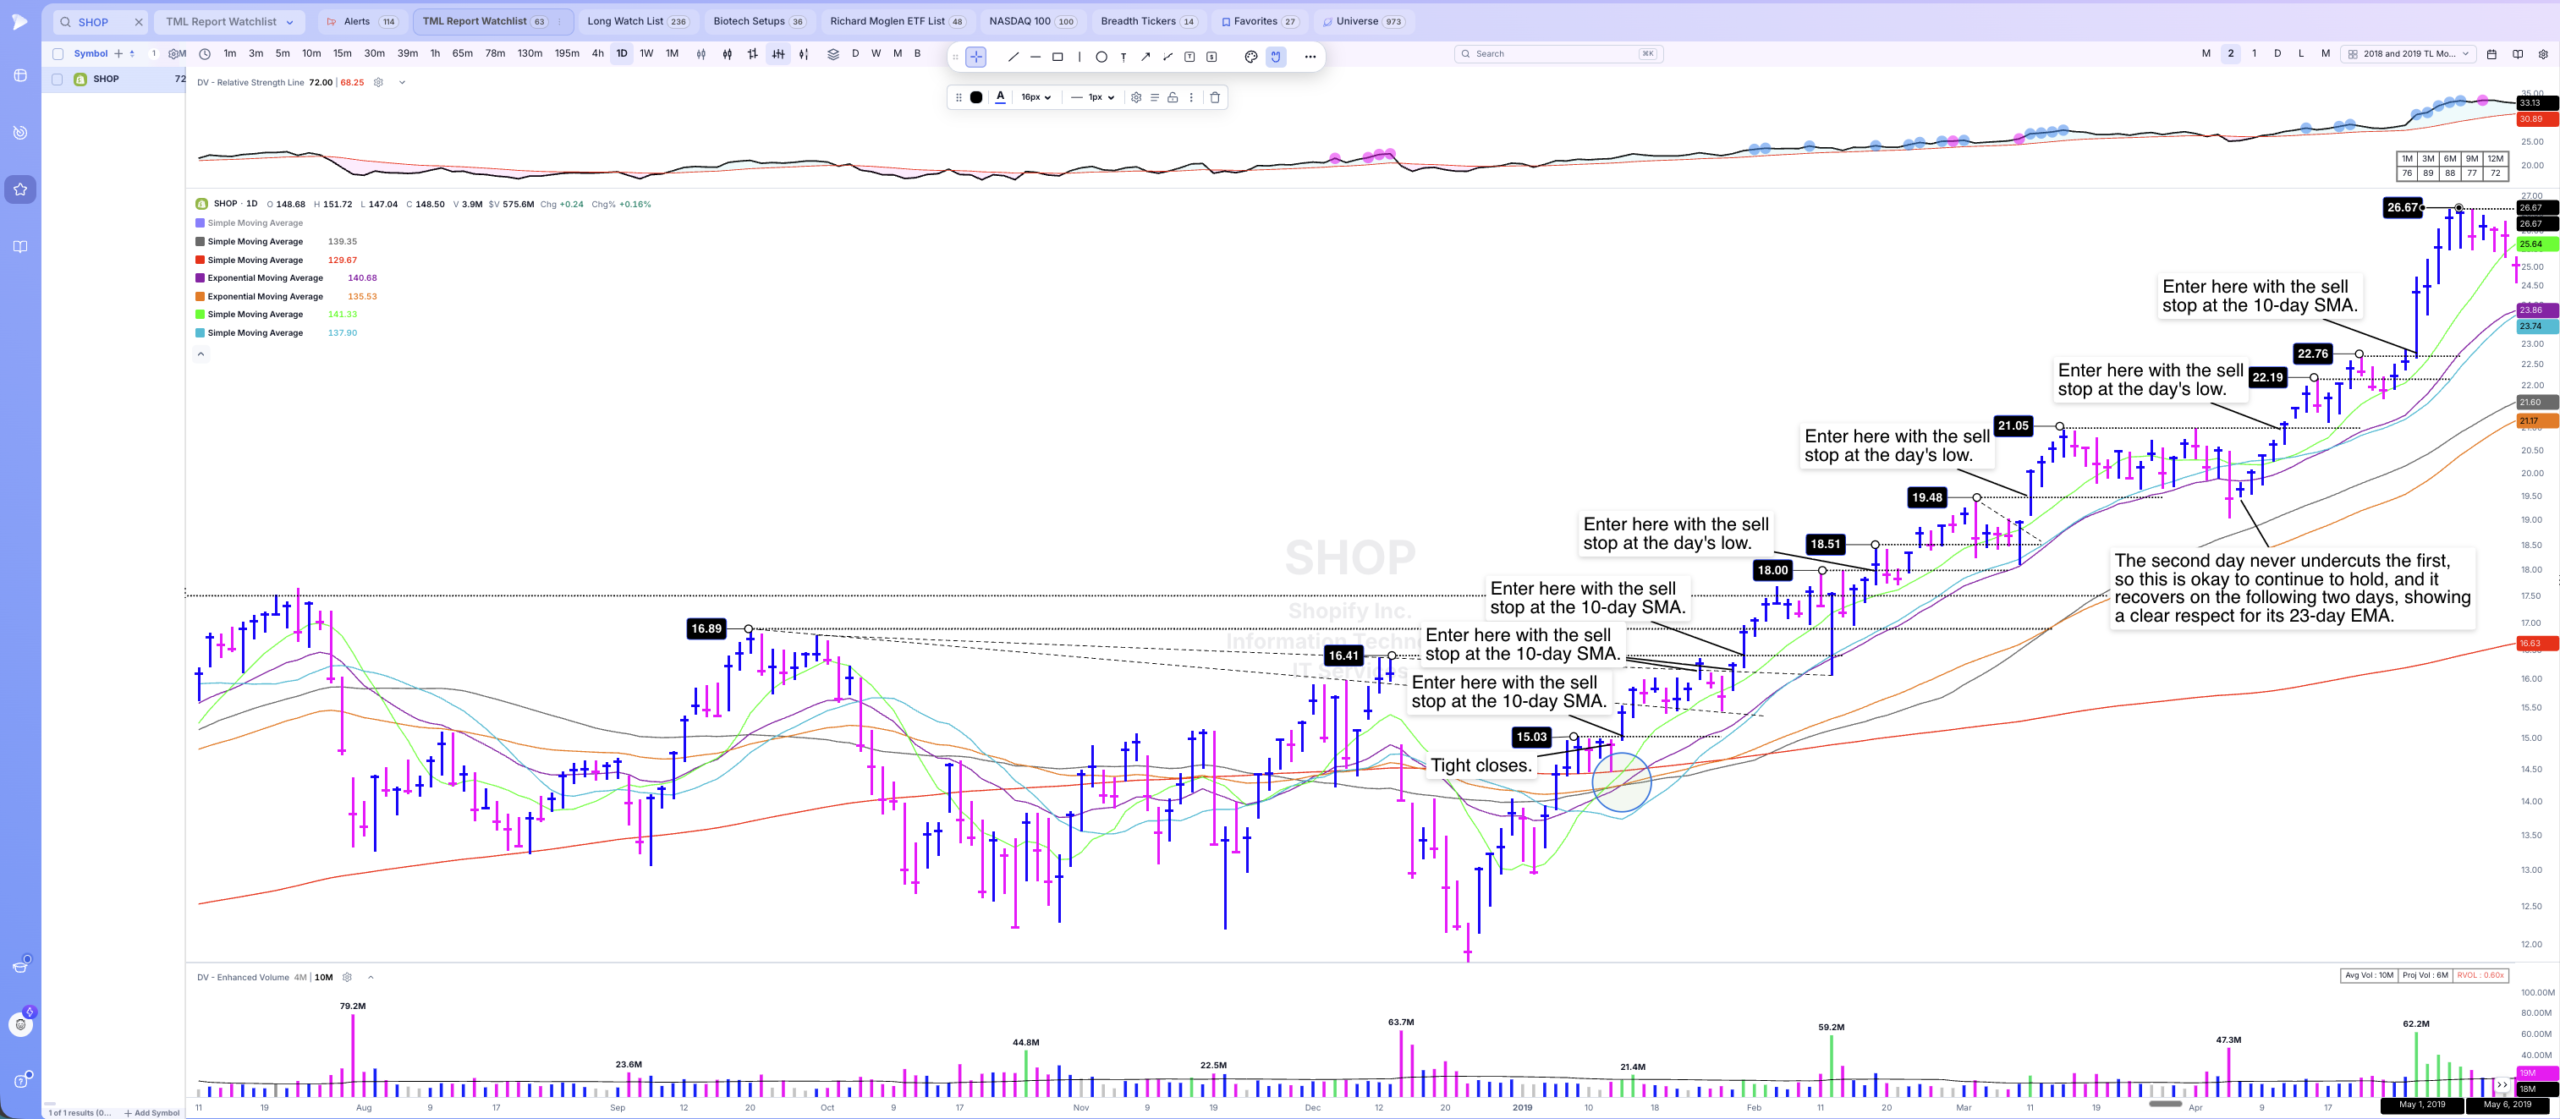
Stock personality. How it pulled back, and what it respected.
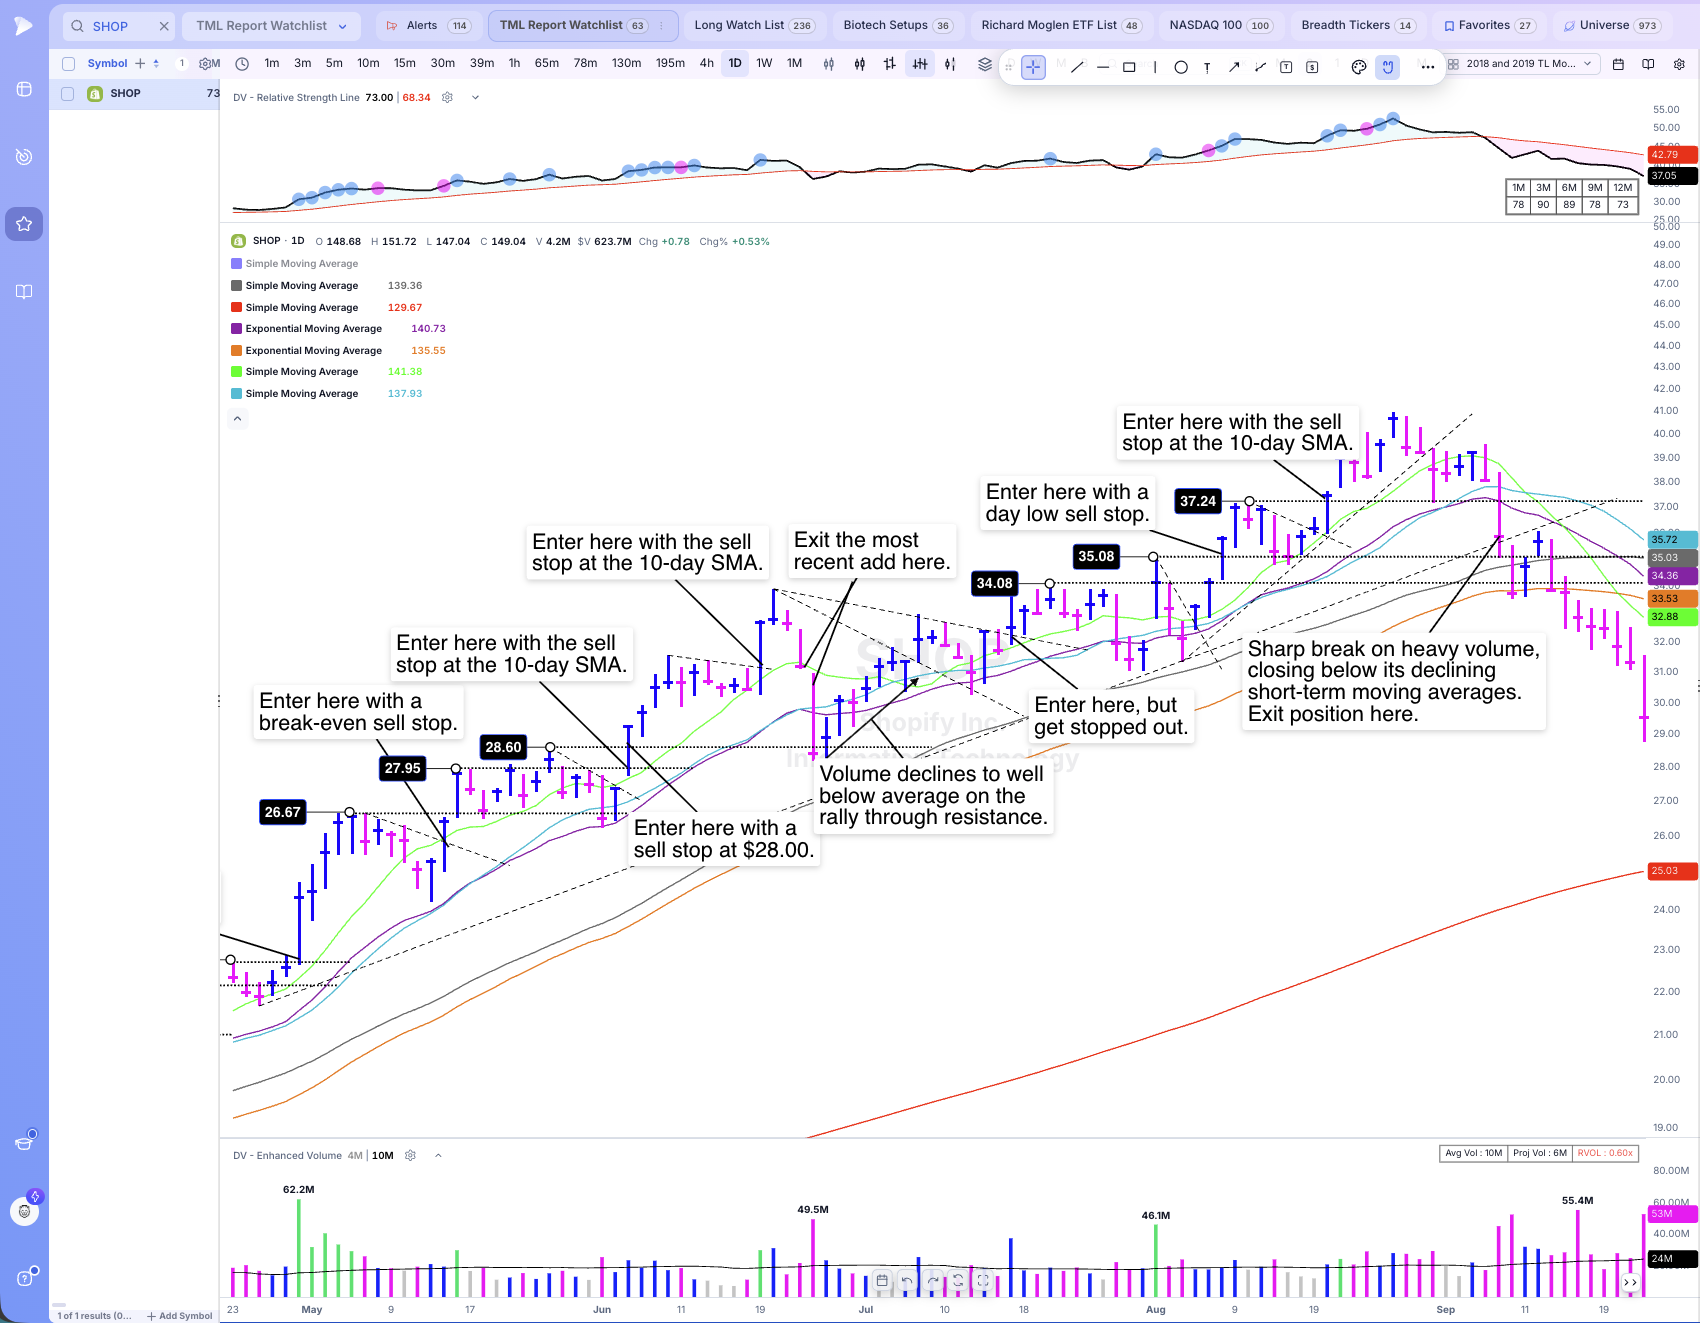
The rest of the notes on the same page.
The last thing on the page is the stock's personality. Did it respect the 21-day SMA or the 50-day SMA? How deep were its shakeouts? Did it run in tight, orderly weeks or wide, loose ones? Leaders in the same group, with similar personalities, often behave alike, so this note pays off the next time a similar name sets up. It tells you how much room to give it before the move even starts. Notice how SHOP in the charts above clearly respects its 10-day SMA and 23-day EMA, so those are its relevant moving averages.
Build Your Model Book This Week
You do not need six months or a printer that costs anything. You need five pages and one evening.
- Pick the five biggest advances of the last twelve months in the groups you actually trade. Not the biggest in the market — the ones in your lane.
- For each, pull the weekly and daily charts, with the 21-day SMA, 50-day SMA, volume, and the RS line.
- Mark the base, the pivot, the shakeout, and the second consecutive close below the 21-day SMA or other relevant key moving average for that stock.
- Write one sentence per page: what was visible before the move started. One sentence. If it takes a paragraph, you have not found it yet.
- On each page, write one line about the stock's personality: which moving average(s) it respected and how deep it pulled back.
- Print the five, put them in order, and read them front to back on Sunday. Then do five more next month.
If you get through three instead of five, that is still three more than last week. This is a habit, not a project — twenty minutes of it every weekend beats a heroic weekend you never repeat. Richard Moglen and Ameet Rai each keep their own version of this, and no two books look alike — yours does not have to look like mine either.
The TML Report
Twice a week I publish the marked-up version of this work — the market overview, the index charts, and a focus list of names with the lines already drawn on them. Same annotations described above, done on live charts instead of finished ones.