VCP Volatility Contraction Pattern Graphic

Mastering the Volatility Contraction Pattern

Nick Schmidt
Nick Schmidt

Nick Schmidt is a co-founder of TraderLion and Deepvue with over 10 years of market experience. Adopting a “less is more” philosophy, he focuses on weekly charts with an emphasis on price and volume.

October 25, 2024
10 min read
17780 views

What is a Volatility Contraction Pattern (VCP)?

The Volatility Contraction Pattern (VCP) is a stock setup that trader Mark Minervini uses to spot potential breakout opportunities. In his best-selling book Think and Trade Like a Champion, Minervini explains that the VCP forms when both volatility and volume gradually decrease, creating what he calls the “line of least resistance.” When a stock breaks above this pattern, it can signal a good buying opportunity.

The main idea behind the VCP is that each pullback in price gets smaller, forming a tighter range as sellers start to lose interest. This contraction tells you that supply is drying up, while demand could be building, setting the stage for a breakout. Minervini watches for a strong breakout with increased volume, which he sees as a sign of institutional buying and potential for a continued move upward. The VCP is key to Minervini’s strategy for achieving what he calls “superperformance” in stocks. By combining technical analysis with precise entry points, he aims to manage risk while riding strong momentum.

Volatility Contraction Pattern Example

Key Elements of a VCP

The Volatility Contraction Pattern (VCP) is a trading setup that shows a stock tightening up before a potential breakout. This setup has several key features:

  • Price Contractions: In a VCP, each price pullback is smaller than the last, creating a tighter price range over time. For example, the first pullback might be 25%, the next 15%, and then 8% for the final one. This pattern of shrinking pullbacks shows that selling pressure is easing.
  • Decrease in Volume: Each contraction also sees a drop in trading volume, indicating fewer sellers are active. This decline in volume suggests that supply is drying up, setting the stage for a move higher.
  • Symmetry and Structure: A VCP pattern usually forms with 2 to 6 contractions, each smaller than the last, creating a symmetrical “base” that tightens from left to right. This organized structure often signals that strong investors are accumulating shares.
  • Low Supply at the Pivot Point: The VCP reaches a pivot point where the price is at its tightest and volume is very low. If the stock breaks above this level on increased volume, it often triggers a strong upward move.
  • Continuation in an Uptrend: VCPs usually show up in an uptrend and act as continuation patterns. They’re most effective when a stock is already gaining and the VCP forms as a pause before the next leg up.

These characteristics make the VCP a useful setup for traders looking to enter a stock right before a breakout, increasing the odds of capturing the next big move.

Get our free Candlestick Cheat Sheet PDF with the most powerful candlestick combinations.

How to Catch a VCP Breakout

Here’s a simple, step-by-step guide to finding and trading a VCP (Volatility Contraction Pattern) breakout based on Mark Minervini’s approach:

  • Look for Stocks in a Stage 2 Uptrend: Start by identifying stocks that are in a strong uptrend, ideally in Stage 2 of the market cycle. According to Stan Weinstein’s Stage Analysis, Stage 2 is the advancing phase when stocks experience the most significant gains, driven by institutional buying.
  • Check for Volume Contractions: Watch for volume to drop with each price contraction. Each time the stock dips, volume should decrease. This signals that selling pressure is fading and that the stock might be ready for a breakout.
  • Watch for a Tight Base Near the Pivot: Toward the end of the pattern, look for the price to settle into a tight range with minimal day-to-day movement. Ideally, volume should be very low here as the stock approaches its breakout point, or “pivot.” This tightness shows that supply is minimal.
  • Enter on the Breakout: Wait for the stock to break above the pivot point on a surge in volume. Enter your position as soon as you see strong buying volume, which confirms that demand is pushing the price higher.
  • Manage Risk: Place a stop-loss just below the most recent low or a set percentage below the pivot. This will help limit losses if the breakout fails.

By following these steps, you can identify high-probability VCP breakouts and have a clear plan for entering and managing your trades.

VCP Success Rate

The Volatility Contraction Pattern (VCP) has a high success rate, especially in strong markets. Studies show that 60-70% of VCP breakouts lead to solid price rallies when they breakout with strong volume. This consistency makes VCP a popular choice among traders, particularly in bull markets where institutional buying pushes prices higher. When volume confirms a breakout, it shows that demand is outpacing supply—a key sign of strength. Traders trust VCPs for their reliable follow-through, which can lead to big gains if timed right.

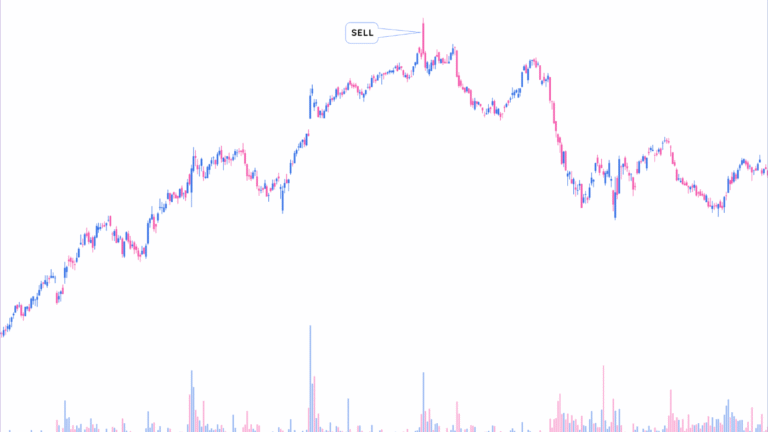
A strong VCP breakout often comes with a 30-40% volume spike on the breakout day. This surge shows that both big institutions and individual traders are backing the move, giving it the momentum to continue. Breakouts with high volume often see gains of 20-100% over the next few months. For traders, volume is a critical signal—it helps confirm if the demand is truly strong or if the breakout might fail. By keeping an eye on volume, you can spot the breakouts with real staying power and avoid weaker setups.

Volatility Contraction Pattern Duration

A solid VCP pattern usually takes 6 to 12 weeks to form, with 3 to 4 clear contractions in price. This timeframe and structure indicate that institutions are gradually accumulating shares, setting up a higher-probability breakout. Ideally, each contraction gets smaller, showing that selling pressure is easing. If the pattern drags on too long or includes too many contractions, it might suggest indecision, while fewer than three contractions may lack enough backing. Recognizing this ideal structure can help you identify high-quality setups and avoid ones that lack conviction.

The VCP’s Favorable Risk-to-Reward

One big appeal of the VCP setup is its strong risk-to-reward ratio, often 3:1 or better. By entering near the pivot point and placing a stop-loss just below the last contraction, traders can limit their risk to about 5-8% while aiming for gains of 15% or more. The VCP’s structure allows for good entries with tight stop-losses.

More than 50% of superperforming stocks—those gaining 100% or more in a year—show VCP patterns during their base-building phases. Growth stocks in sectors like tech, healthcare, and consumer goods often follow this pattern before making big moves, usually fueled by institutional buying. The VCP’s presence in these top stocks makes it a valuable tool for traders looking for high-growth opportunities. By focusing on stocks with VCP setups, you’re aligning with the traits that often precede explosive growth in market leaders.

Psychology of the Volatility Contraction Pattern

The psychology behind the Volatility Contraction Pattern (VCP) shows the shifting balance between buyers and sellers, setting up a breakout as uncertainty fades. Here’s a breakdown of the psychological stages in a VCP and why this pattern repeats itself:

  • Accumulation and Exhaustion of Sellers: At first, the stock sees sharp pullbacks, with sellers in control. But as institutional buyers and “smart money” start accumulating shares, they create a support level, preventing price from dropping further. Each pullback becomes smaller, showing that sellers are losing momentum. At this point, the remaining sellers hold out for higher prices, reducing the stock’s available supply.
  • Reduced Fear and Growing Confidence: With each contraction, fewer investors are willing to sell, signaling that fear is fading. The psychology shifts—investors notice the stock is holding up better with each dip, suggesting that larger players are buying. Early skeptics who pushed the price down start questioning their position, while buyers gain confidence as volatility continues to shrink.
  • Building Pressure and Anticipation: The pattern of tighter price and volume contractions creates a “pressure cooker” effect. Each smaller pullback reinforces this tightening pattern, building anticipation. As more people recognize this setup, the stock approaches a tipping point. At this stage, even a small increase in buying pressure (often signaled by a volume spike) will trigger a powerful breakout as sideline watchers jump in to avoid missing out.
  • Breakout and Demand Confirmation: When the stock finally breaks out of the VCP, it shows that demand has clearly overtaken supply. This release of pent-up pressure leads to a strong upward move, often supported by a surge in volume as new buyers pile in, validating the breakout. Early buyers who spotted the VCP setup are rewarded with quick gains, attracting more momentum traders and reinforcing the stock’s strength.

Each stage reflects a shift in market sentiment—from fear and hesitation to anticipation and confidence—which turns into a breakout that confirms both the technical and psychological strength of the setup.

VCP vs Other Bullish Chart Patterns

  • VCP vs. Cup with Handle: The VCP (Volatility Contraction Pattern) is defined by successive price contractions that indicate a sharp shift in the supply-demand balance, which generally leads to explosive breakouts from a tight range. This pattern is ideal for traders seeking quick, high-momentum plays with tight risk control. In contrast, the Cup with Handle pattern takes longer to form, with a rounded, U-shaped base followed by a smaller handle pullback. The extended base-building in a Cup with Handle attracts institutional interest over time, but VCP’s rapid tightening signals a faster breakout opportunity.
  • VCP vs. Double Bottom: The Double Bottom pattern involves two lows with a rebound in between and a slight undercut on the second low to shake out weak hands. In the CAN SLIM system, Double Bottoms are viewed as continuation patterns in an uptrend, where strong stocks re-establish their upward momentum after testing and undercutting support. The VCP’s emphasis on sequential contractions creates a smoother, low-risk entry.
  • VCP vs. High Tight Flag: The High Tight Flag signals extreme momentum, characterized by a rapid 100-120% price surge over a few weeks, followed by a brief consolidation. Unlike the VCP’s controlled, low-risk approach with progressively tighter contractions, the High Tight Flag is more aggressive, as stocks in this pattern can either break out explosively or fail quickly. Both patterns signal powerful moves, but the VCP is suited for those who prefer a structured buildup in demand, whereas the High Tight Flag attracts traders looking to ride intense momentum. In other words it is a little easier to manage risk in the VCP.

How to Scan for Volatility Contraction Patterns (VCP)

To quickly spot Volatility Contraction Patterns, use a VCP scanner like Deepvue. With unique metrics like Relative Measured Volatility (RMV) and pre-built scans based on proven trading strategies, Deepvue makes finding VCPs easy. Here’s how to use it to catch these high-potential breakout setups.

Use RMV to Spot Volatility Contractions

Relative Measured Volatility Infographic finding VCPs. Volatility contraction pattern

In a VCP, each price pullback gets smaller, reducing volatility over time. Deepvue’s RMV metric tracks these contractions, making it easy to see when volatility is dropping and selling pressure is fading. RMV helps you tell the difference between stocks that are just consolidating and those displaying VCP characteristics and setting up for a breakout.

Run Minervini’s Scans

Deepvue includes scans built around Mark Minervini’s trading methods, giving you quick access to high-probability setups. The key scans include:

  • Minervini’s Power Play: This scan finds stocks that match Minervini’s criteria for tight volatility contraction and steady accumulation. It highlights stocks with the technical and volatility patterns typical of successful VCP setups, so you can focus on high-potential breakout candidates right away.
  • 3- and 6-Month Trend Template Scans: These scans target stocks in strong uptrends over the past 3 or 6 months—a key trait of Minervini-style setups. Start with stocks in an established uptrend, then apply RMV to zero in on the best VCP candidates.

Deepvue’s RMV and Minervini scans let you quickly scan the market for structured, low-volatility setups that signal a potential breakout. Deepvue helps focus on stocks that meet VCP criteria and maximize your chances of catching the next big move.

Frequently asked questions

The VCP is a chart pattern traders use to spot stocks that are highly likely to break out. In this setup, the stock’s price and trading volume gradually “contract,” meaning each pullback is smaller than the last. This signals that selling pressure is easing and demand is building up.

Low volume during price contractions in a VCP suggests that selling pressure is drying up. When fewer sellers are willing to sell, it creates a low-supply environment, making it easier for buyers to drive the price higher. The final contraction, or pivot point, should have the lowest volume, showing that supply is minimal just before the breakout.

A good VCP pattern scanner, like Deepvue, is designed to accurately spot key VCP characteristics—gradual price and volume contractions—efficiently. Deepvue offers features like Relative Measured Volatility (RMV) and pre-built Minervini scans, specifically created for finding high-probability VCP setups.

A classic VCP pattern typically has 2 to 6 contractions, with each pullback getting smaller. The symmetry and structure created by multiple contractions help confirm that the stock is building a strong base. A pattern with only one contraction might not be reliable, while too many contractions could mean the pattern has lost momentum.

VCP patterns are most effective with stocks already in an uptrend, as they act as continuation patterns. Look for stocks that have shown recent strength and might be attracting institutional interest. Minervini’s approach focuses on stocks with consistent uptrends, where the VCP forms as a pause before the next leg up.

0 Comments
Most Voted
Newest Oldest
Inline Feedbacks
View all comments
Start Learning with TraderLion for free.

Enroll in the Ultimate Trading Guide, get access to fresh course releases, exclusive webinars, and more.

Get Started For Free

Related articles

Explore related educational content from the Lion’s Den.

Explore the Lion’s Den
  • Oliver Kell Wedge Pop Pattern