Weekend Trading Routine: How I Prep the Week

Ross
Ross is a co-founder of TraderLion and Deepvue. He was mentored by William O’Neil, and co-authored The Model Book of Greatest Stock Market Winners at WON + Co.
Published: November 4, 2026


 Ross Haber
Every new post, straight to your inbox
If this was useful, the next one will land in your inbox the day I write it.
What Does a Weekend Trading Routine Look Like?
I look at the market all day, every day, so my routine never really stops. But if I had limited time and had to pick one window to do this work, it would be Friday after the close, Saturday, or Sunday. That’s when the weekly charts are complete.
The routine builds my watch lists, but that isn’t the real value. The real value is that it keeps the market story in my head: what’s leading, how long it’s been leading, what’s going up, going down, or chopping around, and where the money is coming from and going to. It’s the same habit behind knowing when not to trade. The screens tell me about the market’s health before the index does.
Why a Weekend Trading Routine Matters
The two people I learned from, first Bill O’Neil and then Stan Weinstein, built their systems and studies largely around the weekly chart. When I started working with Bill in 1998, he looked at a daily chart the way I’d look at a 5-minute intraday chart. The weekly action cleans up much of the daily noise, and the weekend is when that weekly bar finishes.
Why I use three time frames
Bill actually used all three time frames – daily, weekly, and monthly- and so do I. Without all three, you miss key support and resistance levels. A stock that looks extended on the daily may only be approaching a breakout on the monthly. Dr. Eric Wish, Richard Moglen’s professor, calls a move into new all-time highs a Green Line breakout, and on a years-long basis it’s super significant. On the daily, the stock may look late. On the monthly, it’s coming out of a base that took years to build.
Timing matters less than consistency: the ideal time to run your screens is after the week has finished. If it has to be a Wednesday, that’s fine. Do it weekly if you can, and at a bare minimum monthly. The comparison between sessions is where the information is.
My Weekend Routine, Step by Step
I go top-down: the market first, then the stocks, then the lists and alerts.
Start with the indexes
The Nasdaq first, then the S&P 500, then the Russell 2000. For confirmation and the complete picture, I look at the Dow, even though it’s the least relevant of the four. It’s important to Stan, so I always include it, but it rarely influences my decisions. At most, it weighs slightly as one piece of evidence.
For each index, I ask the same questions. Are we in an uptrend, with a follow-through day behind us? If so, how many distribution days are there, and how long ago did the trend start? Then the most important question: which stocks are leading it, and where are they in their own cycles? If the leaders are getting late, is there obvious rotation for that money to go into? Analyzing the indexes is fine, but in the end it all comes down to the health and breadth of the leaders.
Run five screens
All of my go-to screens are presets in Deepvue. These are my top five:
- Up on Volume.
- Deepvue Leaders.
- Ameet Rai’s 62.5% RS Days.
- Relative strength new highs, 12-month. Six-month is fine too. It’s personal preference and depends on the time frame that suits you. I run it alongside relative strength new highs before price, because I’m always looking for that in the RS line.
- The volatility contraction pattern screener. I like it, but I don’t run it as consistently as the others.
Sort by relative strength, then by price
These lists can be big. Sometimes they contain hundreds of names. So, I sort by 12-month relative strength, from 99 down, and start at the top. I don’t necessarily get through the whole list. Once I’m in the low 80s and high 70s, the stocks usually start looking “bad.”
Relative strength sorting has two blind spots. Very low-priced, thin stocks can generate a high RS rating and be irrelevant. And the RS line and the RS rating are different things. A liquid, high-quality stock working its way off the bottom can have an RS line screaming at you while the rating is still in the 60s, 70s, or 80s on its way into the 90s.
So when there’s a ton of stocks, I clear the relative strength sort and do a brand new sort on price, highest to lowest. You can still get some thin, high-priced stocks, but in general you get what you pay for. It isolates the bigger, more liquid names, and if one has an RS line worth looking at that the rating isn’t picking up yet, I’ll see it. I keep going until the stocks start looking “bad,” or like “garbage” again, or I’m seeing names I’ve already looked at.
I’ve developed that “garbage” feel over more than three decades in this industry. But the goal is practical: find a way to get through what’s good in a 500-stock list in five or ten minutes, not 30 or 40.
Build the lists and set alerts
For every stock that catches my eye, the first question is whether it’s already on one of my lists. If it isn’t, I add it to the relevant lists.
Then I ask: is it actionable? Is it something I want to know about if it moves when the market opens Monday? If so, it gets an alert. There are two kinds:
- Alert bands. An alert just above the current high and just below the current low. These are not buy or sell alerts. They tell me which direction a stock is moving once it gets going. I set them across several leaders in the same group.
- Actionable alerts. Tight alerts around stocks I might buy or sell the next day.
I try never to have more than 100 alerts going. Past that, it becomes unmanageable, and quite honestly, 100 is tough. I’ve done it since the day I sat down at O’Neil, so it’s part of my process, but it’s labor-intensive and can get stressful when the market’s fast. I’m not sure I’d recommend it unless it fits the way your brain works.
Narrow to a focus list
The lists get narrower as they go. My long watch list can be well over 100 names. My TML Report watch list, the higher-quality names that deserve more focus for fundamental or technical reasons, runs around 50 to 70. My focus list is a dozen to 15.
From that, I focus on three to five, and I let the market push me into the top two or three. Most of my core positions end up in just two or three stocks. Around them, I may hold some performance enhancers: smaller positions in riskier stocks that I think may boost the portfolio’s performance. Hence the name.
What it looks like when it fails
The routine breaks down in a few predictable ways. Running it irregularly, so you lose the comparison to the last session. Changing your screens every week, so you can’t tell whether the market changed or your filter did. Relying on the RS rating alone and missing the liquid leader whose RS line is already at a new high. And carrying more alerts than you can actually watch. An alert you ignore does nothing.
What the Routine Tells Me About the Market
This is the part most people miss. Done the same way every week, the routine is one of my best reads on the market.
Market health
The first thing I notice is how many sound setups there are. In a healthy market, the screens are full, and I’m cutting good charts to keep the lists manageable. When the watch list starts drying up, with fewer stocks forming proper bases each week, that’s a warning, and it often comes before the indexes break down.
Leadership and group moves
The second thing is which stocks keep showing up, and what their groups are doing. This is where the alert bands earn their keep. When I set bands around three, four, or five leaders in the same group, and the group starts moving, they tend to alert together. Not every time, but often. When one fires, I check the rest of the group: is this stock moving with its group, on its own, or in the opposite direction? Leaders lead, and laggards lag, and the alerts show me which is which.
Rotation
The third thing is where the money is going. Market, sector, group, stock, like Russian nesting dolls. When the current leaders are getting late in their cycles, and a new group starts showing up on the screens with several stocks at once, money is rotating. Seeing it from my own screens usually gets me there before the headlines do.
September 2025: the screens saw it first
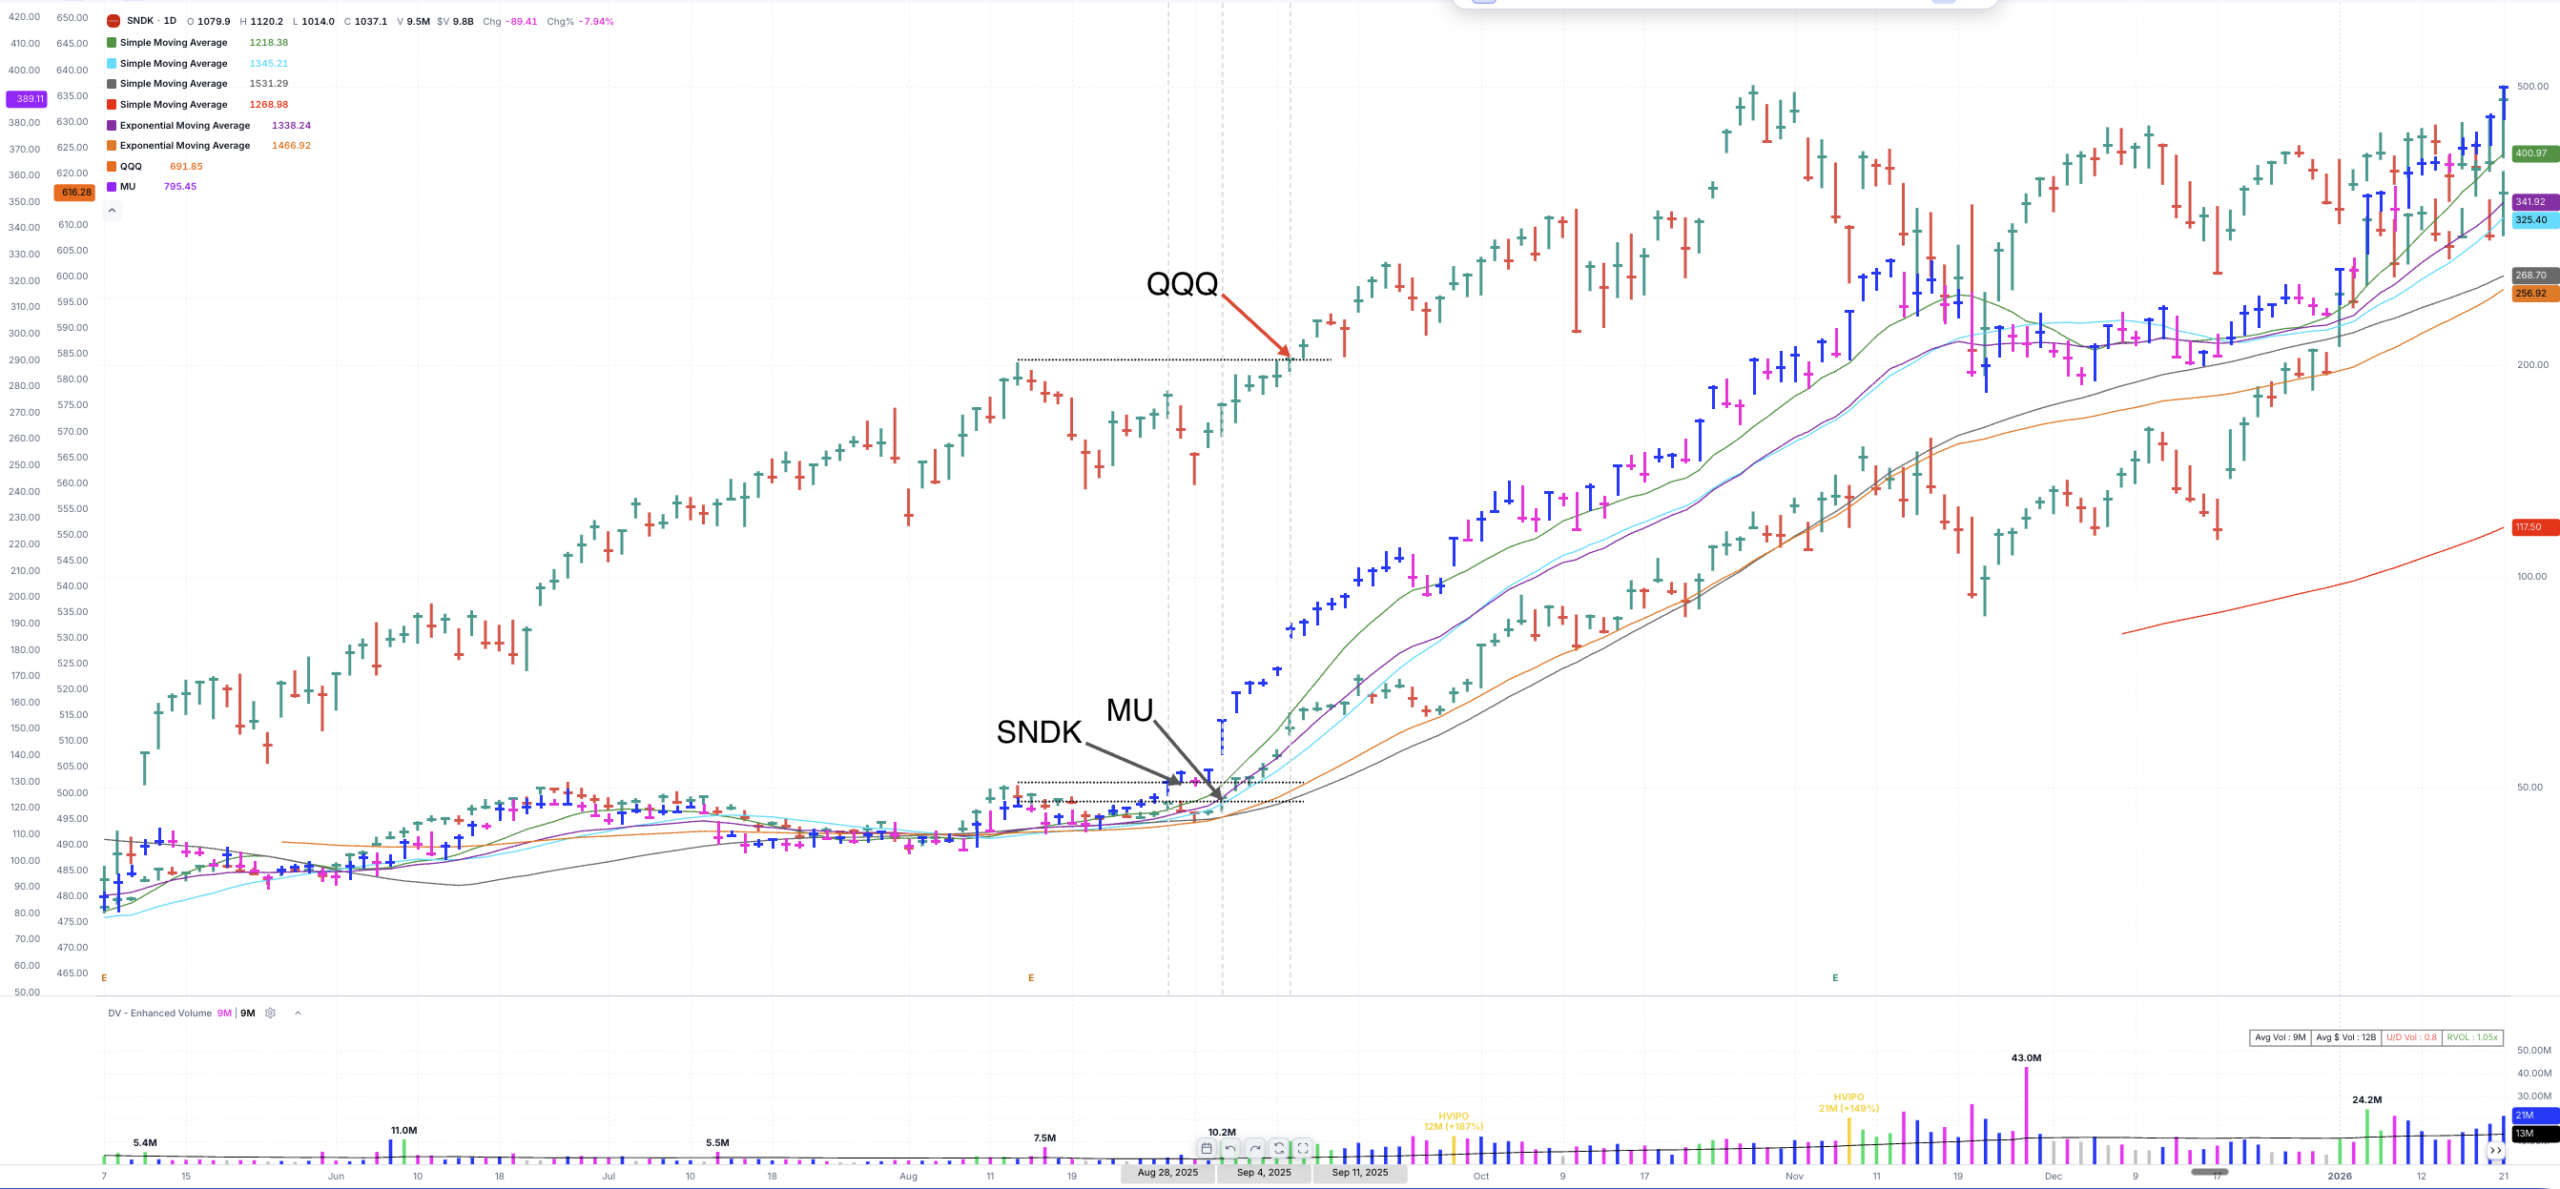
The leaders were setting up on the screens before the market really got going.
In September 2025, before the market really got going, there was constructive strength showing up on my screens in memory stocks, photonics, and semiconductors, especially those tied to AI, along with biotech. Those names were working and setting up clearly, and that told me the market was healthy and getting ready to go.
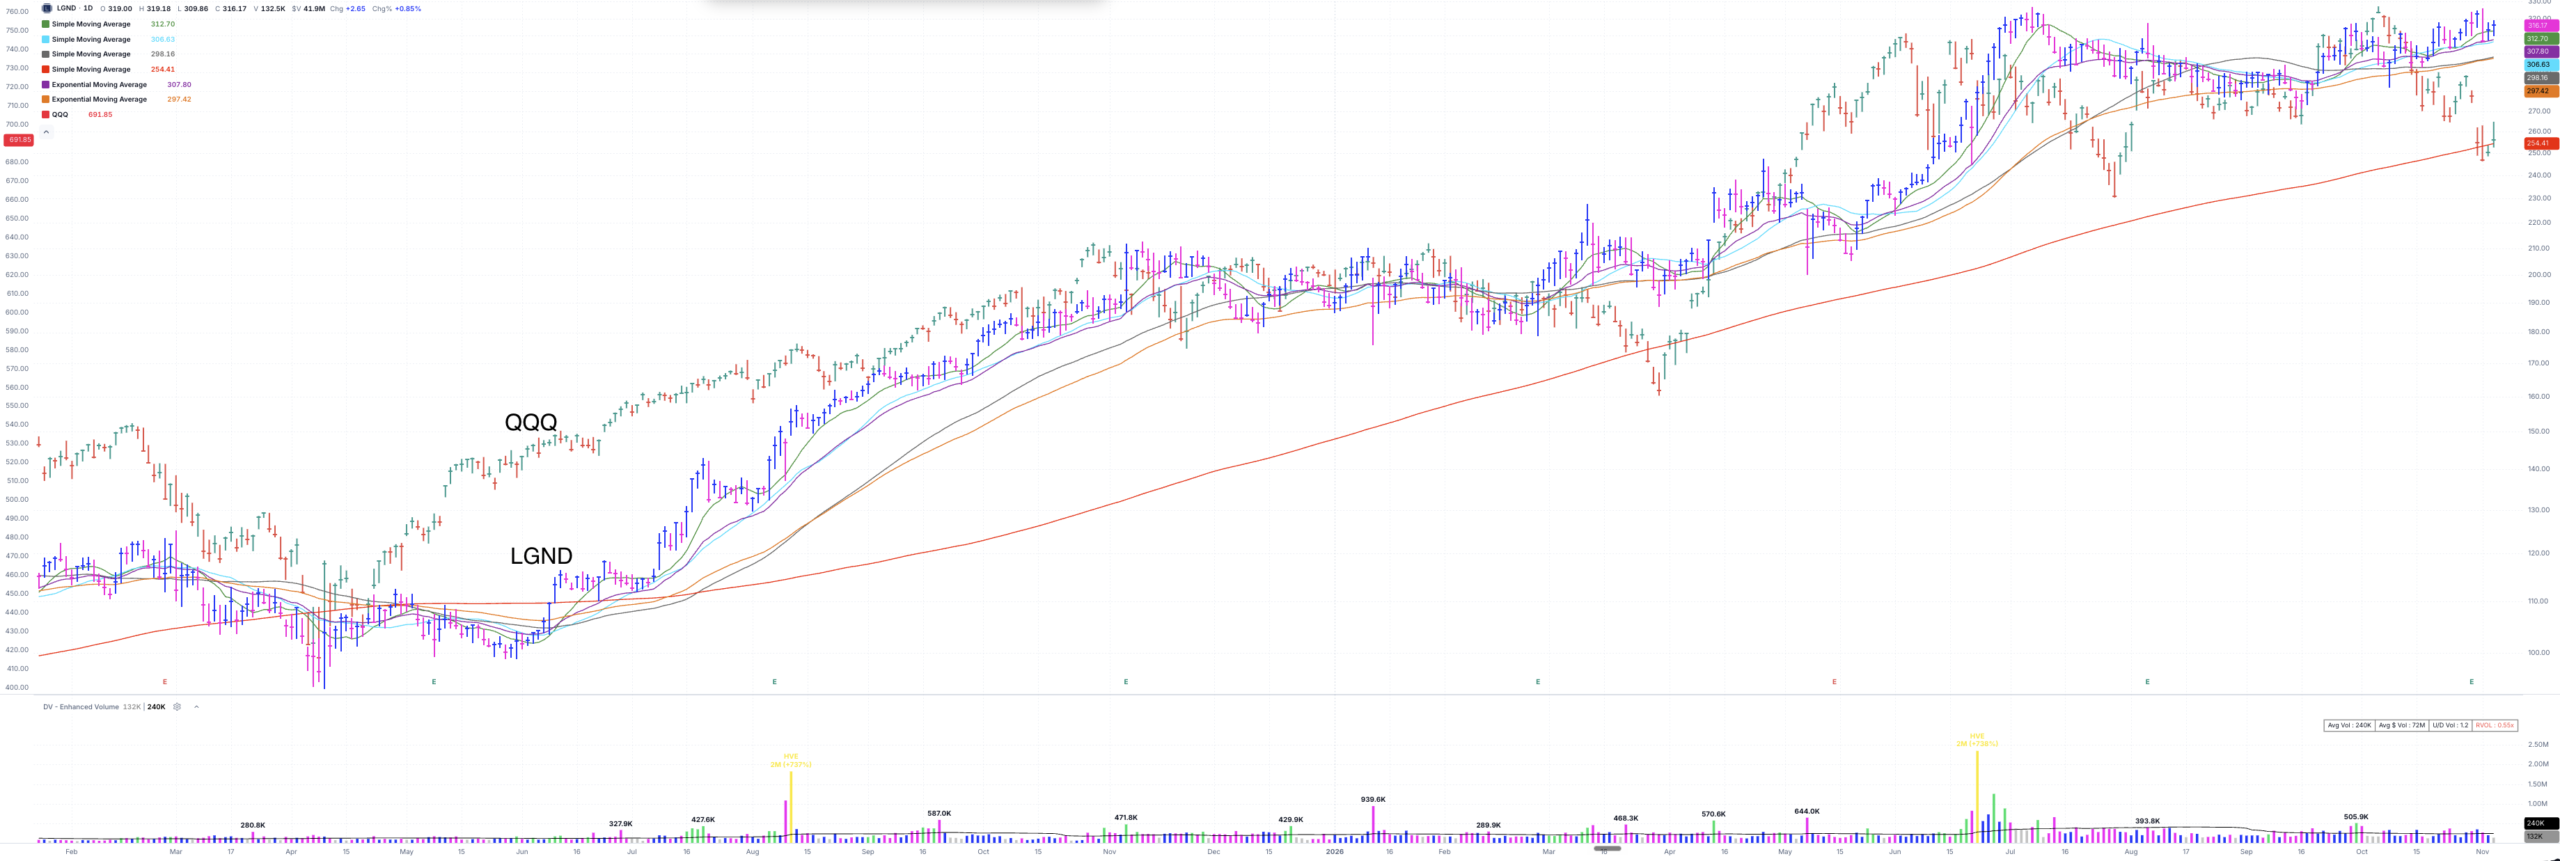
Biotech started showing up in 2025 and kept showing up, week after week.
Later in 2025, software and healthcare were also solid. Biotech was looking good in 2025 and has stayed strong through 2026, showing up on the screens week after week. That kind of repetition is what leadership looks like.
Build Your Weekend Routine This Weekend
- Check the indexes in order: Nasdaq, S&P 500, Russell 2000, then the Dow. Write one line on each: uptrend or not, distribution day count, and how long the trend has run.
- Pick three to five screens and commit to them. If you use Deepvue, the presets above are a good place to start.
- Sort each screen by 12-month relative strength and work down until the charts turn bad. Then re-sort by price to catch the bigger, liquid names the RS rating is missing.
- Add what’s worth watching to a broad list and a narrower quality list. Keep a focus list of no more than 15.
- Set alert bands around a few leaders in each leading group, and keep your total alerts to a number you can actually watch.
- Write down which groups the best names came from. Next week, compare.
There’s no right or wrong number of screens. Whatever you need to do to feel you’ve gone through the market sufficiently and have all the stocks worth looking at, that’s your routine. Just do it every week.
The TML Report
Twice a week, I publish where I think we stand: the market overview, the four index charts, and a focus list that comes out of this routine, with the lines already drawn on them.