Top-Down Analysis: Market, Sector, Group, Stock

Ross
Ross is a co-founder of TraderLion and Deepvue. He was mentored by William O’Neil, and co-authored The Model Book of Greatest Stock Market Winners at WON + Co.
Published: September 16, 2026


I’ve always thought Russian nesting dolls were the right picture for how I do top-down analysis. The market is the largest doll. Open it and you find the sectors, then the industry groups, and finally the smallest doll — the individual stocks. You open them in that order, every time, and you never skip a doll. The reason comes straight from Bill O’Neil: three out of four stocks follow the market’s trend.
That is why the order matters. Anytime the market isn’t in an uptrend, progress gets much more difficult — and in a downtrend you are absolutely swimming upstream. In a sideways, choppy market that might even be drifting higher, you may decide to participate only in a small way. But the idea is to participate when the market is in an uptrend, and only in an uptrend, so the wind is at your back and three out of four stocks are pulling in your direction.
This post is the whole structure, doll by doll: what I need from the market before anything else matters, how I sort the sectors and groups, how I confirm a group is real, and how the smallest doll — the stocks — ends up on my focused watchlist.
Table of Contents
Ross Haber
Every new post, straight to your inbox
If this was useful, the next one will land in your inbox the day I write it.
Why Top-Down Analysis Matters
Because without an uptrend in place, nothing else matters. You can find what you think is the greatest company with the greatest fundamentals, and if the market is in a downtrend, you’re going to have a very hard time making progress in it. There are always the few stocks that go up in a down tape — finding them is not the game. Hunting the exceptions is swimming upstream, and the whole point of top-down analysis is to never be swimming upstream in the first place.
The same logic is why I don’t short a bull market. It’s not just that you’re fighting the trend. The math itself is against you: a short exposes you to unlimited losses, and the most you can make — if you’re perfectly correct and the company goes out of business, which almost never happens — is 100 percent. On the long side, with the trend at your back, it’s reversed: unlimited upside, and losses you keep very limited by how you enter and size the position. One side of that trade has the wind and the math. I take that side.
The Market Doll: Nothing Else Matters Without It
For me to participate — this is the M in CANSLIM — a sustainable uptrend or bull market must be in place. And behind that price action, I want sound fundamentals supporting the broader move. You don’t need to be a macroeconomist, but the environment should be favorable: think low interest rates, or better, being on time for the early part of a high-growth cycle. And be careful with the obvious version of that checklist — rates can even be rising. What matters is the market’s reaction to the rises, not the headline itself.
The hand I most want to be dealt — the hot deck — is the market putting in a bottom, following through into a new uptrend, with tons of new groups of leaders building early-stage bases underneath it. Price confirmation plus fresh leadership plus a growth cycle just starting: that’s when I want to be as involved as I’ll ever be.
One of history’s best example of “the environment beats the headline”: right before the massive bull market of 1998 to 2000 got going, Fed Chairman Alan Greenspan gave his famous irrational exuberance speech. From that point on, the market went up beyond anyone’s belief — one of the greatest, fastest, sharpest bull markets in history, backed by the beginning and boom of the internet. The “most credible warning in the world,” followed by six consecutive raises in interest rates by the Fed and the tape ignored it, because the growth cycle underneath was real. Trade the reaction, not the speech.
The Middle Dolls: Sectors and Industry Groups
Once I’m comfortable that a healthy uptrend is in place, I open the next two dolls: the leading sectors, then the industry groups inside them. Why so much weight here? O’Neil’s studies put a number on it: 49% of a stock’s move is directly related to its sector and industry group — 37% to the industry group and 12% to the sector. Half the move you’re hoping for is decided before you’ve picked the stock. Group moves are that big. I can’t stress it enough.
From O’Neil’s work and the many cycles I’ve watched over the last 30 years, a sustainable uptrend needs at least a few groups of leaders with sound fundamentals leading the way. And here’s the split that shapes where I hunt: three out of four big leaders come from a traditional growth group. One in four is a cyclical or industrial name. Bill really drove home, in the time I spent working with him, that you should stick with the traditional growth side of that ratio. So that’s what I do, as much as I can.
Traditional growth vs. cyclical and industrial
Where leaders come from
- Traditional growth — three of every four leaders. Tech: semiconductors, hardware, software, and all the related infrastructure. Medical and healthcare: biotech, genetics, medical equipment and supplies, pharmaceuticals. And specialty retail — including, at times, the major discount chains — which has produced some really solid growth stories over the years.
- Cyclical and industrial — the fourth leader. Oil, energy, gas, metals, mining, materials. The underlying is the price of a commodity — gold, oil, something we truly know nothing about as stock pickers — so it’s not the same animal as an individual growth story.
When cyclicals trade like growth stocks
The cyclical bucket isn’t off-limits — it’s on a timer. These groups have their periods where they perform extremely well and make powerful moves over short stretches, just like any traditional growth name. The key is recognizing when those periods are at hand and participating only during them. Around 2005 and 2006, with China’s industrial boom running, steel, metals, agriculture, oil and energy were all going at once. If you didn’t know which tickers belonged to those charts, you would never have guessed they were anything other than traditional growth.
That’s the tell: the whole complex moving together, with power. When the underlying commodity is doing what it needs to do, you can focus on the earnings of the individual companies, then enter and set sell stops like anything else. They’re not your typical CANSLIM buys — but when they’re all working together like that, they are more than fine to buy.
How I Confirm a Group
Here’s my check, and it’s also how I find out I’m wrong about a stock I like. Say I see a cybersecurity name and think: this looks great. Before anything else, I pull up the top 5 to 10 highest relative strength stocks in its group — with sound fundamentals — and ask whether they’re participating. If I look through the first five or six and it’s all downtrends and chop, irrelevant to the one that’s exploding, that stock just lost most of its case. One or two stocks in a group isn’t enough. In a smaller group I want to see at least 3 or 4 other names confirming. In a huge group like semiconductors or biotech, there should be 5, 8, 10 super high-quality, liquid names with institutional participation setting up together. That’s what a healthy group looks like, and that’s how I know it should work.
Early-stage bases or late?
Then look at where those stocks are in their base-building cycles, because the ideal I described at the market level — leadership in early-stage bases — gets graded here, stock by stock, using O’Neil’s base counting. A stock breaks out of its first base and moves 20 to 25 percent, then builds a new base: that’s a second-stage base, still early. Break out again, run another 20 to 25 percent, build again: now you’re at a third-stage base, considered later stage, and the chances of breakout failure go up tremendously. Make it to a fourth and they go up even further. The best of the best keep building bases and breaking out for years — but those are far and few between. A group full of late-stage bases is one I tend to stay away from, relative to a group forming constructive early-stage bases, fresh off a follow-through day. And yes, we can all look at stocks like Apple now and say we should have bought it 20 years ago and left it alone. Easier said than done, especially with a big position working on building its Nth base below the key long-term 200-day SMA.
The Smallest Doll: From Group to Watchlist
The individual stocks in the leading groups are what I’m ultimately screening to build my watchlists — maintained and updated so I always know what’s most actionable for the day or the week. Inside a confirmed group, I want the highest-quality, highest relative strength stocks with a tight and orderly personality, and then it’s down to levels and entries. Here’s part of the structure running live, right now, on two of the areas leading the current market: the software sector — specifically cybersecurity — and medical/healthcare sector, specifically biotech.
Cybersecurity — CIBR and the group behind it
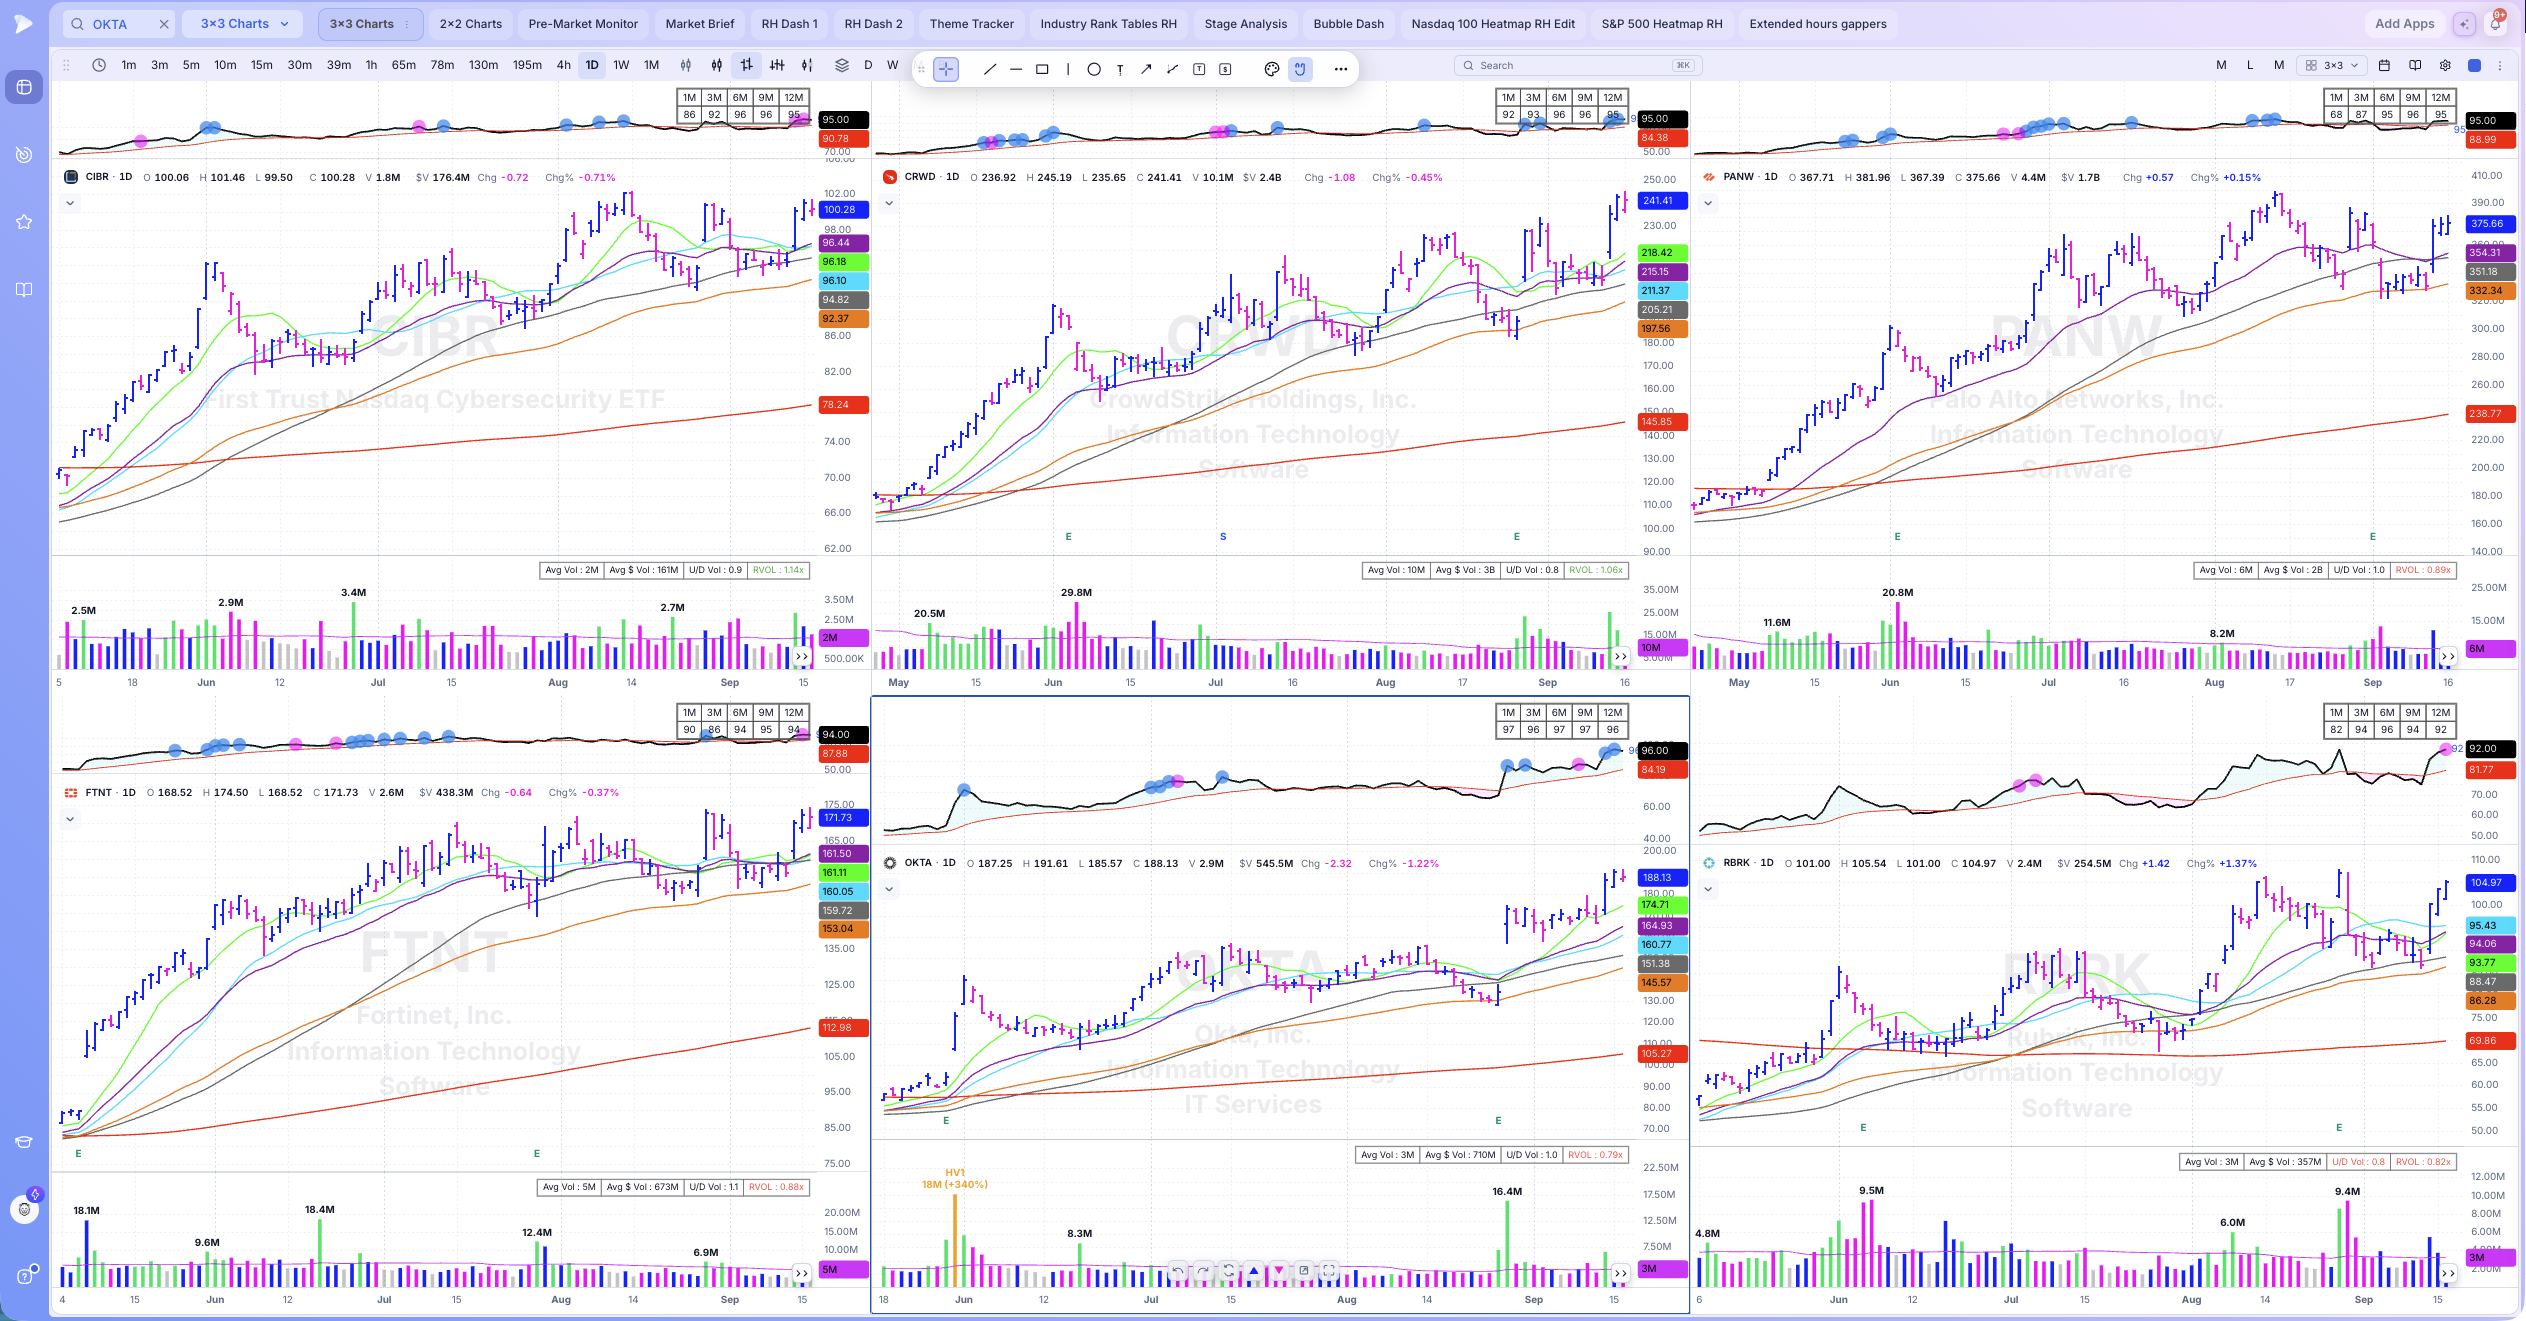
The ETF is shaping up like the big leaders inside it. When the wrapper and the contents match, the group is telling the truth.
CIBR, the cybersecurity ETF, is shaping up like very many of the big leaders within its group. Pull up PANW — very similar pattern. FTNT, similar again. Go through CRWD and the rest of the individual names and there are plenty shaping up together, with fantastic earnings, looking like they’re setting up to go. That’s the confirmation check passing at full marks: the strongest stocks in the strongest group of the software sector, all telling the same story.
Biotech — IBB’s move since June
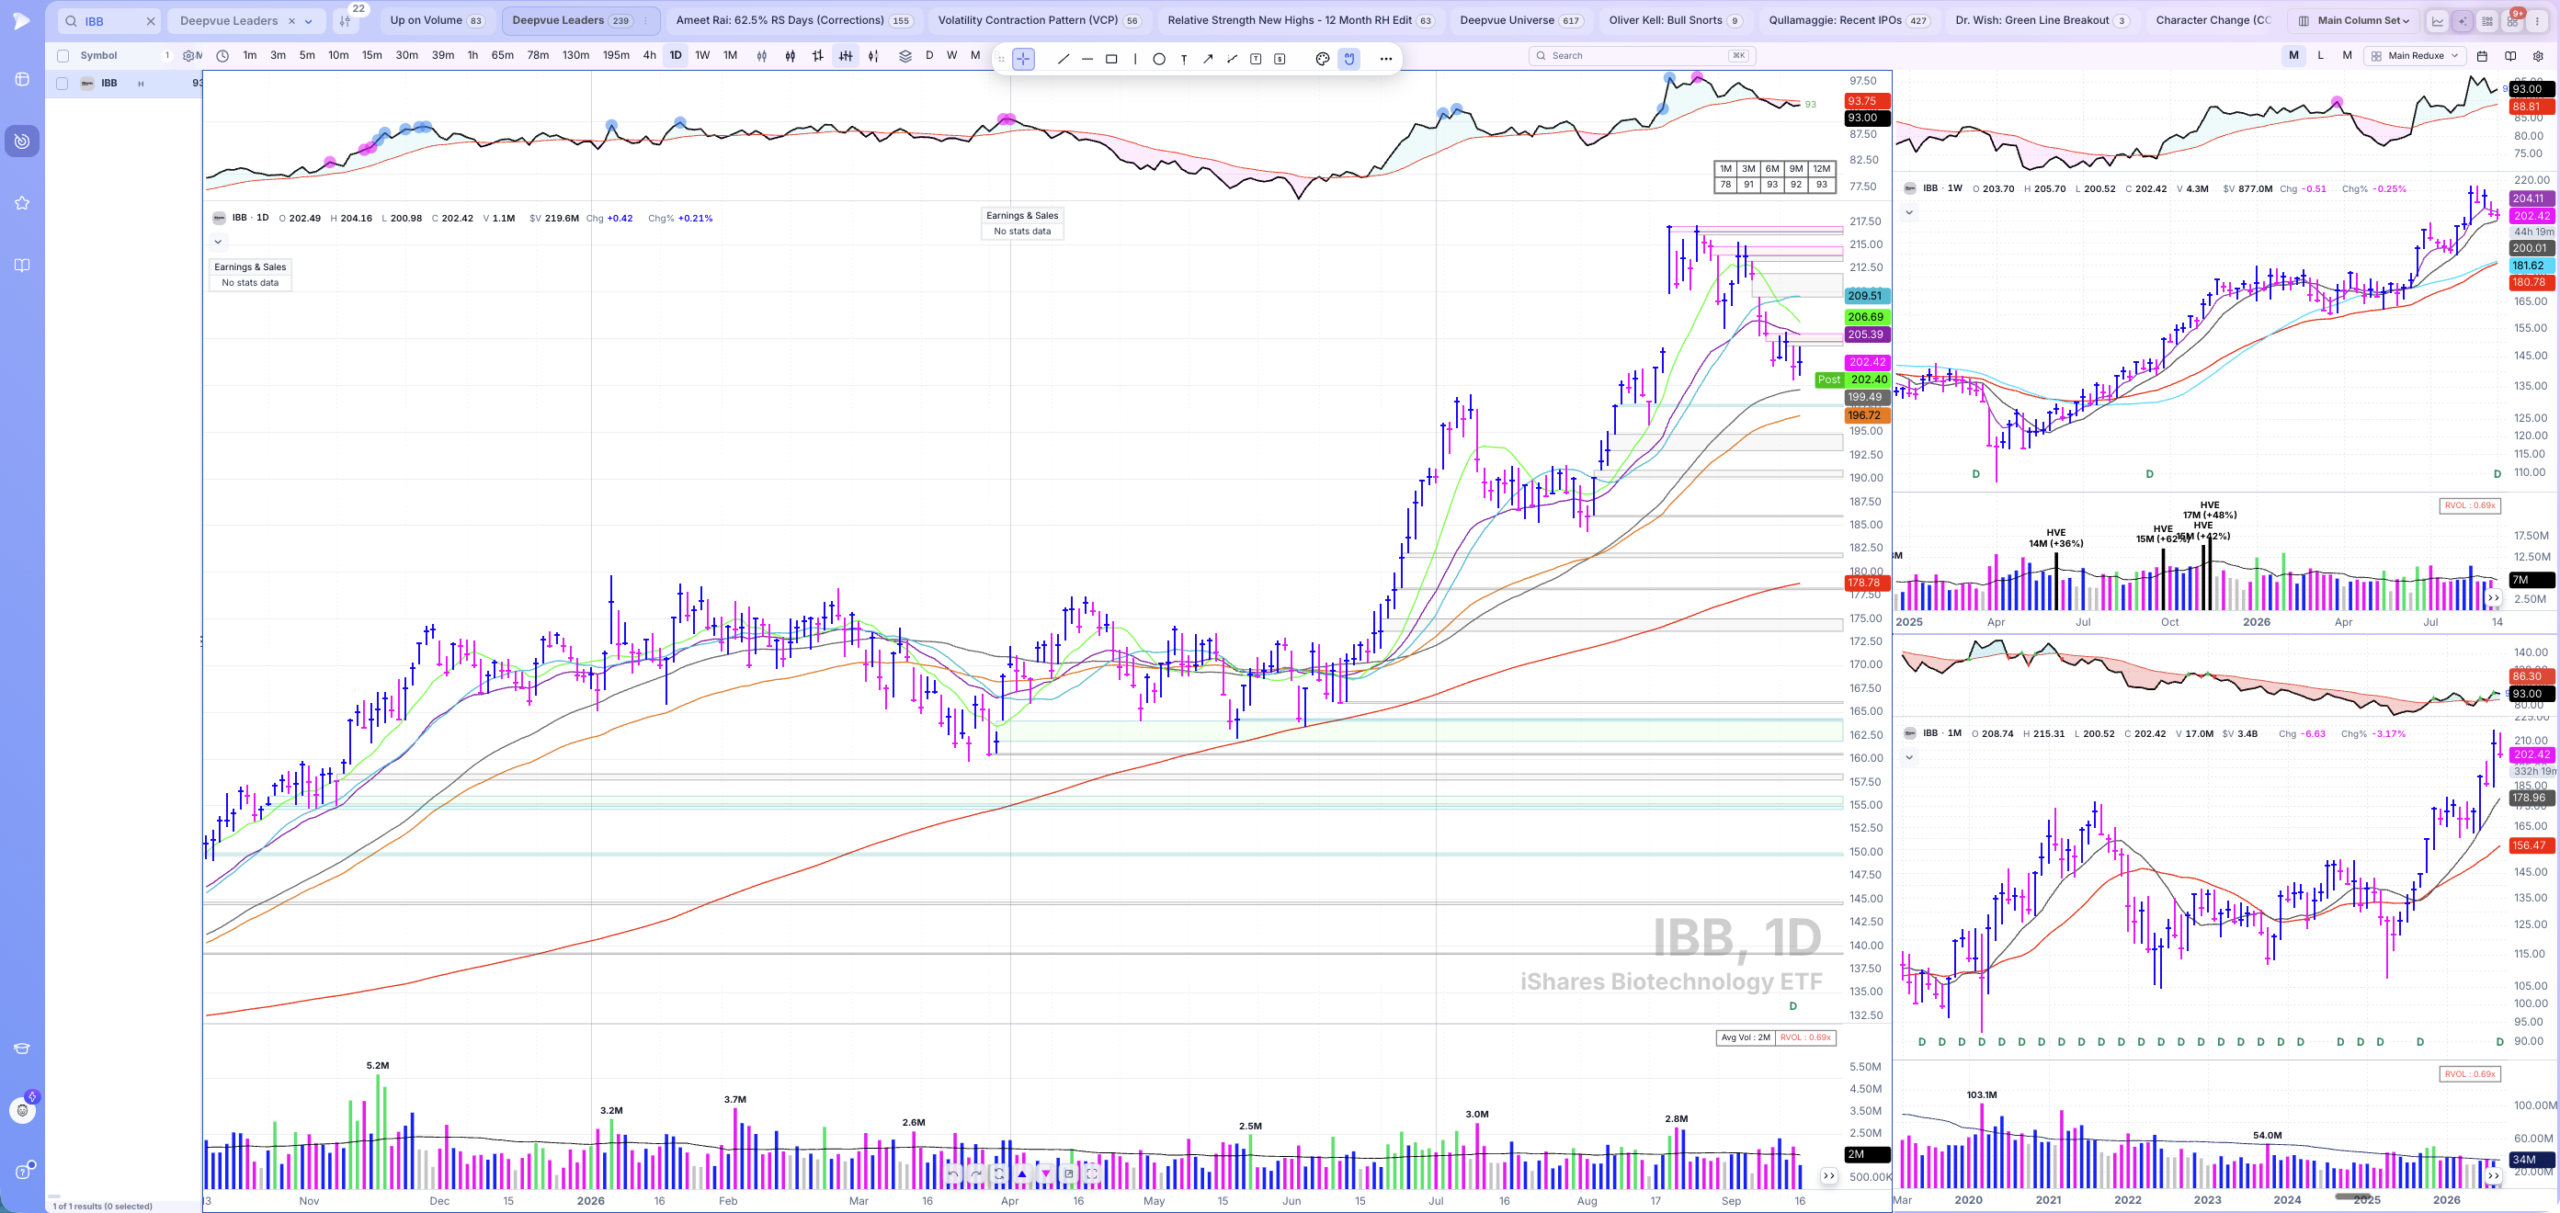
Mid-$170s in the middle of June, roughly $217 by August 19th. For a liquid ETF, that’s a group-level statement.
Biotech sits inside the larger healthcare complex, and IBB, the biotech ETF, shows you why it has my attention: from the mid-$170s in the middle of June to a high of roughly $217 by August 19th. That is quite a move in a short period of time, especially on a liquid ETF — a whole group of stocks had to pull together to print it.
MRNA — checking a leader against its group
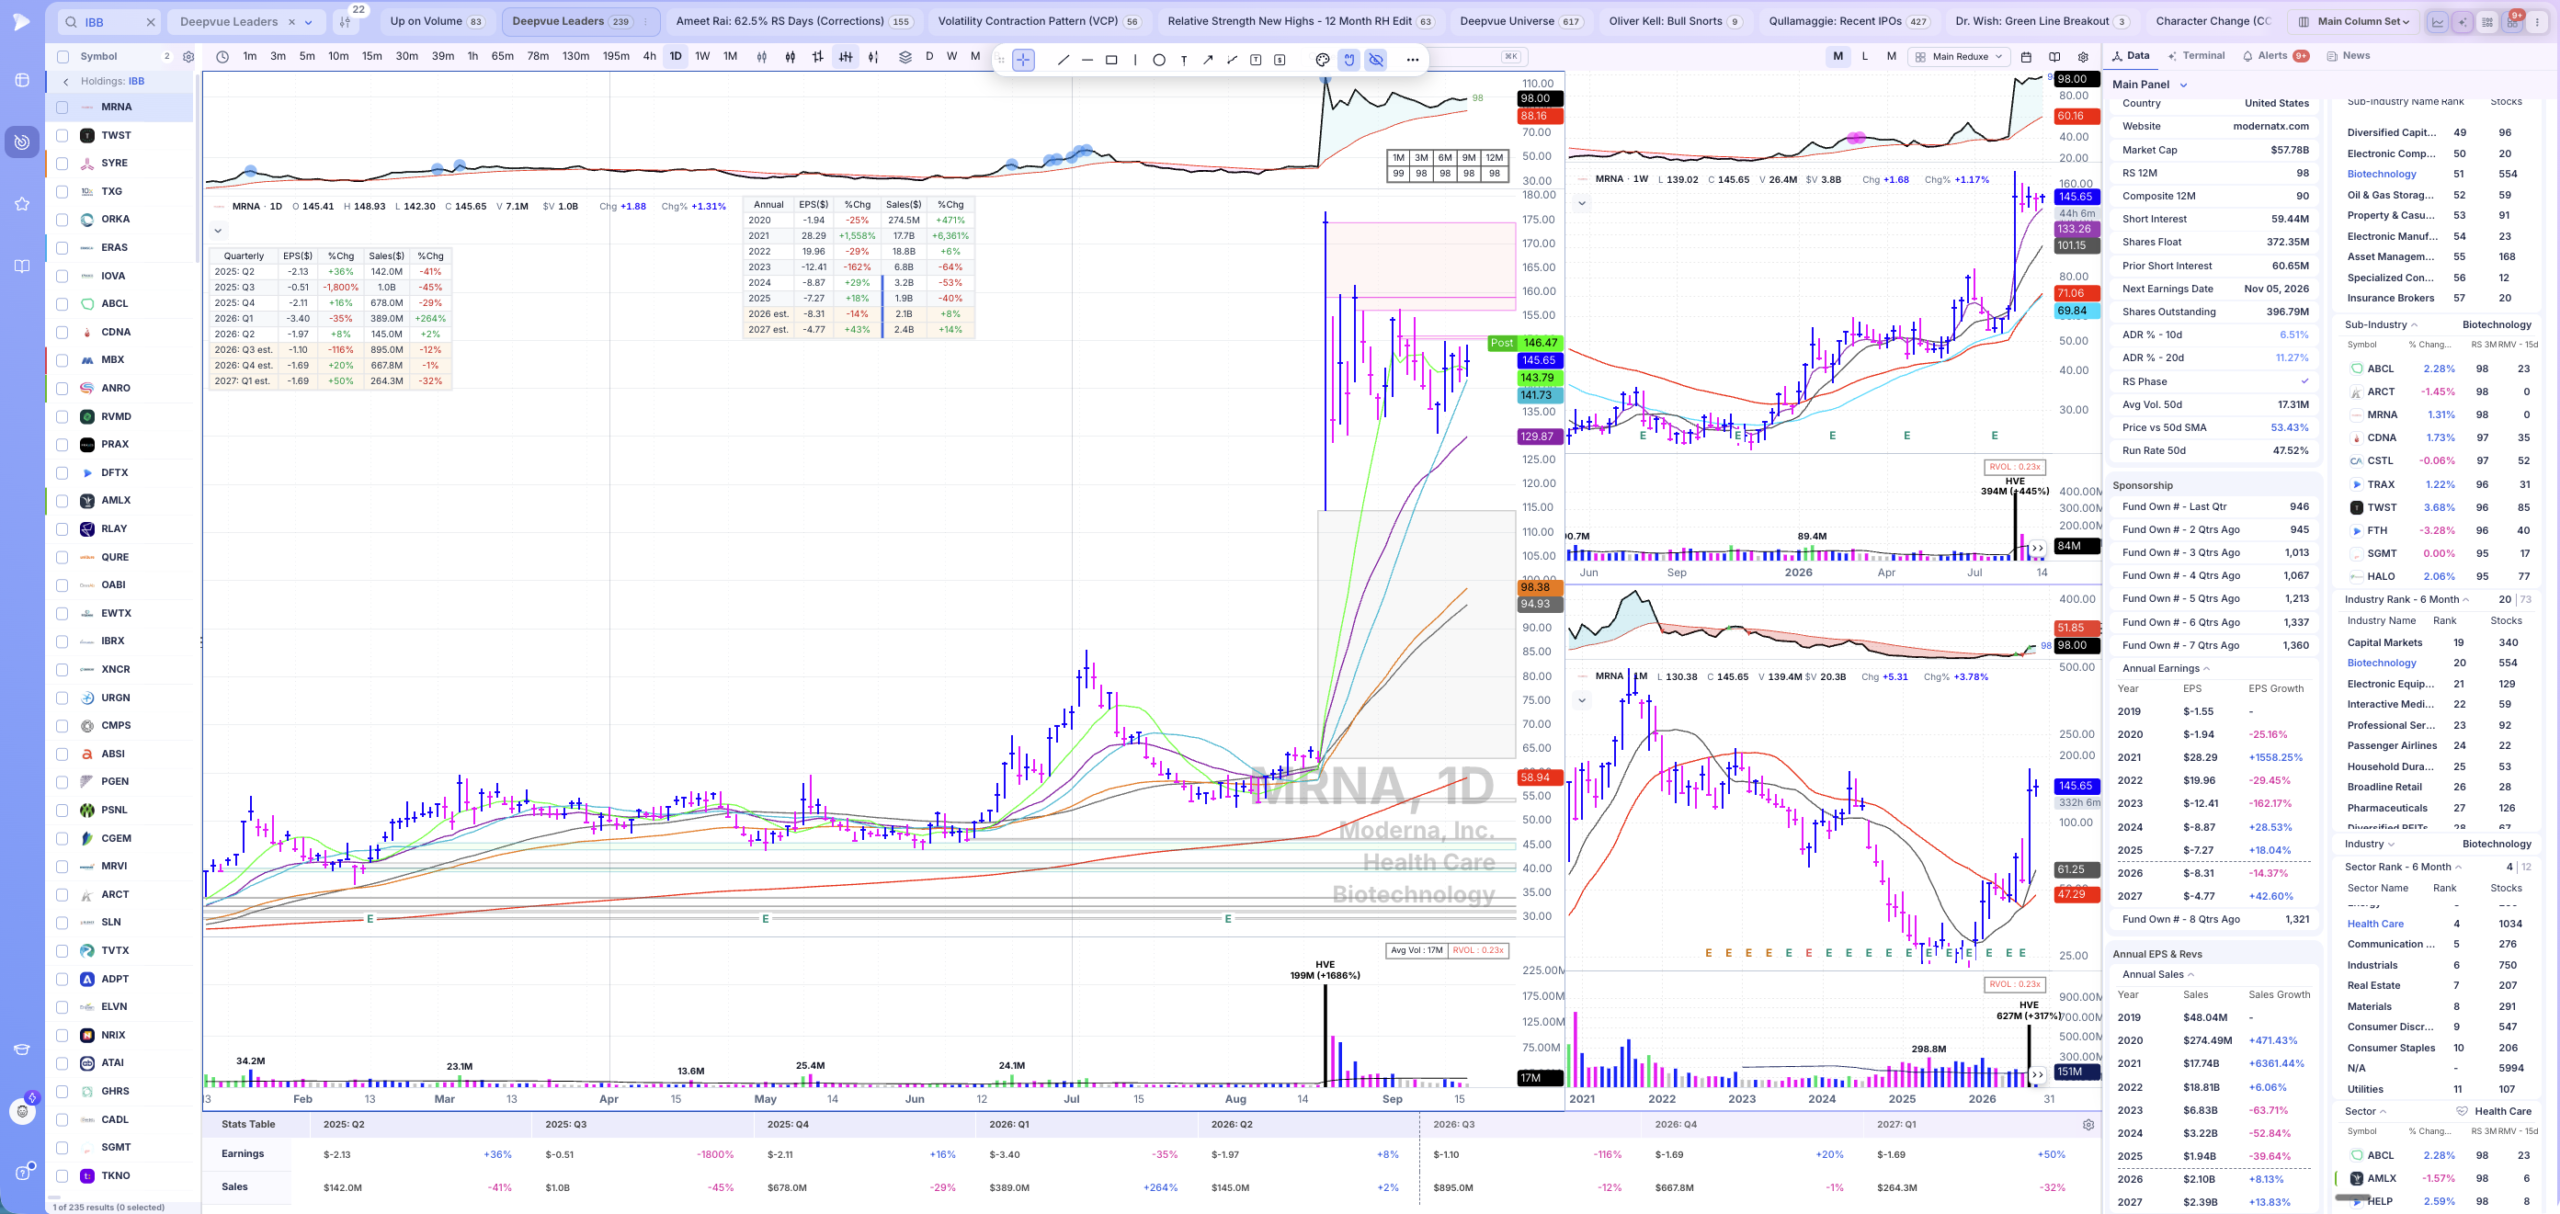
The leader is only half the evidence. The top relative strength names behind it are the other half — and here they agree.
MRNA is a big leader in the biotech group, and this is where the tooling earns its keep: in Deepvue, I can automatically pull up the top 10 highest relative strength stocks in the group, with a slight filter that keeps out the low-priced, illiquid names — because we want institutional quality. Going right through that list, it’s very easy to see the top relative strength stocks confirming the strength in MRNA. Leader plus confirmation, inside a leading group, inside an uptrending market. Every doll open, in order. That’s a stock that earns a spot on the focused watchlist.
Pro tip: Run the dolls in reverse as a warning system. If your favorite stock’s group can’t produce three or four other quality names acting well, the market is telling you the move is a soloist, not a chorus — and soloists get pulled off stage.
What to Do This Week
- Answer the first question in writing: is a sustainable uptrend in place — yes, no, or choppy? That one word sets your participation level for the week. No uptrend, no new buys; choppy, small only.
- List the leading sectors and industry groups, and label each one traditional growth or cyclical/industrial. Note how much of the leadership is growth — that ratio tells you what kind of market you’re holding.
- For each group you care about, run the confirmation check: pull the top 5 to 10 relative strength names and count how many are actually participating. Fewer than 3 or 4, cross the group off.
- Grade the base count on every confirming name — first- or second-stage bases get priority, third-stage and later get smaller expectations or a pass.
- Rebuild your focused watchlist from what survives, and set your sell stops before the entries, same as always. The dolls tell you where to look; risk management still decides what you keep.
The Dolls, Opened Twice a Week
Every issue of The TML Report runs this exact structure: where the market stands, which sectors and groups are leading, and a Focus List of 8–12 True Market Leaders from those groups — with the levels marked on every chart.
Read The TML Report