21-Day Moving Average Sell Rule: When to Sell a Stock

Ross
Ross is a co-founder of TraderLion and Deepvue. He was mentored by William O’Neil, and co-authored The Model Book of Greatest Stock Market Winners at WON + Co.
Published: August 28, 2026


Selling is harder than buying. I have been managing money for a living since 1998, and that has never changed. Buying is a decision you make with a full base in front of you and no money on the line yet. Selling is a decision you make in the middle of a move, with a profit you are attached to and a chart that is arguing with you.
For a long stretch of my career, I made that decision in the moment, which is another way of saying I made it emotionally. I would watch a winner start to crack, tell myself the fundamentals were still intact, and give it one more day. Sometimes that worked. More often than not, I rounded-tripped the whole gain, and a few times I turned a good trade into a loss. I have managed to do that plenty of times, so this is not theory.
What fixed it was taking the decision away from myself and handing it to a line. In growth systems like CANSLIM®, the second consecutive close below the 21-day SMA is the standard defensive sell signal, and it is the same line I first started paying attention to when I was working with Bill O’Neil. It is not a magic number. It is a place to stand.
Ross Haber
Every new post, straight to your inbox
If this was useful, the next one will land in your inbox the day I write it.
Why the 21-Day Moving Average Sell Rule Matters
Early in my career, I sat next to a colleague in William O’Neil’s institutional sales department, whose client ran a billion-dollar fund. Harvard people, all of them, and genuinely smart. In 2000, Bill made it very clear that it was time to sell. They kept buying all the way down because they still believed in the fundamentals. They were wiped out.
The arithmetic is what makes that story matter. Lose 7%, and you need 7.5% to get back to even. Lose 30%, and you need 43%. Lose half, and you need to double. That gap is the entire reason for having a mechanical exit at all, and it is why I treat risk management as the thing that produces gains over time rather than the thing that limits them. Don’t lose money. Everything else is downstream of that.
A rule also does something a good instinct cannot: it works when you are scared. The hardest sell is the one you have to make on a winner that has already run a long way, when you are watching for a possible climax, and you know you will never pick the top. With a line in the sand, there is no thinking to do. You are not going to sell the top tick. You will get close, and you will be surprised how comfortable you are with the exit once you see the stock lose its stage structure underneath it.
The trade-off, stated up front. This rule will take you out of stocks that immediately turn around and go higher. That is the cost of it. You pay that cost in exchange for never sitting through the slide that takes a 40% gain back to zero, and over a career the exchange is heavily in your favor.
What the Second Consecutive Close Below the 21-Day SMA Tells You
Stocks in a strong uptrend pull back to the 21-day constantly. It is completely normal for a leader to trade below that line intraday, or even close slightly below it for one day, and then have institutions step back in the following morning. If you sell on the first close below, you will be shaken out of good stocks over and over.
Waiting for the second consecutive close is what separates the shakeout from the breakdown. One close is a dip. Two closes mean the stock has been offered for two full sessions, and no one with size stepped up to defend it. That is the tell.
Once a stock starts living below the 21-day, the medium-term trend has shifted. Above that line, the trend is healthy, and momentum favors the bulls. Two closes below, and the stock has failed to reclaim intermediate support, which moves it from healthy to cracking and often into a defensive phase for a while. This is usually the first visible sign that institutional accumulation has turned into institutional distribution.
The 50-day SMA is the second line, and for me it is the final one. A second consecutive close below the 50-day means the longer-term structure is broken. At that point, I am not trimming; I am exiting, and I start looking closely at everything else I own in that group.
Two lines, two different actions
- Second close below the 21-day SMA — sell a third to half on an early-stage leader, or the entire position if the situation is late or weak.
- Second close below the 50-day SMA — exit. The longer-term trend is gone, and I get defensive across the whole group.
What I Look For Before I Use This Rule
Personality is everything here, and it is the part most people skip. This rule applies to a specific kind of stock: highly liquid, institutional-quality leaders that trade in tight ranges, move in an orderly manner, and have a visible history of respecting key moving averages.
So look to the left before you commit to the line. Go back over the last several months and find the moving average the stock has actually been respecting. Some names respect the 21-day SMA. Some prefer the 23 EMA. Some hug the 10-day for stretches of a strong trend. For stocks like these, it often makes sense to sell part on the second close below the 10-day and then the rest on the second close below the 21-day SMA. Whichever lines the stock has been honoring are your lines in the sand, not the one you prefer.
Pro tip. If a stock has a double-digit 20-day average daily range and whips all over the place, a few closes below the 21-day SMA is just an ordinary week for it. Do not run this rule on that stock. You will get chopped to pieces and blame the rule.
What It Looks Like When It Fails
Here is how you will be wrong. You sell on the second close; the stock finds support at the 50-day, reverses, then gaps up and breaks out again. You are now watching a name you owned make new highs without you. It happens, and it will happen to you. It’s only a matter of time.
Situational awareness is what limits the damage. If a stock is early in a market cycle, coming out of a first, or second-stage base, is one of the strongest names in a group moving together, and this is its first pullback from the 21-day to the 50-day, I only sell a third to a half. I keep the rest and let it show me strength at the 50-day. More often than not, I then buy back a little more than I sold once that support holds. If you run through base counts before sizing up, you will usually know which situation you are in.
Five Charts From 2026
All five of these had a substantial move higher before the second close arrived. That is the normal setup for this signal — it fires on winners, which is exactly why it is hard to obey.
SMH — VanEck Semiconductor ETF
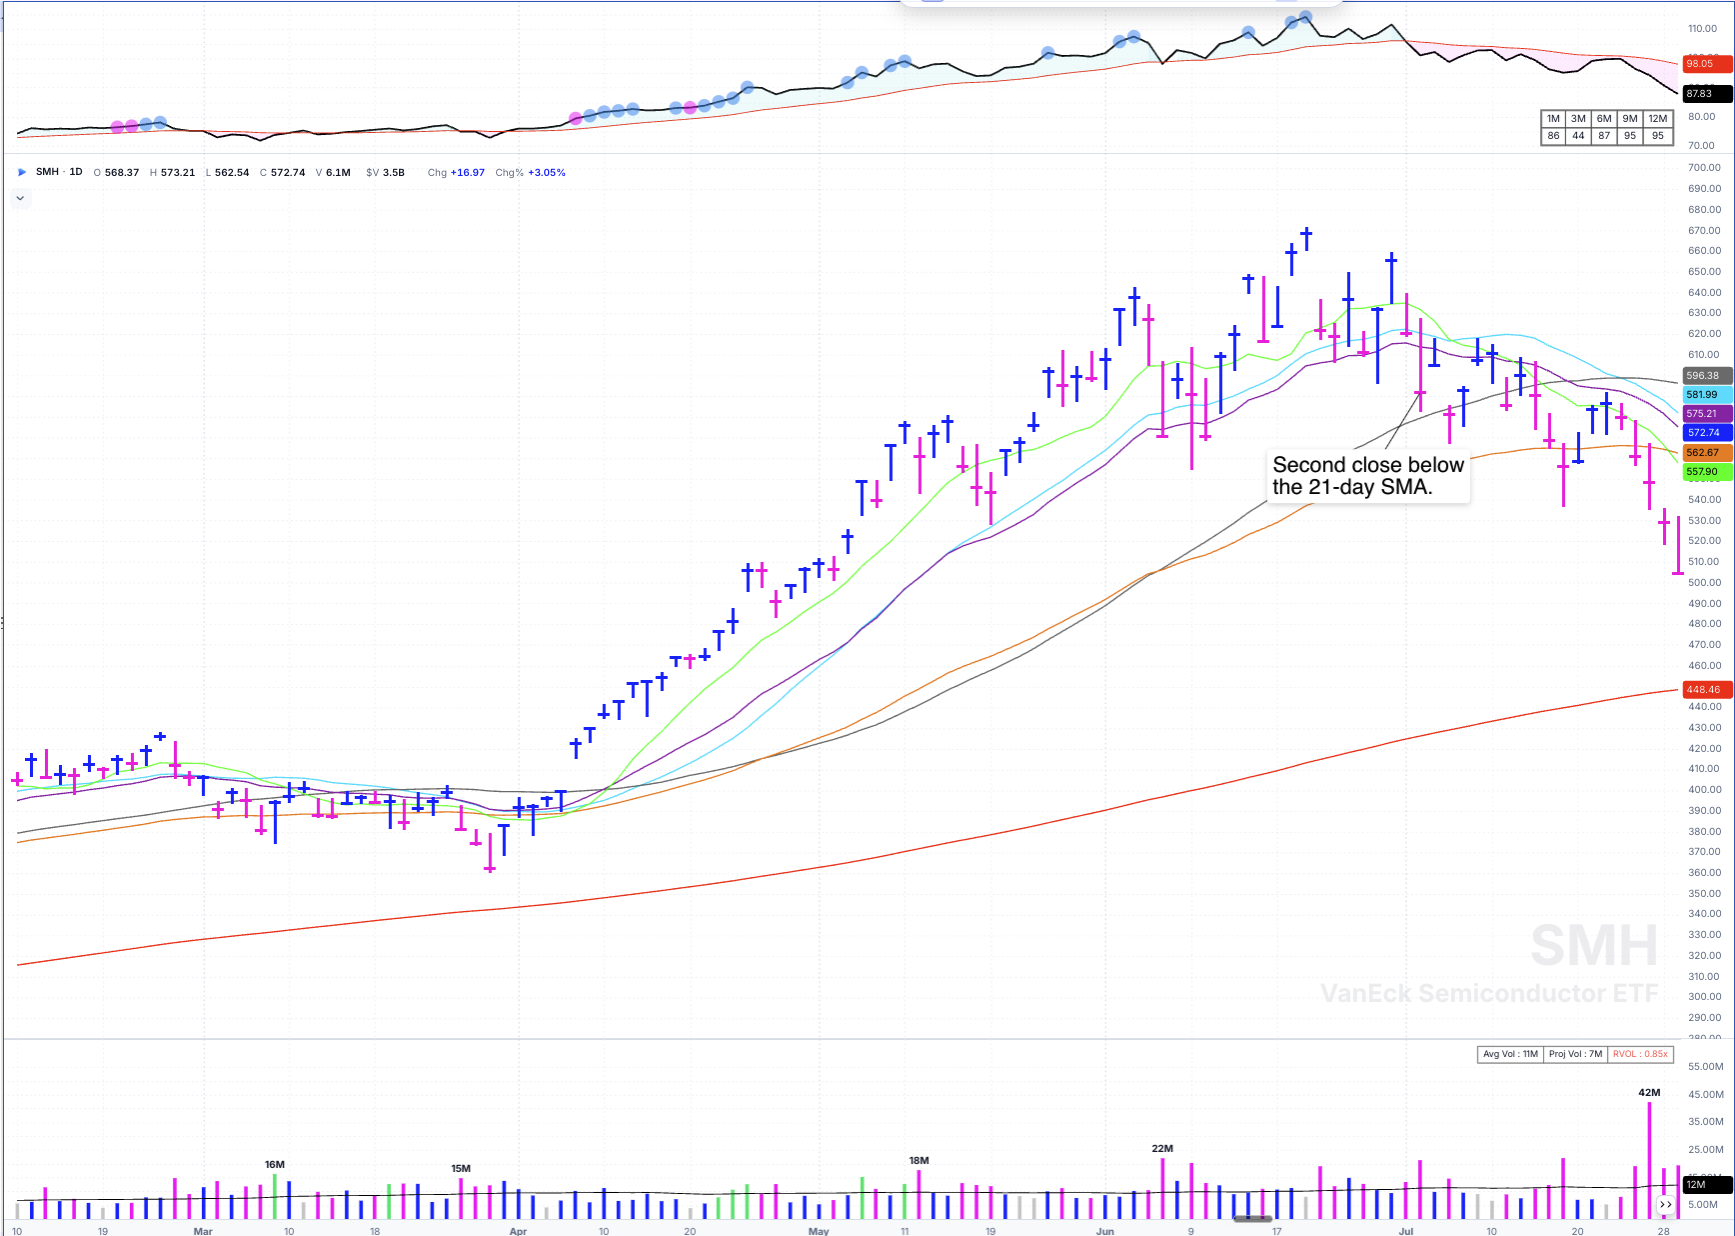
The rally back stalls right at the 21-day. It never reclaims it.
Looking at SMH from late February 2026 through July 29, 2026, the second close below the 21-day SMA came on July 2 around 591. What happened next is the pattern you want to memorize: the ETF rallied back, found resistance at the 21-day, failed there, and rolled over. By July 29 it was working toward 500. Selling on July 2 was not the top. It was the difference between a clean exit and a month of hoping.
SNDK — SanDisk
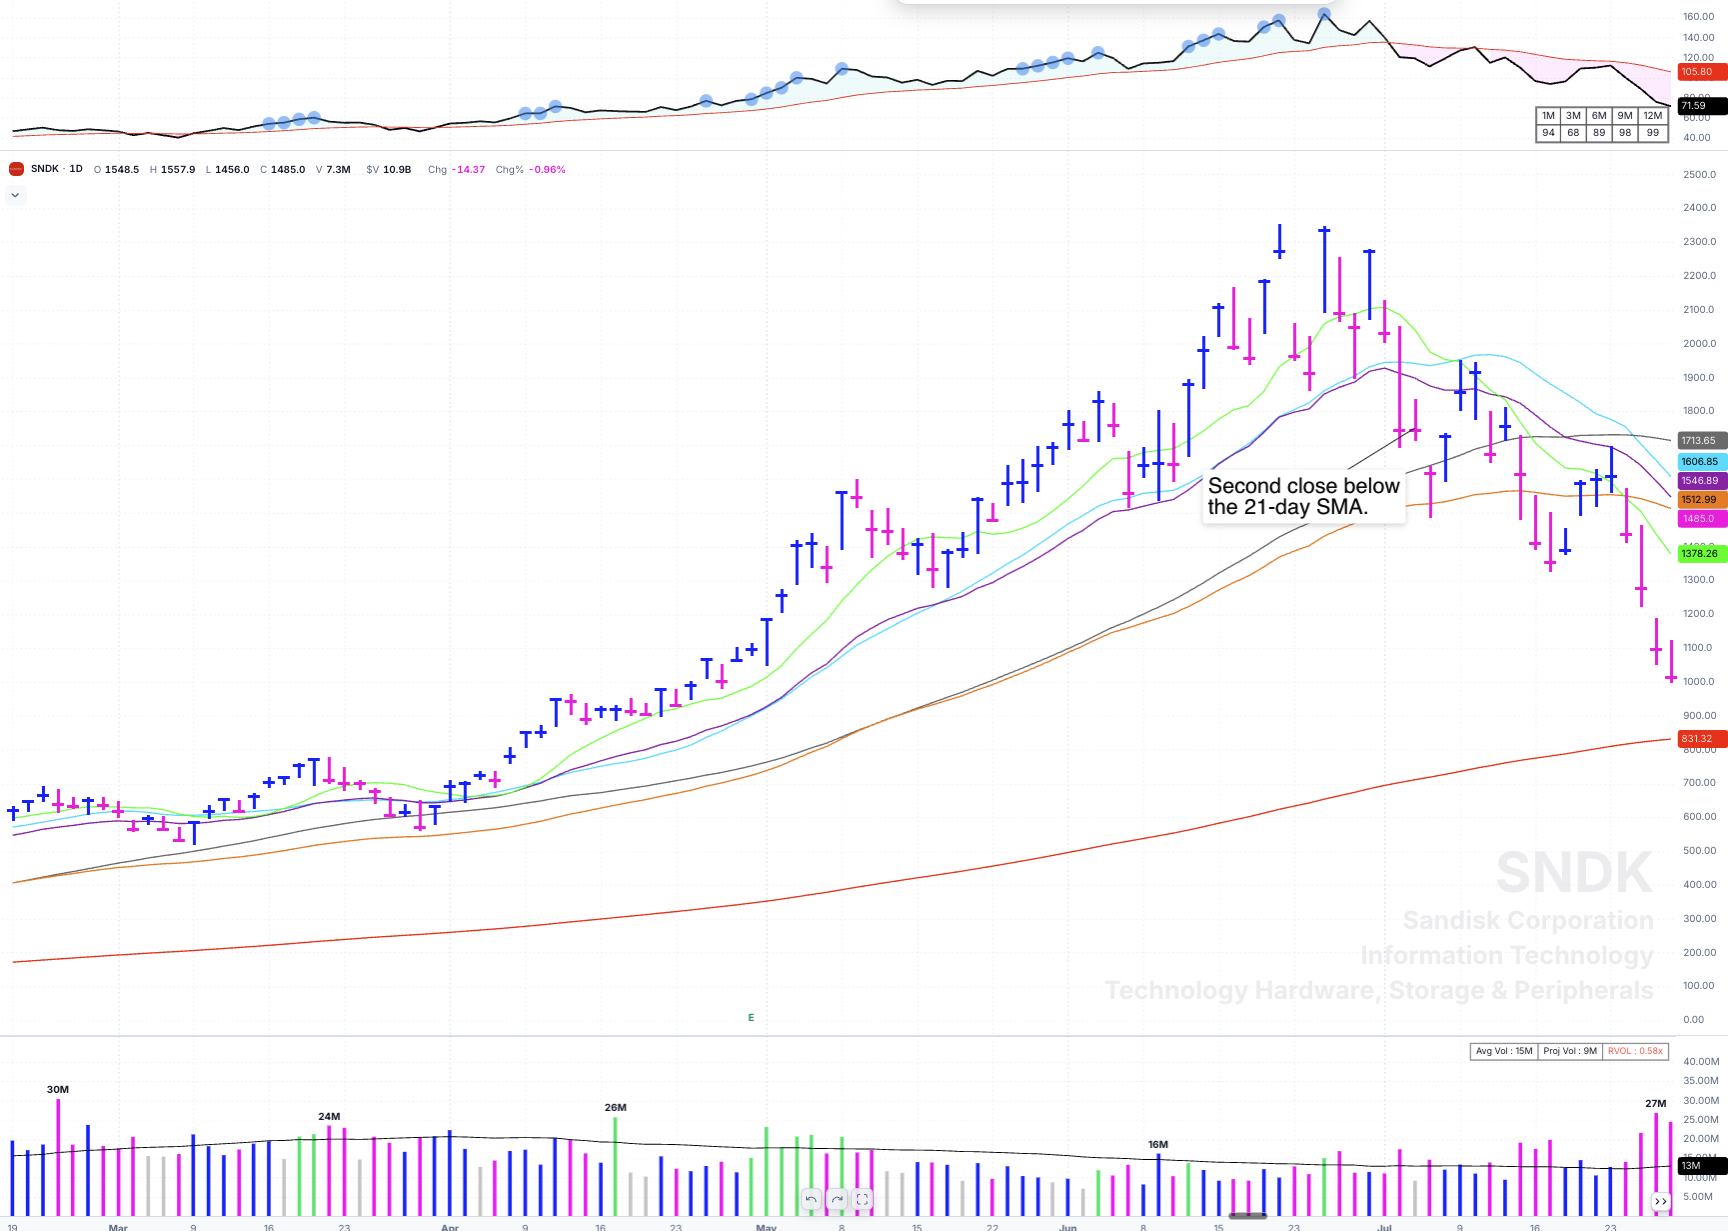
Same shape as SMH, much steeper slide underneath it.
Same window, February 18 through July 29, 2026. SNDK’s second consecutive close below the 21-day landed on Monday, July 6, 2026, with the close at 174.40. It rallied back to the underside of the 21-day, where the line stops being support and starts being resistance, then rolled over. Twenty-three sessions later, on July 29, the stock was near 100. That is the landslide the rule exists to keep you out of.
DELL — Dell Technologies
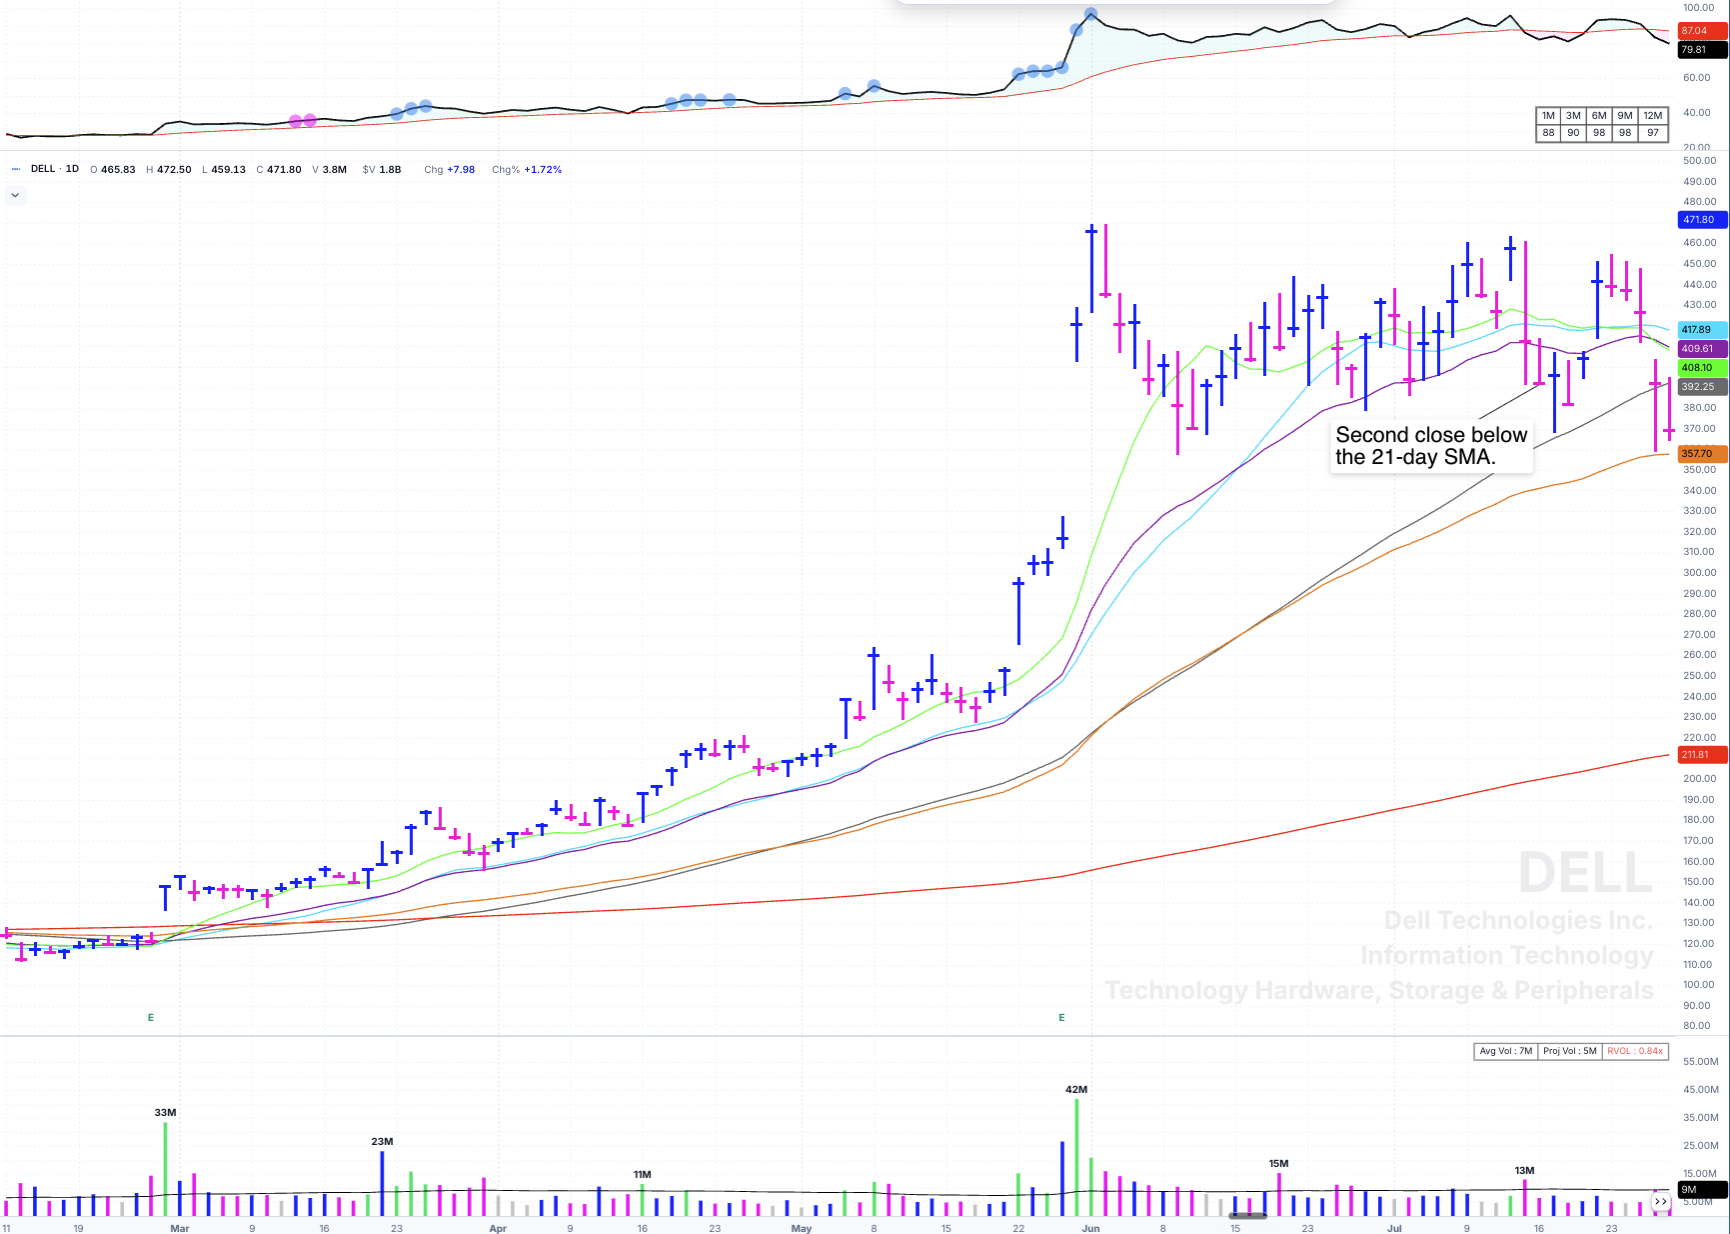
The one that gives some of it back, and still leaves you better off.
I am including DELL because it is the honest example. From February 17 to July 28, 2026, the second close below the 21-day came on July 16 near 392.50. The stock then dropped to a low around 357 and bounced all the way back above the 50-day near 389 — right about where the rule took you out. On paper you gained nothing.
Then on July 28 it gapped down and fell straight through the 50-day. That is a day it would have been very hard not to panic out of at the worst possible price, and you were already flat. DELL has since been chopping around, building a new base and going essentially nowhere, while better stocks were available to own. Even in the case where the rule looks like it did nothing for you, it did.
CSCO — Cisco Systems
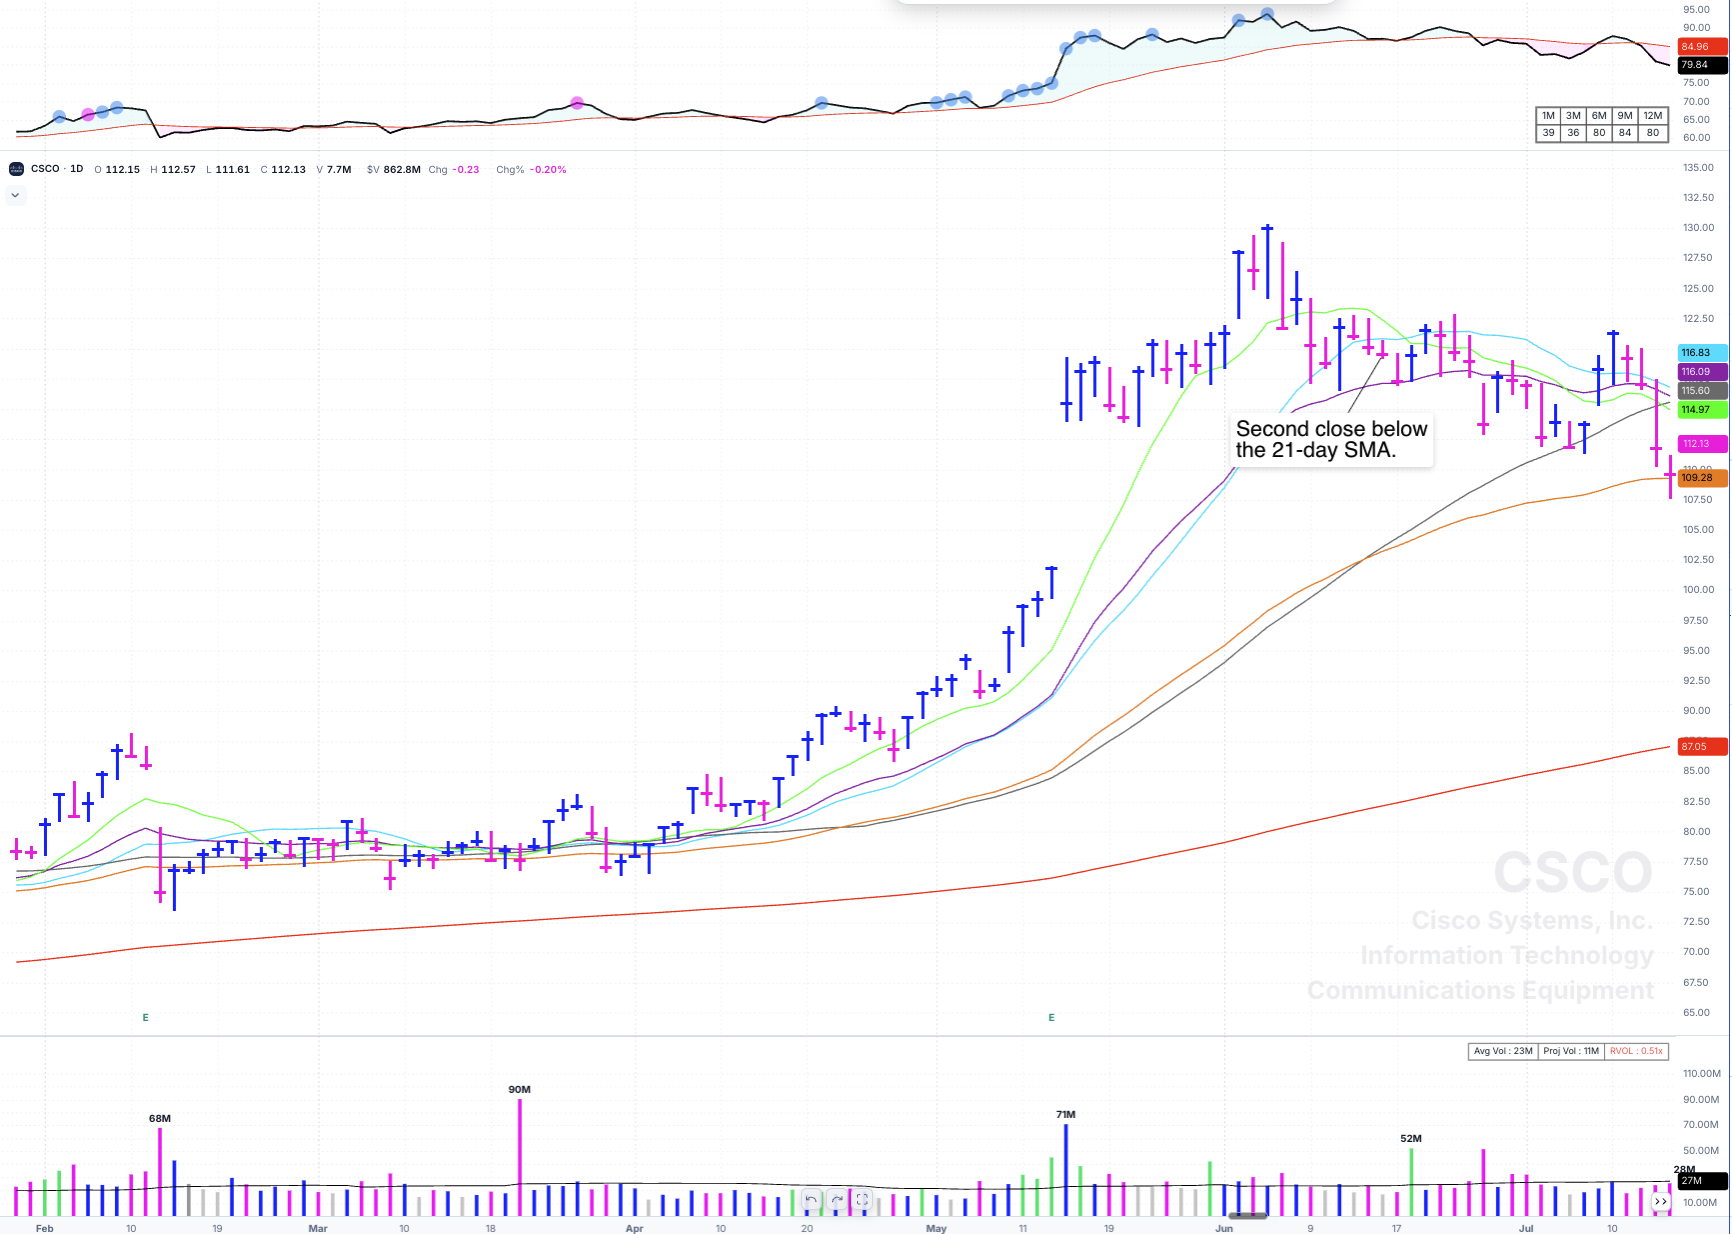
Below the 50-day, then reaching for the 65 EMA. Nothing to do here.
CSCO from February 4 through July 16, 2026. The second close below the 21-day SMA hit on June 16, 2026, at 119.57. A month later, the stock was on its second close below the 50-day and trying to find support at the 65 EMA, with a low of 107.53 underneath it. Watch what that does to you if you are still holding: the stock is rolling over below two major averages, the drawdown is real, and controlling your emotions there is close to impossible. Sold on June 16, you have missed nothing. CSCO is still living below declining moving averages.
OXY — Occidental Petroleum, and the 23 EMA Exception
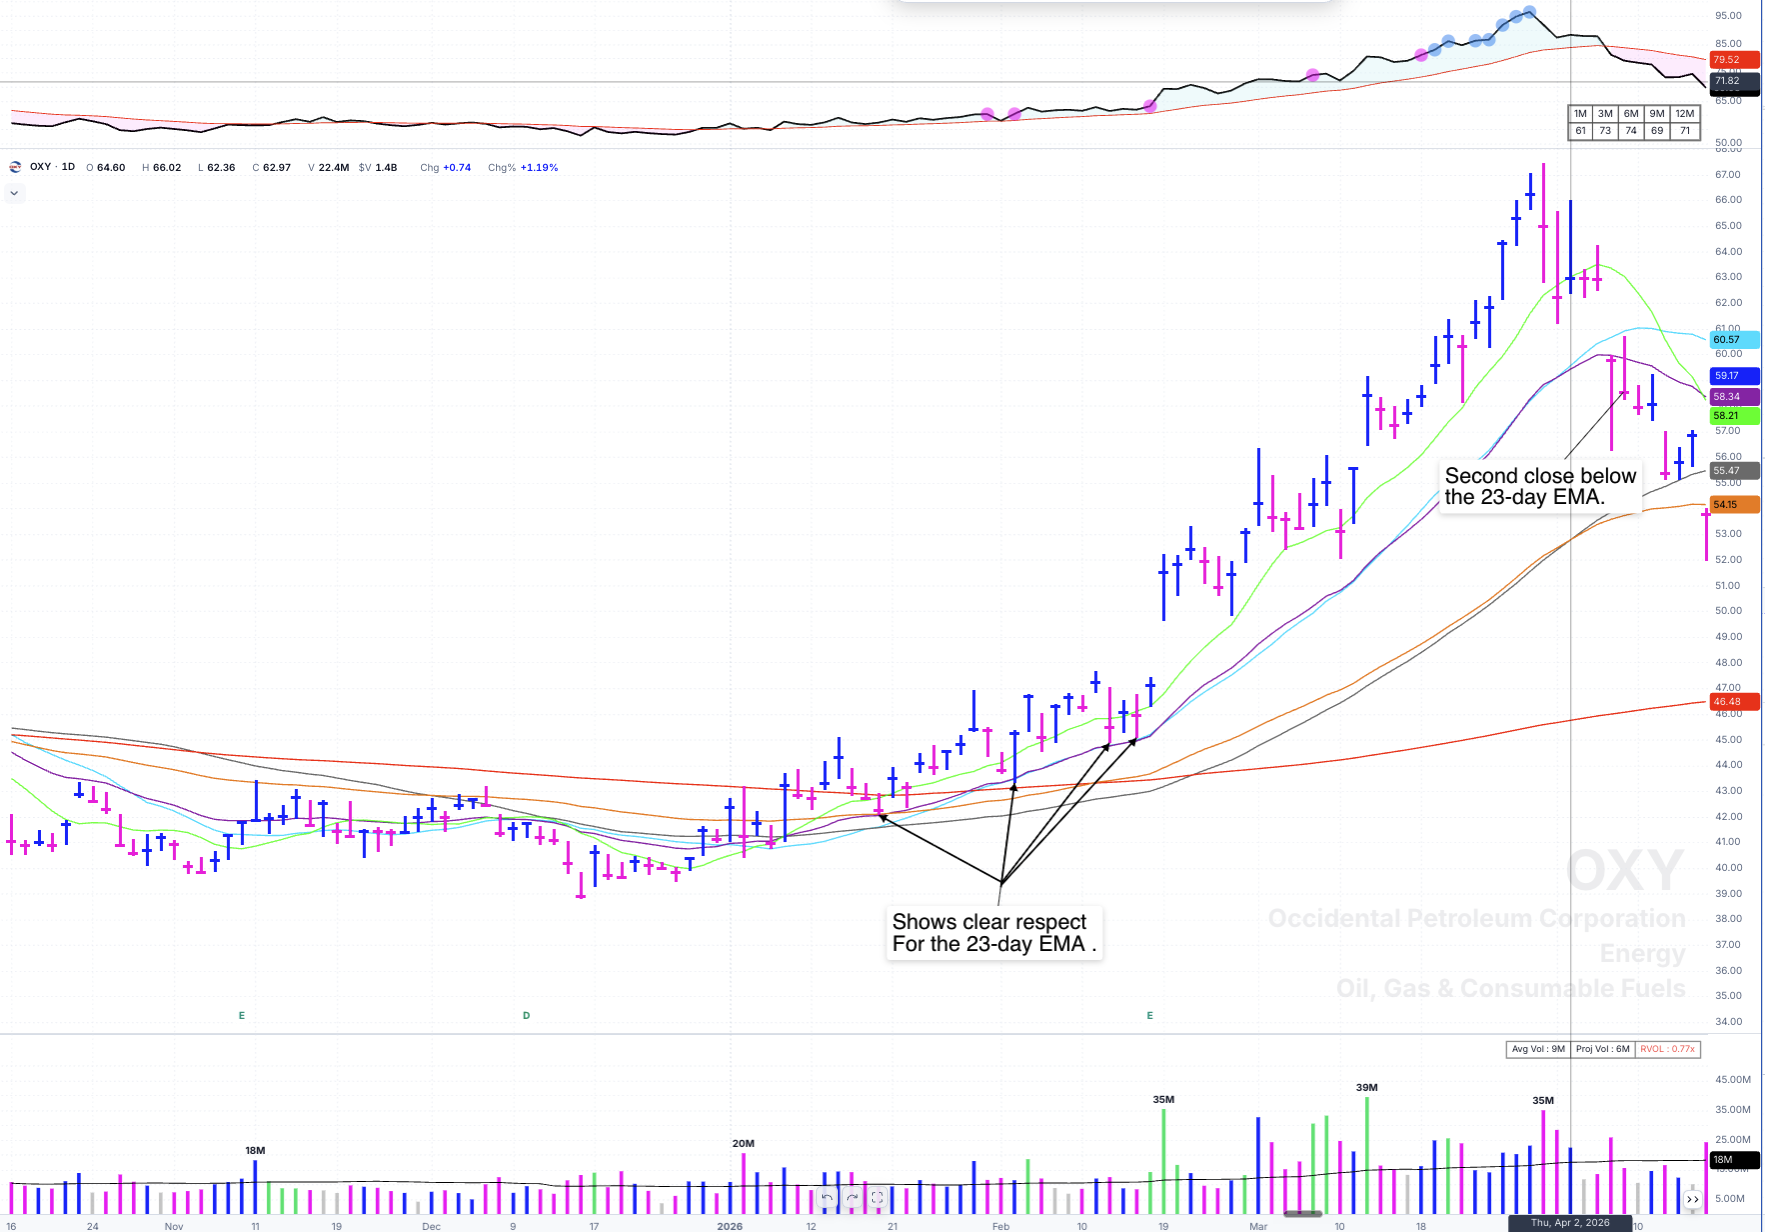
Four clean touches to the left. That is how you know which line to use.
This is the example I wanted most, because OXY does not respect the 21-day SMA. It respects the 23 EMA. You can prove it by looking to the left: January 20, February 3, February 12, and February 17, 2026 all show clear support at that line. Four touches are not a coincidence; they are a personality.
So on this name I watched the 23 EMA instead. The second close below it came on April 9, 2026 at 58.53, after a run that had topped near 67. On April 17, the stock gapped down and hit 51.96 — another one of those gaps that shakes out everybody who was still holding and hoping. By early July, it was around 47. It has since rallied and is building the right side of a new base, and it may well break out again. That is fine. You will be there for it with a full account instead of a damaged one.
How to Set Your Sell Stop This Week
- Pull up every open position and go back six months on each chart. Write down which moving average the stock has actually been respecting — 10-day, 21-day SMA, 23 EMA. That is its line, not your preference.
- Check the 20-day average daily range on each name. If it is in double digits, this rule is not the right tool for that stock, and honestly that stock may not belong in a concentrated position at all.
- Write the exit down before you need it, in one sentence per position: “Second consecutive close below the 21-day SMA, sell half.” Deepvue’s guide to selling with moving averages is a good place to check your logic against.
- Decide the situation now, not later. The first pullback in an early-stage leader within a strong group is a trim. A late-stage name after a long run is the whole position.
- Mark the 50-day SMA on every chart as your second line, and set the same two-close condition on it.
- Run your screen this weekend and check the replacements. If you sell something, the point is not to hold cash forever. Sort by relative strength and see what is actually working. Twenty minutes once a week is enough, as long as you do it every week.
- Go back through your last five sells. How many were on a rule, and how many were on a feeling? That number will tell you more about your next year than any fundamental screen will.
The TML Report
Twice a week I put the market overview and my focus list on the page — indexes first, then the names I am actually watching, with the lines drawn on the charts. Two written reports a week, a short video on Saturday, the full archive, and a monthly live session where you can ask me about any name on the list.
Frequently Asked Questions
CAN SLIM® is a registered trademark of O’Neil Capital Management, Inc. (U.S. Reg. No. 3,081,940). TraderLion is not affiliated with, sponsored by, endorsed by, or licensed by O’Neil Capital Management, Inc., Investor’s Business Daily, MarketSurge, or their affiliates. Any reference to CAN SLIM® is for descriptive purposes only.