Cycle Of Price Action

Oliver Kell
Oliver Kell is a champion trader who achieved an impressive 941% return by winning the 2020 U.S. Investing Championship. With years of active trading experience, Oliver has developed strategies that thrive in both uptrends and downtrends.
Published: September 10, 2024


Overview of the Cycle of Price Action
Oliver Kell, a champion trader who made a staggering 941% return in the 2020 U.S. Investing Championship, has developed a trading system that cuts through the noise of earnings reports, news, and rumors. His Cycle of Price Action strategy focuses on technical analysis, helping traders identify price trends based on accumulation and distribution signals on stock charts.
This strategy thrives in both uptrends and downtrends, offering a clear blueprint for finding high-potential stocks and identifying low-risk entry points.

Now, let’s cover each step in the cycle:
What Is the Reversal Extension?

At the bottom of the cycle is a general capitulation called a Reversal Extension. Fear takes over, and people finally sell, no longer able to withstand the pain of loss.
Using multiple time frames, we look for a definitive support level on a higher time frame. The lower time frame will become extended and then snap back up into the moving averages.
This volatile action should be accompanied by heavy volume and is used more as a sign that a trend reversal may occur. The lower-risk entry occurs in a few trading sessions and will help reduce risk as the price tightens.
Symbol: ELF
Company: e.l.f. Beauty
Year: 2023

Click on the chart above to make it bigger.
The Wedge Pop: Finding the Money Pattern

The Wedge Pop is the first point where a stock rallies back through its moving averages after a Reversal Extension. After the initial bounce off the low, the price often drifts sideways or slightly downwards. This phase is critical for spotting relative strength against market indices.
When price and moving averages tighten, a pivot forms. A break above short-term resistance and a reclaiming of the moving averages offers a clear entry point with well-defined risk. At this point, traders can start riding the trend as the stock climbs higher.
Symbol: NVDA
Company: NVIDIA
Year: 2023

EMA Crossback: The Next Key Signal

After the Wedge Pop, the stock often tests its moving averages again, known as the EMA Crossback. During this stage, the price consolidates into the moving averages, and traders wait for supportive buying action before adding to their position.
This second entry point helps build a position early in the price cycle, allowing for a longer hold if the stock continues trending upward.
Symbol: TOL
Company: Toll Brothers
Year: 2023

Base n’ Break: Riding the Trend

The stock will now begin to move sideways allowing moving averages to catch up. You will begin to notice these tight basing patterns are defined within just a couple of weeks.
The Base n’ Break occurs multiple times and can develop within the structure of a base before a “traditional” buy area, align with a breakout on a higher time frame, or after a tight flag formation as it continues to make new highs.
The moving averages continue to support the trend. We continue to look for positive price action and higher lows, allowing us to raise our stops in a trailing format.
Symbol: WING
Company: Wingstop
Year: 2023

Click on the chart above to make it bigger.
Exhaustion Extension: When the Trend Ends

The Exhaustion Extension signals the end of an uptrend. This euphoric blowoff action extends the price well above the moving averages on both the higher and lower time frames.
We can look to the higher time frames to verify the lower time frame signals. The price extends far off the moving averages, then reverses lower as more selling pressure appears.
The further you get into an uptrend, the more extensions from the moving averages you will see, indicating the stock may be due to form another base or has topped. In some cases, stocks will stop advancing without exhaustion, and we will see a tightening of price, followed by a wedge drop.
Symbol: AFRM
Company: Affirm Holdings
Year: 2023

Wedge Drop: Confirming the Downtrend

After the Exhaustion Extension, the price will trade tight into the moving averages as there are now fewer new buyers.
The Wedge Drop confirms the reversal when the price falls through the moving averages with an influx of sellers.
The Price Cycle is confirmed and a new downtrend begins. The stock needs time to form a new base as it consolidates the previous uptrend or has finally topped.

EMA Crossback Downside: Spotting the First Rally in a Downtrend

Price has now lost the moving averages but is trying to rally for the first time into the declining moving averages. Like an EMA Crossback to the upside, an EMA Crossback to the downside will retest the moving averages but is now met with more resistance, pushing the stock lower.
We now see resistance forming, and the stock continues its downtrend. When resistance is found and more sellers show up, the stock will snap back downward.
Base n’ Break Downside: Continuing the Decline

Price will continue to build small basing patterns as it cycles downward. Like the Base n’ Break to the upside, the Base n’ Break to the downside will trade sideways into the declining moving averages.
The moving averages now act as resistance, sending the stock lower.
Eventually, we will see a Reversal Extension, which will restart the Cycle of Price.
Symbol: PHM
Company: Pultegroup
Year: 2023

Click on the chart above to make it bigger.
Oliver Kell’s Trading Approach: Price and Volume Lead the Way
First, Oliver looks for the strongest game-changing growth stocks with the biggest increase in earnings and sales. Price and Volume, however, guide his decisions.
The foundation of everything revolves around price action. Clean and simple charts help us focus on this number one indicator.
The stock market goes up when there are more buyers than sellers and goes down when there are more sellers than buyers. It’s that simple.
Volume confirms the price action. We look for volume to confirm price movement at the beginning of a cycle, as a stock moves through a pivot, and when the stock reverses. Volume = Price, Cause = Effect.
Moving Averages follow price and show the direction of the trend. They are a secondary indicator that helps act as a visual to watch when price forms a pivot.
- 10 and 20-day exponential moving averages guide us through the intermediate-term trend
- 50 and 200 simple moving averages help us stay in tune with the longer trend
Multiple Time Frames
Kell uses multiple time frames to confirm price action.
- Weekly charts offer the bigger picture.
- Daily charts help manage trades.
- Hourly and 15-minute charts are for timing entries.
Lower time frames cause overtrading – Look at the bigger picture to plan your trade, then utilize the lower time frame to execute the trade.
Putting it all together
The first step in mastering the Cycle of Price Action is focusing on the right stocks with strong growth potential. Use shifts in momentum to enter at the optimal time and manage your risk with proper position sizing and stop-losses.
Maximize profits by understanding where you are in the current price cycle.
Understanding where a stock is in its price cycle allows you to minimize losses and maximize profits. Stay patient at the start of a cycle, but be quicker to lock in profits later on. If a stock tops and starts to decline, step aside and let the cycle reset before jumping back in.
By following Oliver Kell’s Cycle of Price Action, you can stay in sync with the market, reduce risk, and make smarter trading decisions.
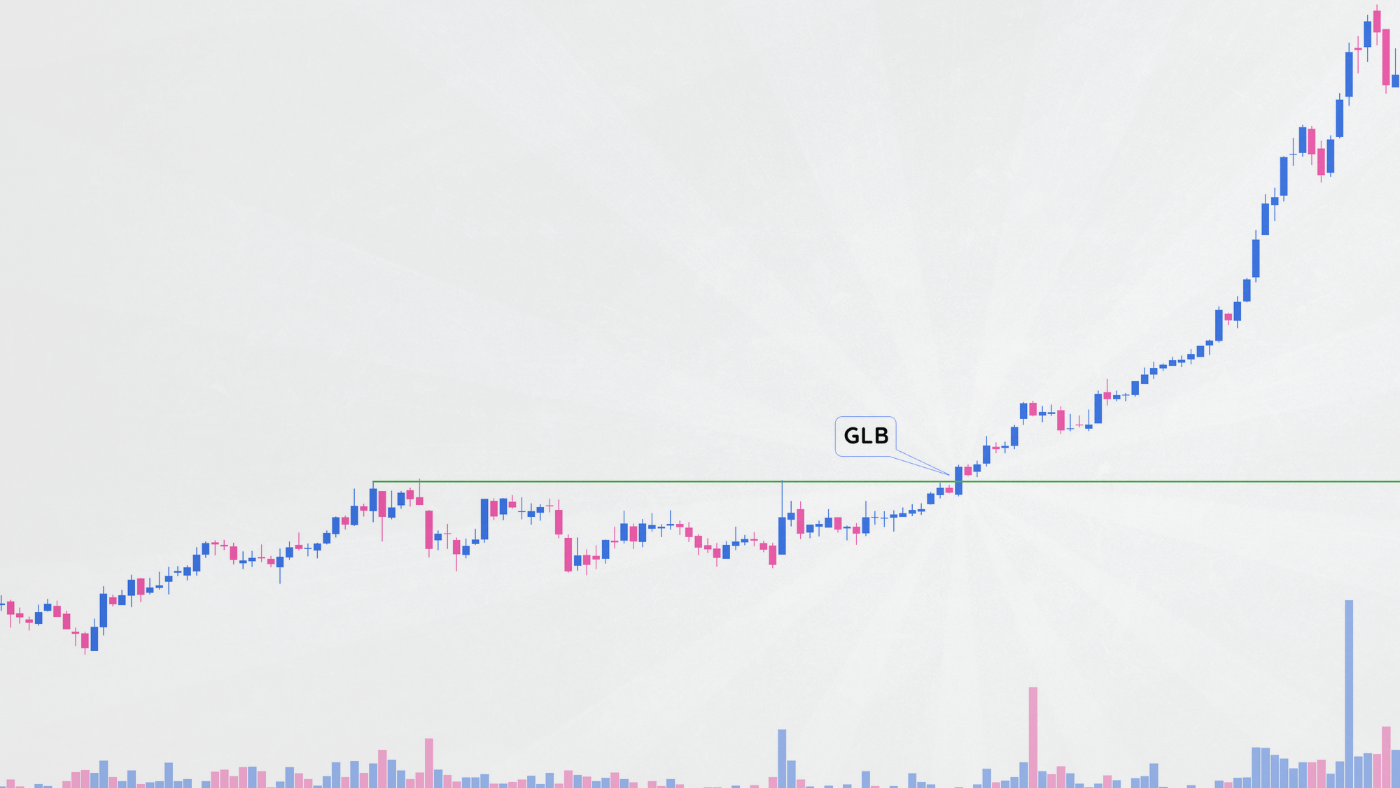
Symbol: TSLA
Company: Tesla
Year: 2020