Base n’ Break: How to Catch Breakouts

Oliver Kell
Oliver Kell is a champion trader who achieved an impressive 941% return by winning the 2020 U.S. Investing Championship. With years of active trading experience, Oliver has developed strategies that thrive in both uptrends and downtrends.
Published: May 11, 2024


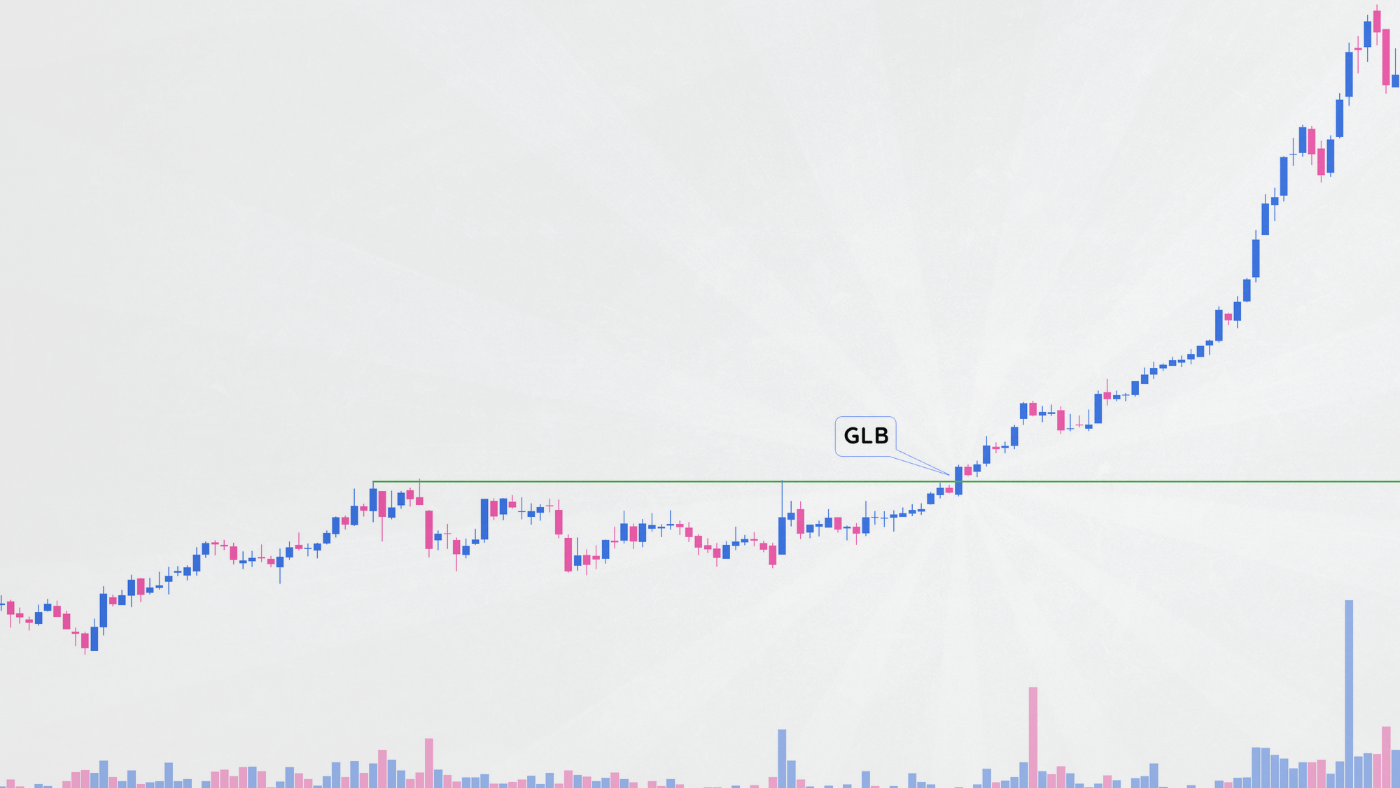
As the stock continues its uptrend higher through the Cycle Of Price Action, it will consolidate and move sideways to retest the moving averages multiple times.
The Base n’ Break is another pullback into the moving averages after the EMA Crossback.
When strength has been confirmed, and buyers continue to support the stock, you will see the price advance to new highs, followed by a brief pause before continuing its uptrend. The Base n’ Break may align with a more traditional larger base or in a shorter pattern when the stock is well into new highs.
As the Cycle Of Price Action progresses over time, Oliver Kell uses the Base n’ Break to add to leading stocks and as a way to understand where we are within the current trend. Learn to understand where you are within the cycle to help you plan your trade when determining position sizes and holding periods.

Another Pullback To The Moving Averages
The Base n’ Break is a shorter pattern when you are already above the moving averages and near highs and begin to see another consolidation into the moving averages. Like the EMA Crossback, a pivot forms, creating a tradable range.
You will notice these steps in the Cycle Of Price Action form in only 1-3 weeks. When observing each step, look for positive price action, the stock being supported off the lows, and then more accumulation through a pivot.
During the uptrend, there may be multiple Base n’ Breaks as the stock progresses higher. Each consolidation provides another area to increase your position size, but more importantly, it helps you understand how far along in the cycle the stock is.
Symbol: LLY
Company: Eli Lilly & Co.
Year: 2021

Click on the chart above to make it bigger.
Multiple Base n’ Break Areas
As the cycle continues, multiple Base n’ Breaks will occur during the stock’s uptrend. After the stock has advanced, it will need some time to consolidate the gains before resuming higher.
Base n’ Breaks may occur below previous highs during severe market corrections. After an EMA Crossback, there may be another retest of the moving averages as the stock moves up the right side of a larger base.
Sometimes, Base n’ Breaks align with a previous high as the stock pauses before making new highs. These pivots will form in alignment with a more traditional base, like the cup and handle or a longer-period basing pattern.
Base n’ Breaks often occur when the stock is already at new highs. The strongest stocks will only pause for a couple of weeks, appear extended, and then continue even higher.
Symbol: NIO
Company: NIO
Year: 2020

Click on the chart above to make it bigger.
Trading The Base n’ Break
When Oliver Kell discovers a leading stock, he always tries to find a way to start a position. Buying the strongest stocks often means they will become extended and challenging to get into.
The proper buy area is through the pivot into new highs. Wait for a base to form, a tight price range to develop, and identify a clear pivot to control risk.
Aggressive traders can add when the price is supported against the moving averages. Using a lower timeframe can help identify a low-risk area.
The safest way to build a full position is to add pieces. Begin accumulating shares as the price is supported by the moving averages, then add confirmation at the actual breakout into new highs.
Be wary of “air” between the price and the 10-day EMA. After a strong move, the price will extend away from the moving averages. Wait for the price to test the 10- and 20-day moving averages and form a base.
If stops are placed below the low of the pivot or breakout bar, you can ride the moving averages higher.
Symbol: AFRM
Company: Affirm Holdings
Year: 2023

Click on the chart above to make it bigger.
Getting Late In The Cycle
The Base n’ Break is best used as an addition to the leading stocks that make up your core portfolio. Ideally, you should have entered at the Wedge Pop or EMA Crossback to hold a position for a longer amount of time, and then you can add at the Base n’ Break.
There can be multiple Base n’ Breaks throughout the uptrend in the cycle. Stronger bull cycles after severe bear markets will see more Base n’ Breaks compared to a new uptrend off a mild correction.
In a typical cycle, once you get two Base n’ Breaks, you should realize you are late in the intermediate-term cycle and begin looking for an Exhaustion Extension. Sometimes, up to four Base n’ Breaks may be on a strong advance.
Tailor your trading strategy based on where you are in the Cycle Of Price Action to determine position sizing and intended holding period.
Symbol: CLS
Company: Celestica
Year: 2023

Click on the chart above to make it bigger.
Timing The Trend
In addition to identifying areas to buy or add, the Cycle Of Price Action is also used to time the market or stock. Once you see multiple Base n’ Breaks, you are getting later in the cycle.
Understanding where you are in the intermediate-term trend will help you manage your position.
If you start a position early in the Cycle Of Price Action at the Wedge Pop or EMA Crossback, you can feel more confident holding the stock for a longer period and sit through smaller pullbacks.
As you see multiple Base n’ Breaks, take a quicker swing trade and sell into strength.
Symbol: TMDX
Company: TransMedics Group
Year: 2022

Click on the chart above to make it bigger.
Indices And Stocks
Leading stocks will always be further along their own Cycle Of Price Action ahead of the Indices. Watch for the cycle to unfold on the index level while screening for relative strength on the individual stocks.
When a stock breaks out of a Base n’ Break, the index may form a Reversal Extension, Wedge Pop, or EMA Crossback. Once the selling pressure recedes and buyers show up, the stocks breaking into new highs will lead the market higher.
Symbol: ELF
Company: e.l.f. Beauty
Year: 2022

Click on the chart above to make it bigger.
Putting It Together
The Base n’ Break offers an area to buy or add to your position and provides a way to time the intermediate-term trend.
Symbol: STRL
Company: Sterling Infrastructure
Year: 2023

Click on the chart above to make it bigger.
A Base n’ Break can form near previous highs and as a stock already appears extended. As the Cycle Of Price Action unfolds, multiple Base n’ Breaks can be traded, but more importantly, they provide insight into where we are in the trend.
If you are holding a position from lower, consider adding to the strongest stocks. Once the price confirms higher you now have a new area to raise your stop.
When you see multiple Base n’ Breaks you are getting later in the Cycle Of Price Action. For newer adds, be quick to sell into strength, and begin to look for signs of an Exhaustion Extension.