When Not to Trade: Why Cash Is a Position

Ross
Ross is a co-founder of TraderLion and Deepvue. He was mentored by William O’Neil, and co-authored The Model Book of Greatest Stock Market Winners at WON + Co.
Published: October 7, 2026


 Ross Haber
Every new post, straight to your inbox
If this was useful, the next one will land in your inbox the day I write it.
When Should You Not Trade?
Early in my career, I thought being a trader meant always having a position. If I wasn't in something, I felt like I was falling behind. So I traded through corrections, bought the "best-looking" charts in a bad market, and gave back in weeks what had taken months to build. The setups looked the same. The market underneath them didn't.
What changed it was watching what happened to people who couldn't or wouldn't stop. Early in my career, I sat next to a guy in institutional sales whose client ran a billion-dollar fund. Harvard grads, all of them. In 2000, when Bill O'Neil said sell, they kept buying all the way down because they believed in the fundamentals. They were wiped out. Knowing when not to trade is not a lack of conviction. It is a skill, and it is the one that keeps you around long enough to use the others.
Why Knowing When Not to Trade Matters
The math is not symmetrical. Lose 7%, and you need 7.5% to get back. Lose 30%, and you need 43%. Lose 50%, and you need 100%. Every loss you take in a bad market is a loss you have to earn back in the next good one, which means you start the new uptrend behind, with less capital and less nerve, right when the best opportunities show up.
That is why risk management is not just stops and position size. It is also deciding whether to be in the game at all. A perfect setup in a correction still fails most of the time, because the stock is swimming against the current. Bill O'Neil's research found that roughly three out of four stocks move with the general market. The best setup in the world will not save you from that.
The part most people skip: the market tells you when your method isn't working. You don't have to predict it. Your results will tell you first, if you're willing to listen.
Cash Is a Position
Being in cash is not doing nothing. It is a decision with a reason, and it protects the capital you'll need when the market turns. Institutions are aircraft carriers: they cannot get out of a falling market quickly, and they can't sit in cash for long. You are a speedboat. You can step aside in an afternoon. That is one of the few real advantages an individual trader has, and most people never use it.
What I look for before I stop buying
- The indexes under pressure. QQQ and SPY below their 21-day SMA and 50-day SMA, with heavy-volume down days piling up.
- There is a notable lack of sound setups in traditional growth stocks.
- Breakouts failing. When new breakouts slip back into their bases within days, the market isn't paying for my setups, no matter how good they look.
- My last few trades. If my last four or five buys were stopped out, the problem usually isn't me. It's the environment. That's my cue to stop.
- Leaders acting wide and loose. When the strongest names start breaking down on volume, the tide is going out.
What it looks like when it fails
The way to get this wrong is to stay out too long. Cash protects you in a correction, but if you sit on your hands after the market turns, you miss the early leaders, and they are often some of the best trades of the cycle. Fear of the last correction keeps many traders out of the next uptrend.
So cash needs an exit rule, just like a stock. Mine is the follow-through day: an index up at least 1.75% on higher volume, on day four or later of a rally attempt. When that comes, and leaders start breaking out of sound bases, I start buying again in small size. Cash without a plan to leave it is just fear.
What a No-Trade Market Looks Like
You don't need a crystal ball. The first clue doesn't show up on a chart at all. It shows up on your watchlist. The three charts after it confirm what the watchlist already told you.
The watchlist dries up
This is my main clue, and it usually comes first. In a healthy market, my screens turn up more sound setups than I can buy. When the market starts to turn, the list shrinks noticeably. The names that still show up are wide and loose, extended, or already breaking down. Traditional growth stocks stop forming proper bases.
When a watchlist that was full of names worth watching drops to a handful, I don't need the index to confirm it. The market is telling me there's nothing to buy, and I listen. The index chart, the failed breakouts, and the leaders breaking down usually arrive after this, as confirmation.
The index under pressure
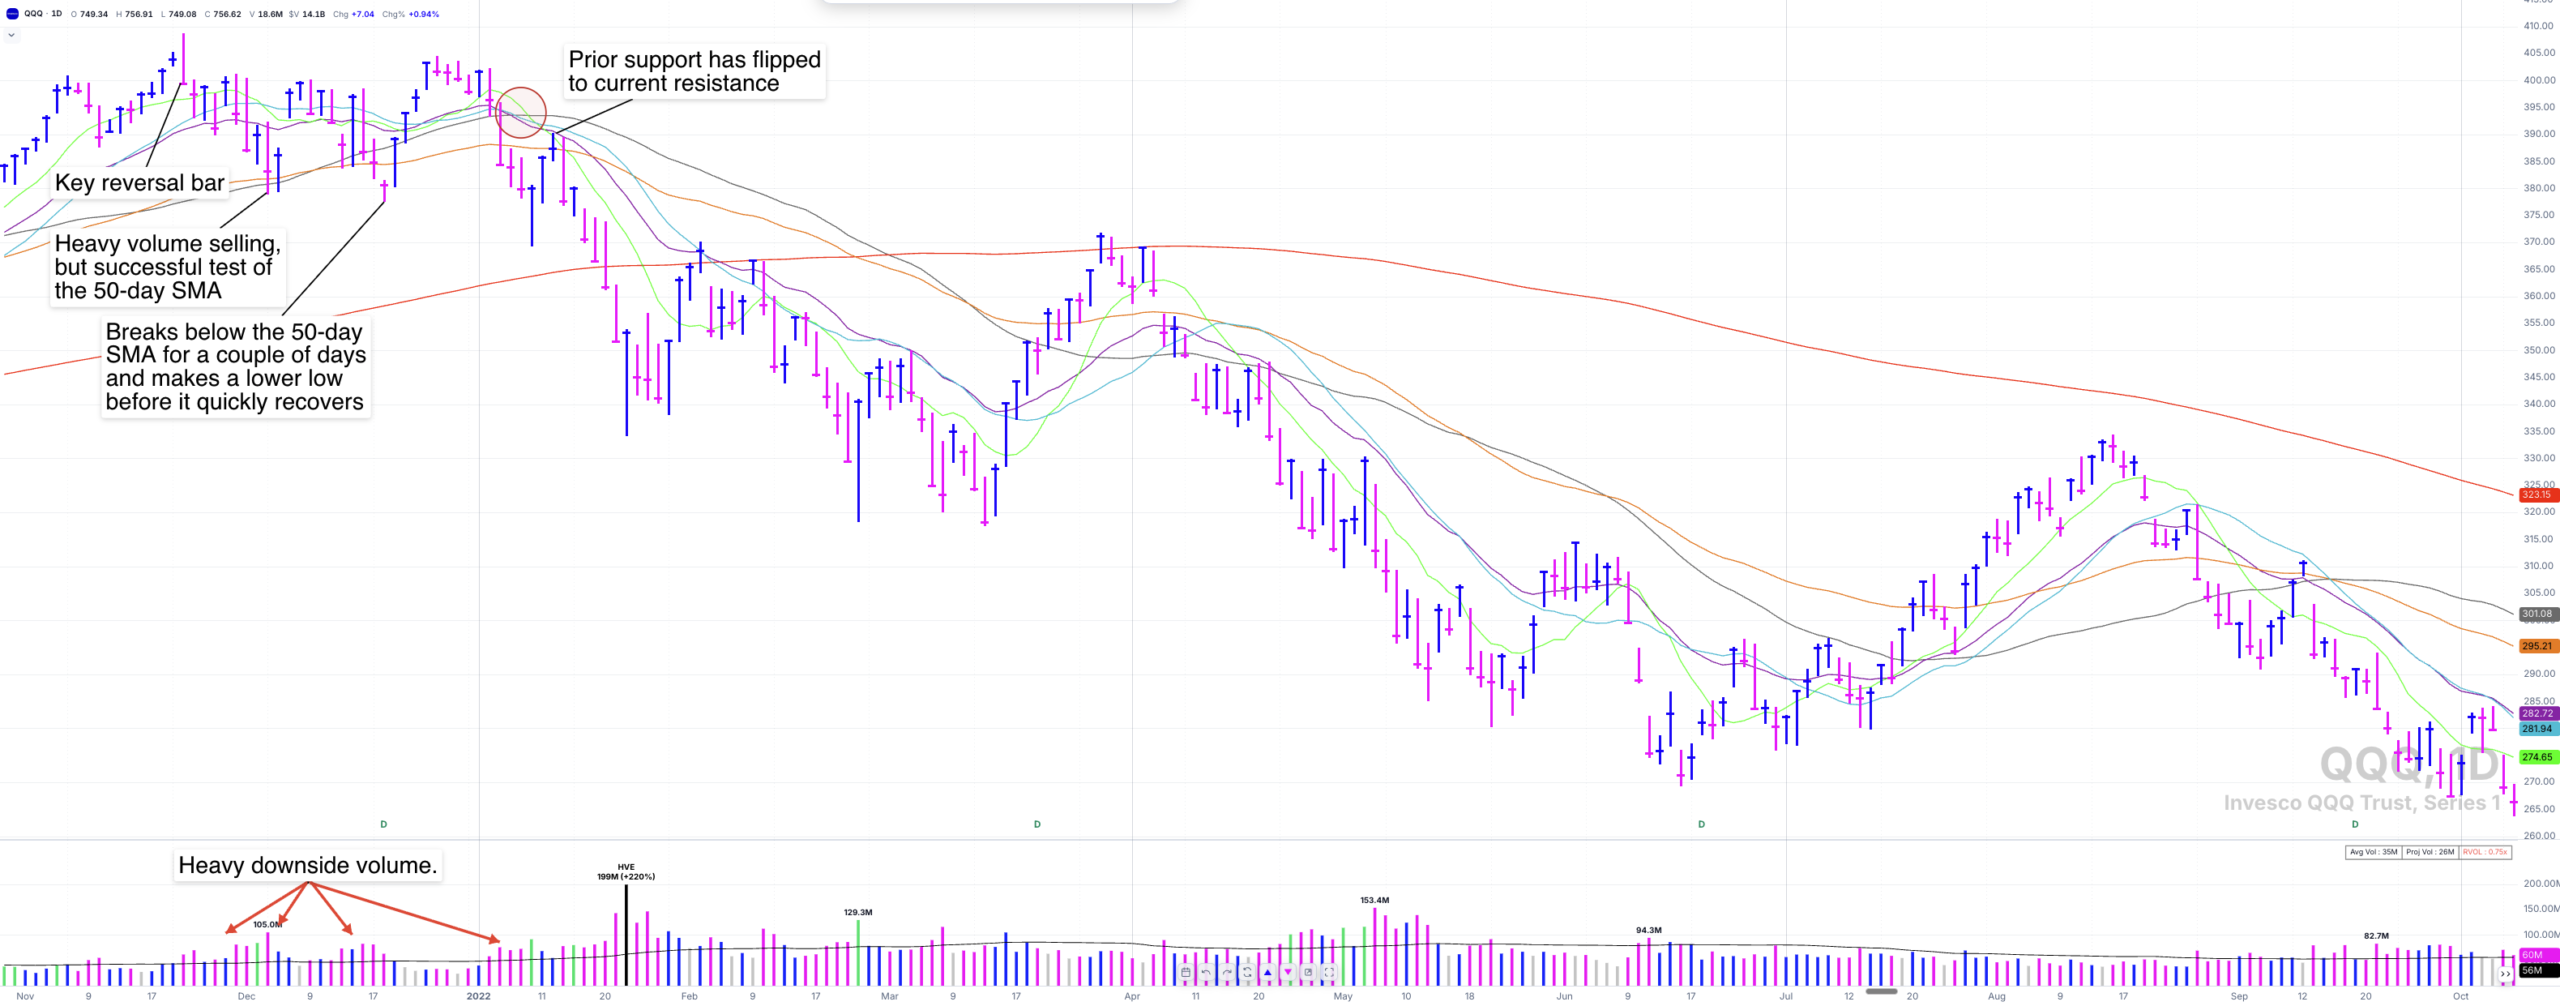
Lower highs, heavy-volume selling, and price below the 21-day and 50-day. Not the place to be buying.
This is the backdrop. The index can't hold its moving averages; the down days come on heavy volume, and the rallies are short and weak. Using Stan Weinstein's stage analysis, it's a market leaving stage 2 or already in stage 4. Individual setups don't overcome that.
The breakout that failed
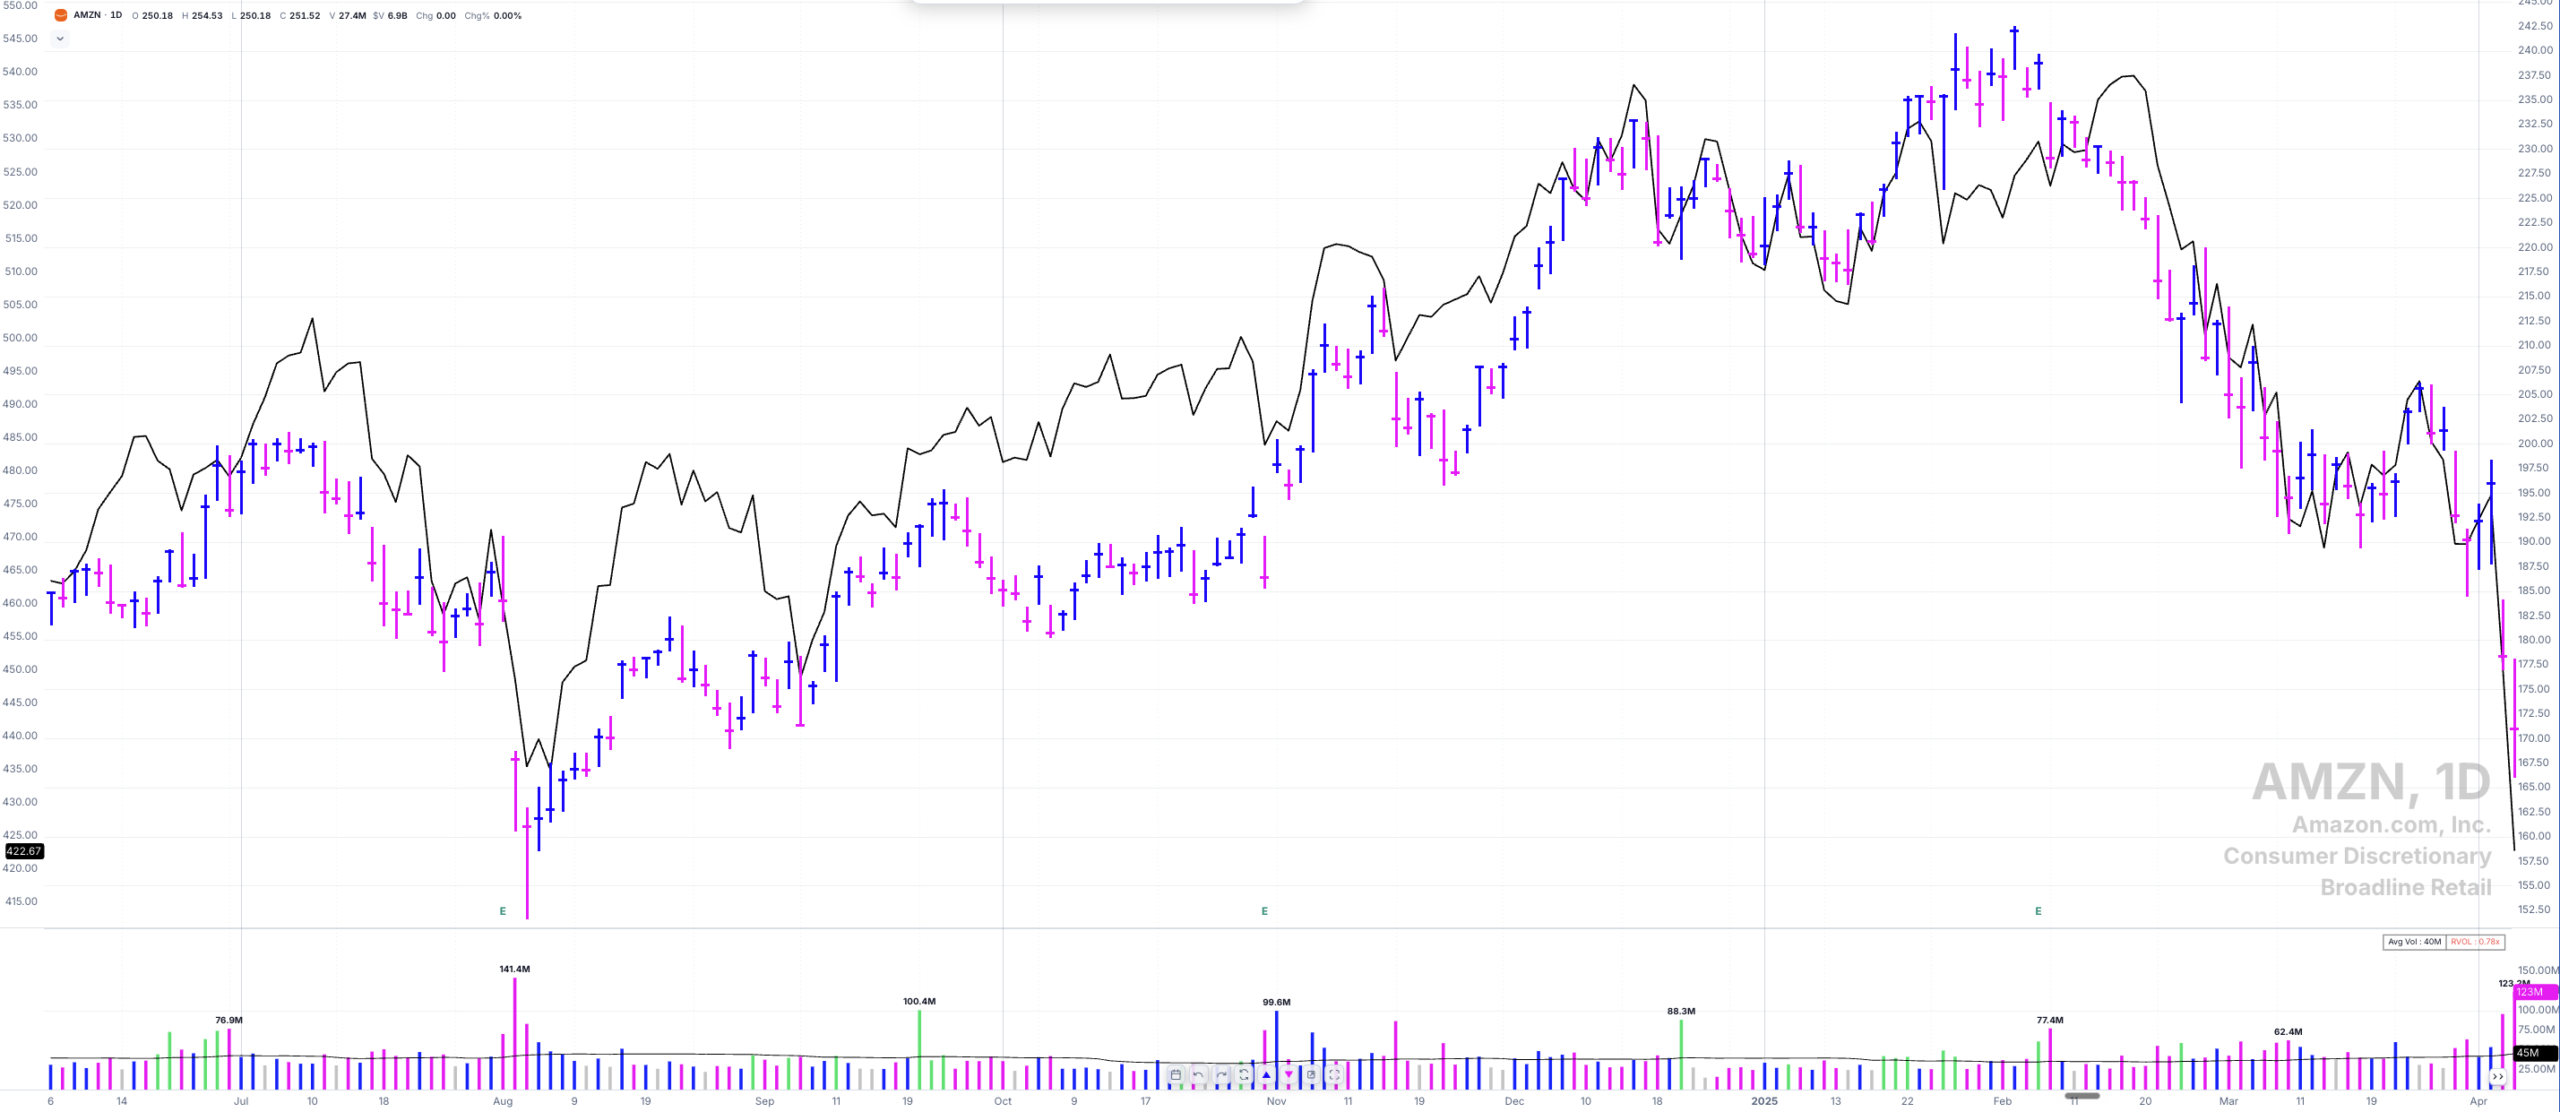
A good-looking base, a breakout, and back inside within days. The setup was fine. The market wasn't.
This is what a bad tape does to a good setup. The base was sound, the pivot was clean, and the stock broke out. A week later it was back inside the base. When I see this across several names, I stop. One failure is the cost of doing business. A cluster of them is the market talking.
The leader breaking down
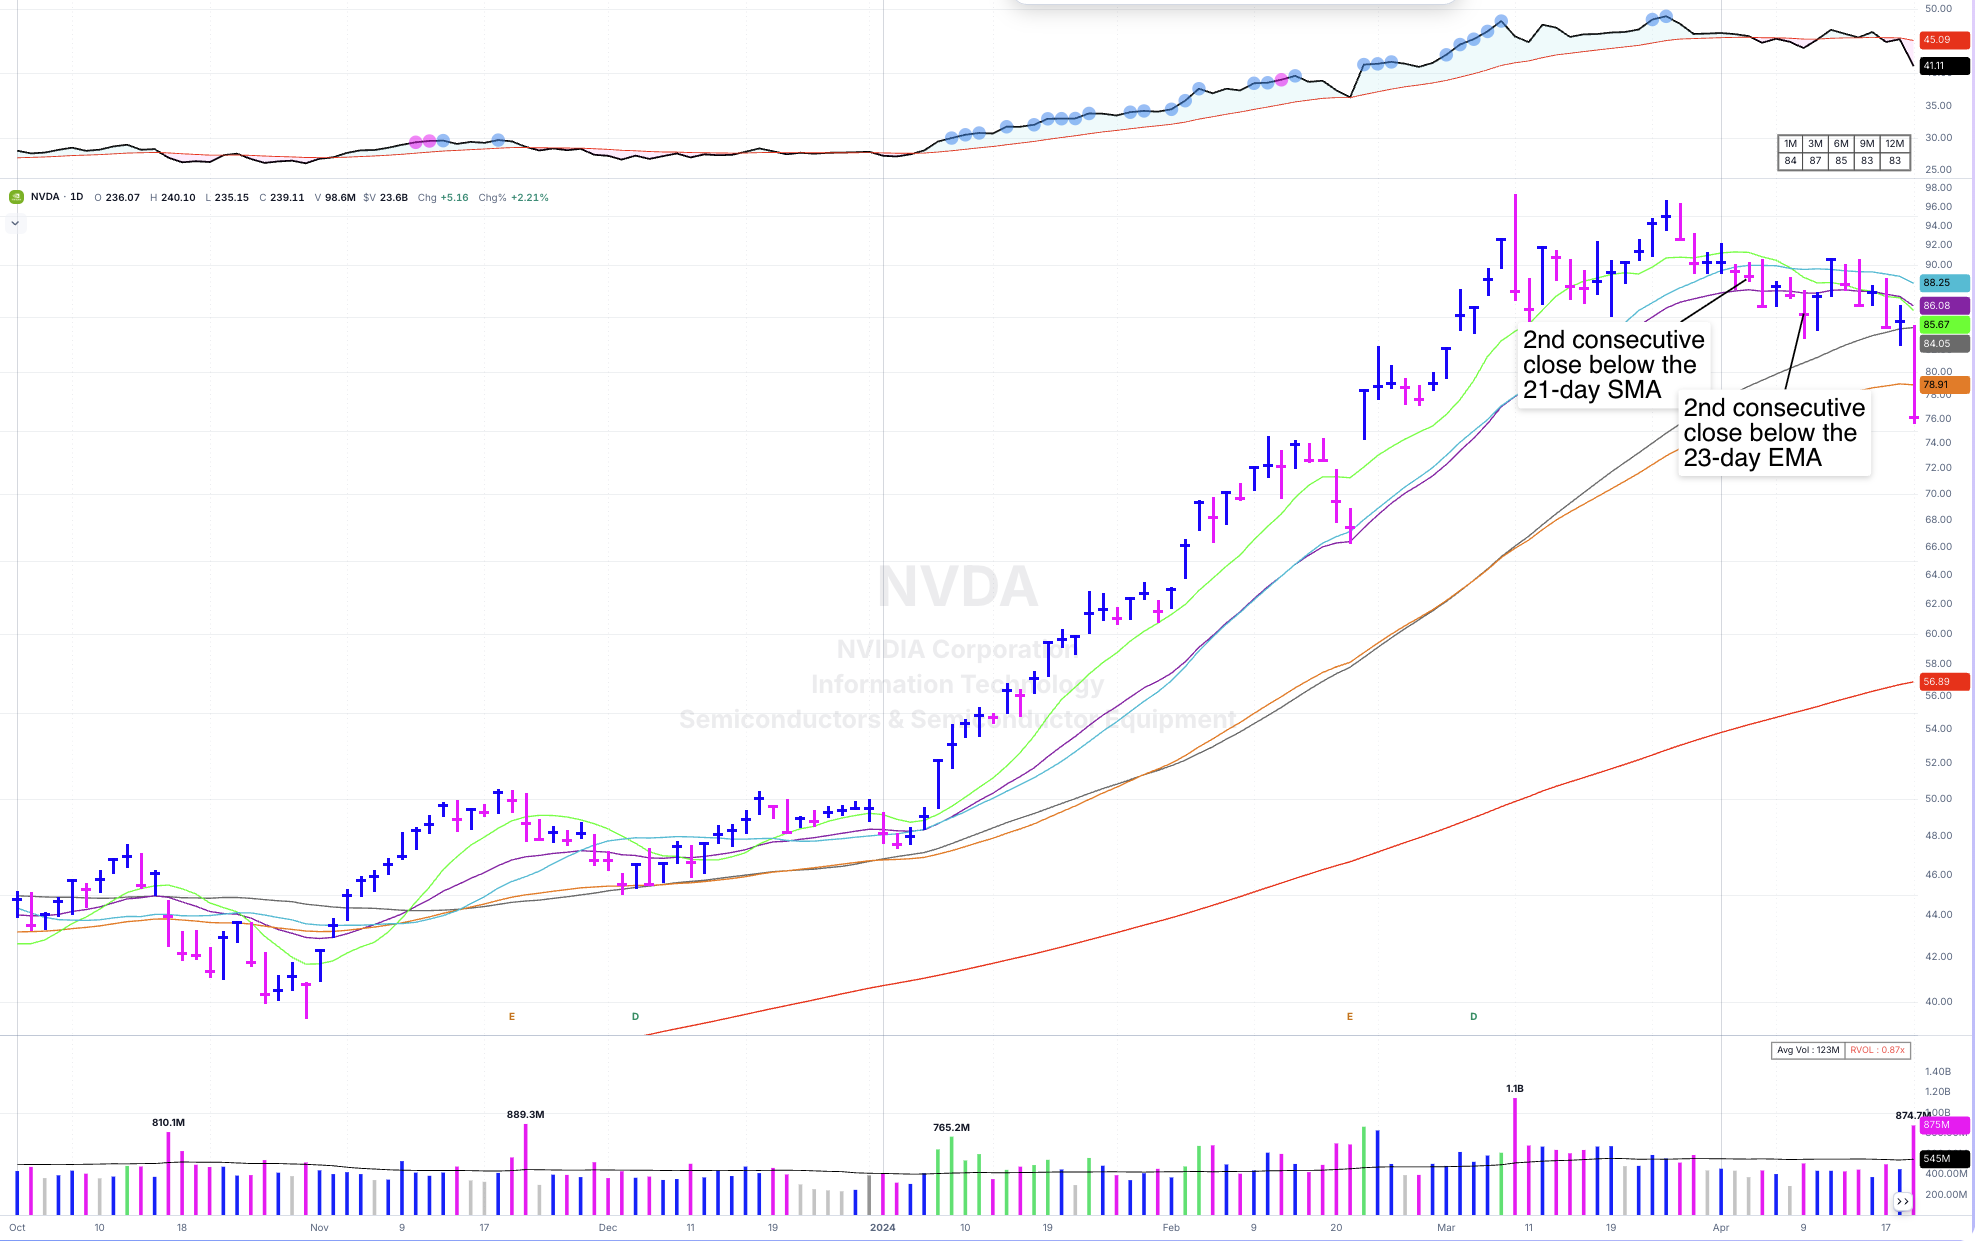
When the strongest names start breaking their 21-day SMA on volume, the tide is going out.
Leaders are the last to break. I respect the 21-day SMA on the way up, and I respect it on the way down. When it closes below the 21-day SMA for the second straight day and then below the 50-day SMA on heavy volume, the uptrend is usually over for now. That's not the time to look for the next breakout. It's the time to raise cash and watch.
What to Do While You're in Cash
Not trading is not the same as not working. This is when you prepare.
- Write down why you're in cash. Two or three lines: what the indexes are doing, what your last trades did. It stops you from drifting back in on a whim.
- Write down what gets you back in. A follow-through day, and leaders breaking out of sound bases. Decide it now, not in the moment.
- Track the stocks holding up best. Look for RS lines at or near new highs while the market falls. Run it as a screen in Deepvue if you have it. These are your next leaders.
- Work on your model book. Mark up the last cycle's leaders: where they should have been bought and where they should have been sold.
- Keep your watchlist short. Ten to fifteen names that are holding up and setting up. When the market turns, you want to be ready, not searching.
It's OK to be in cash for weeks. It's OK to miss the first few days of a new uptrend while you wait for confirmation. The market will give you another chance. It doesn't always give you back what you lost by forcing trades in a bad one.
The TML Report
Twice a week I publish where I think we stand: the market overview, the four index charts, and a focus list of the names holding up best, with the lines already drawn on them. In a correction, that's how I track what's next.