Master Finding VCP Patterns: Identify Tight Areas Quickly
Nick Schmidt
Nick Schmidt is a co-founder of TraderLion and Deepvue with over 10 years of market experience. Adopting a “less is more” philosophy, he focuses on weekly charts with an emphasis on price and volume.
Published: June 21, 2024
Tight areas refer to tight ranges that form on weekly and daily charts. These ranges suggest accumulation and can develop into ideal entry points.
Identifying tight areas is part of the skill set of many of the greatest traders in the stock market.
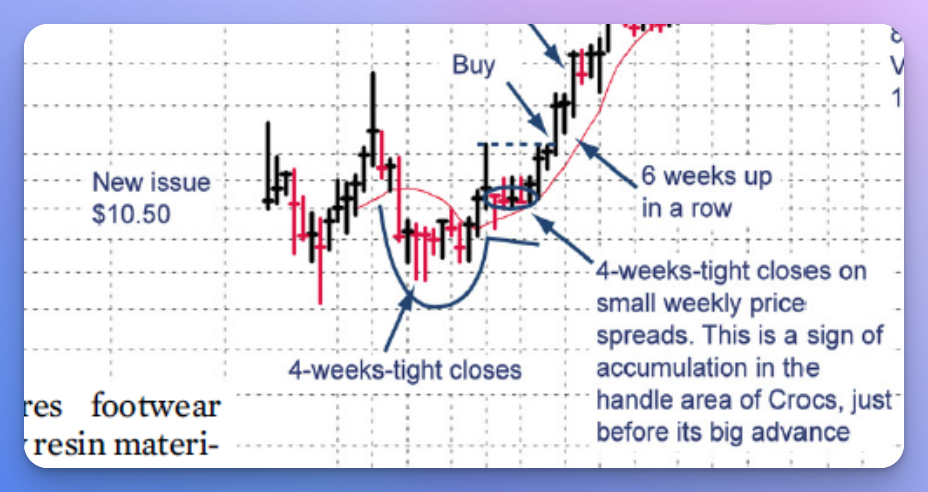
In his analysis of the greatest stocks, William O’Neil constantly highlighted tight weekly action as a winning Technical Price and Volume Characteristic.
He looked for this signal at the lows of bases, in handles, and after breakouts, as in this example in $CROX
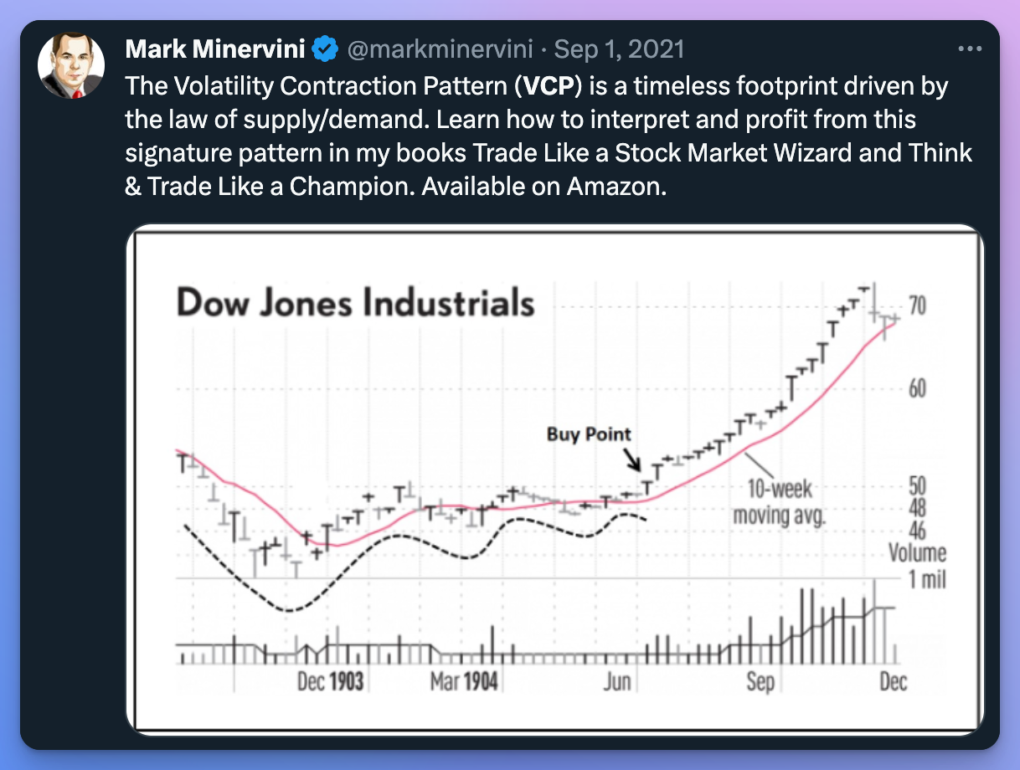
Mark Minervini looks for Tight Areas as a component of his ideal setup: The Volatility Contraction Pattern.
Tight areas, along with a dry-up in volume, is a clear clue that a stock has promise and should be taken in the context of the overall pattern to identify promising opportunities and entry points.
Now, let’s dive into what exactly to look for.
What Does a Tight Area Look Like?
A Tight Area forms when a stock drifts sideways to slightly lower and the price ranges from high to low tightens relative to recent price action.
This is most constructive when it coincides with a decline in volume.
These tight areas often precede a large-size move up or down.
How to Find Tight Areas in Real-Time?
To identify these areas, look for “pauses” in price action. It may be tough to identify them initially, but remember, this skill will benefit you throughout your trading career.
Let’s do an exercise to help train your eyes.
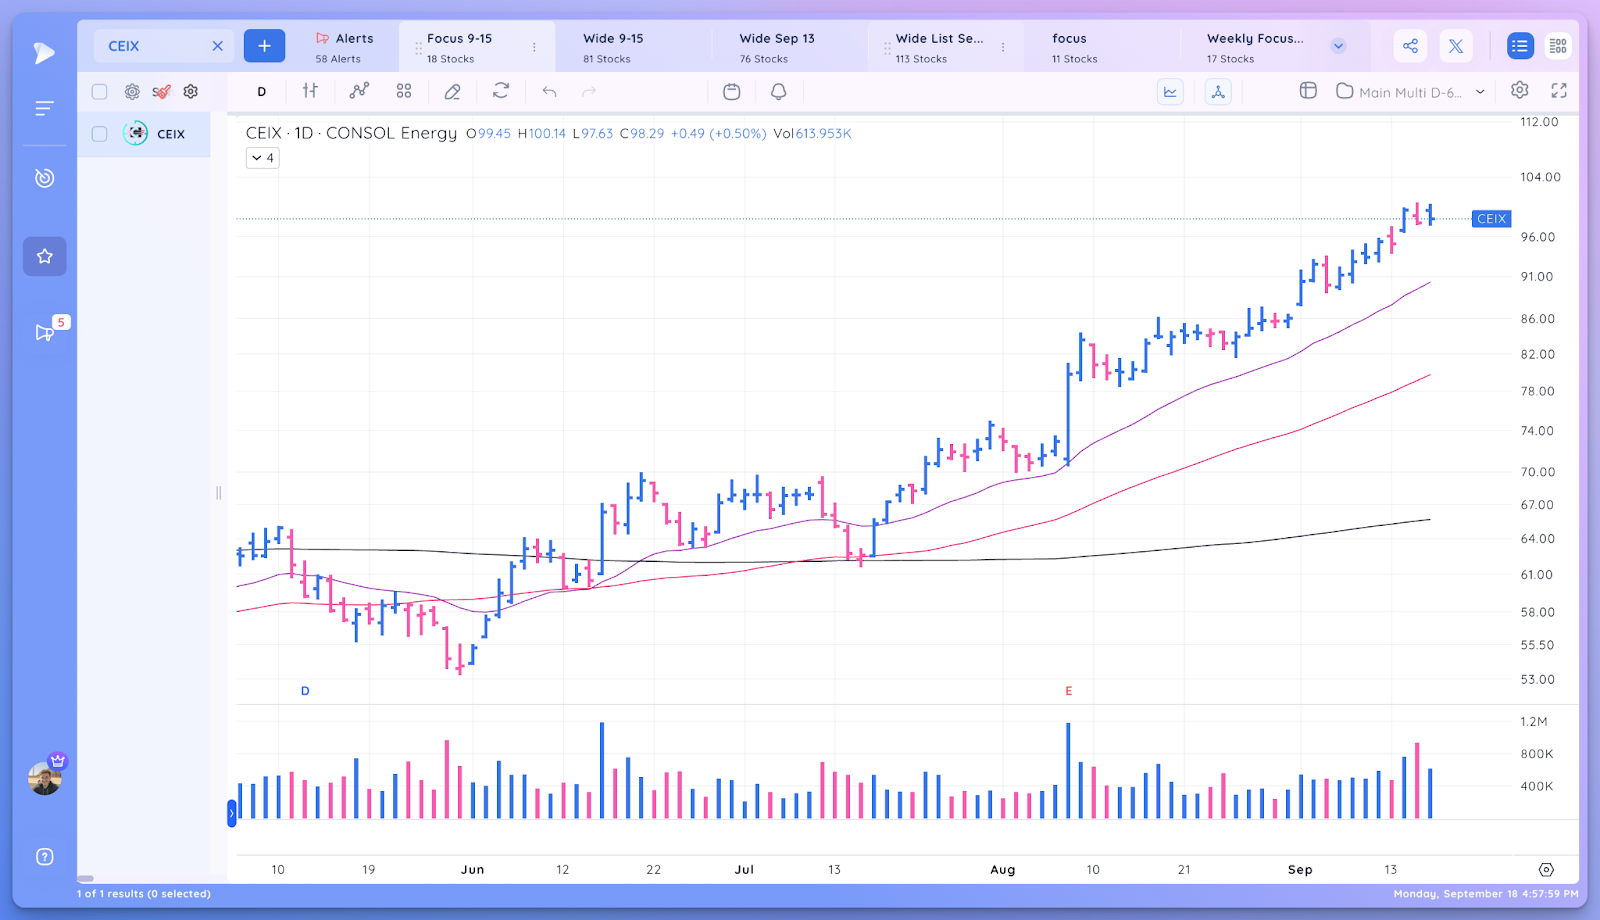
- Analyze the chart below
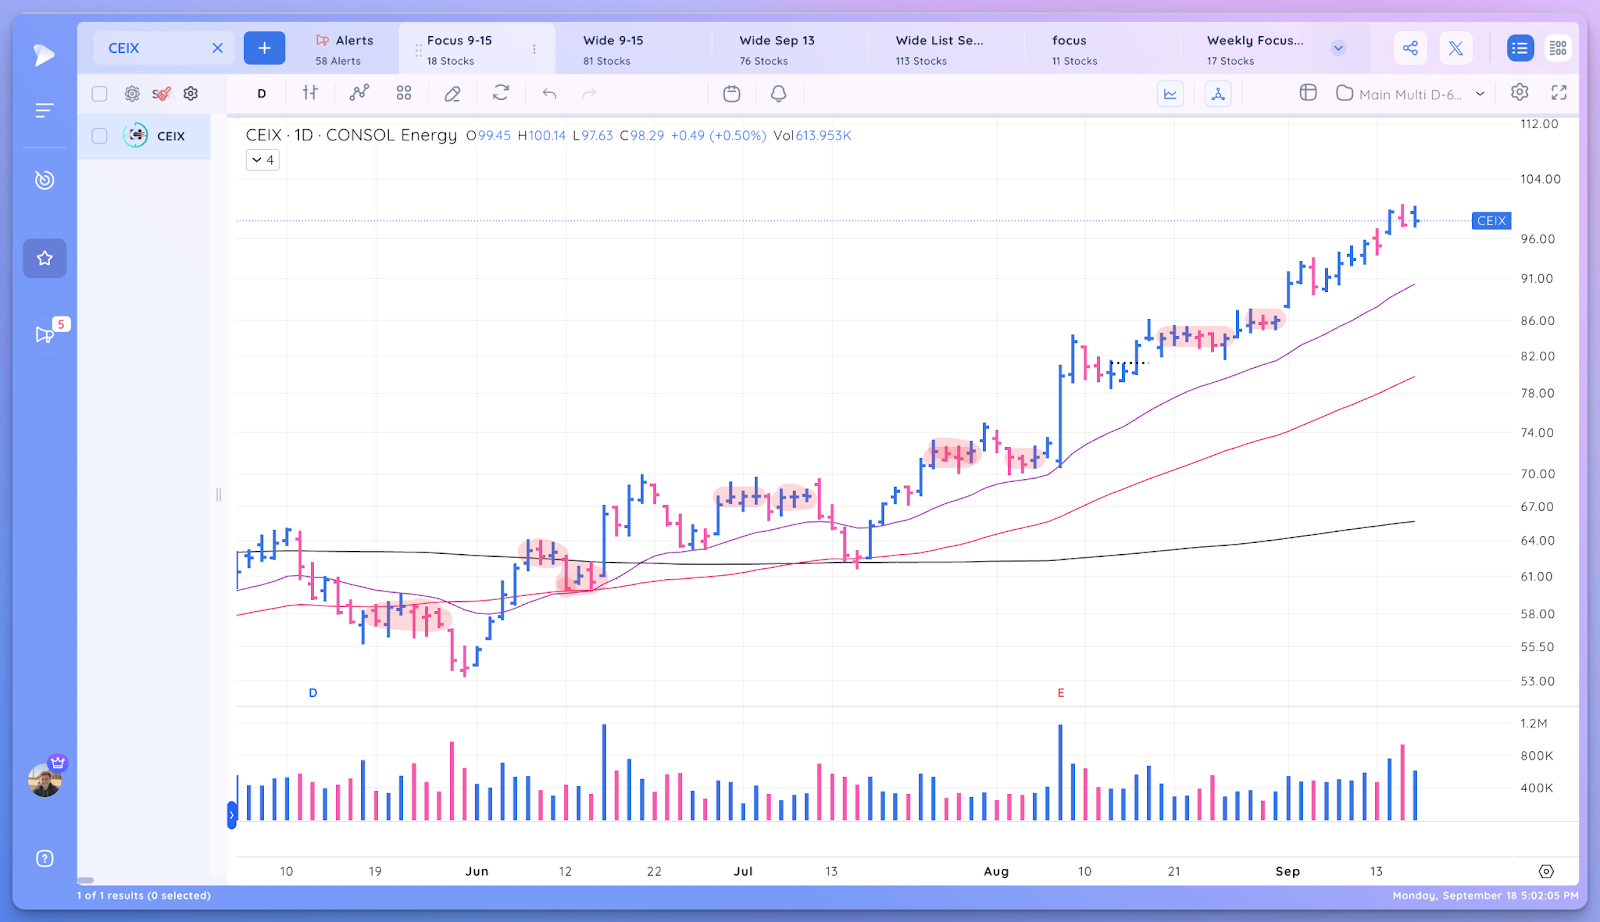
- Highlight any tight areas where the price goes sideways for at least 2-3 days and ranges constrict.
Take 2-3 minutes to complete this exercise.
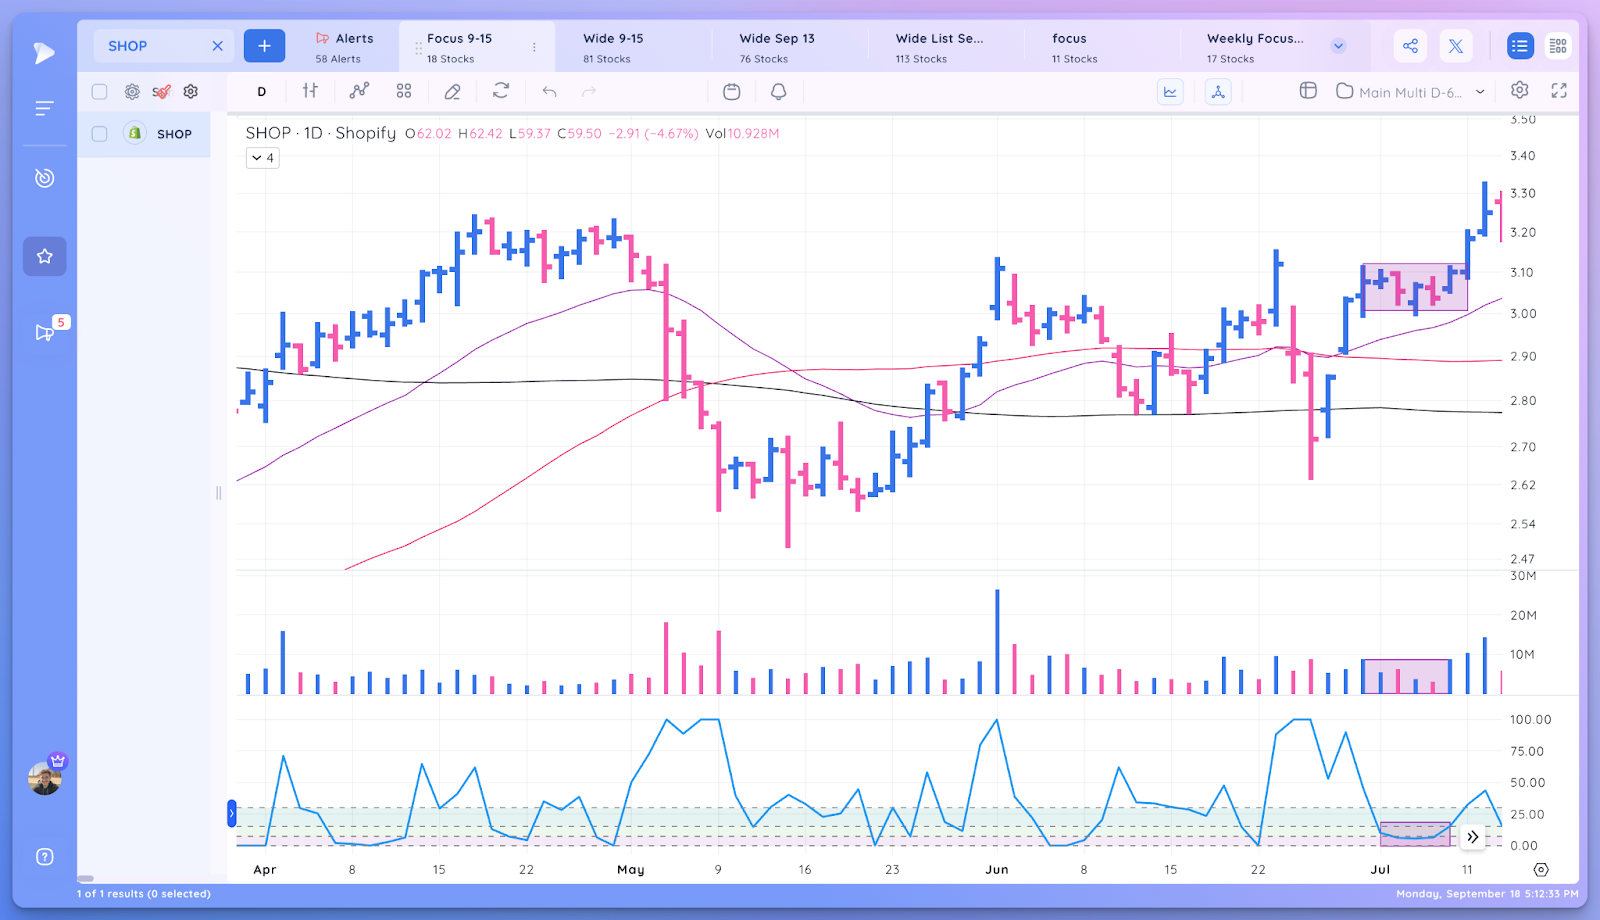
The following chart highlights the tight areas you may have noticed.
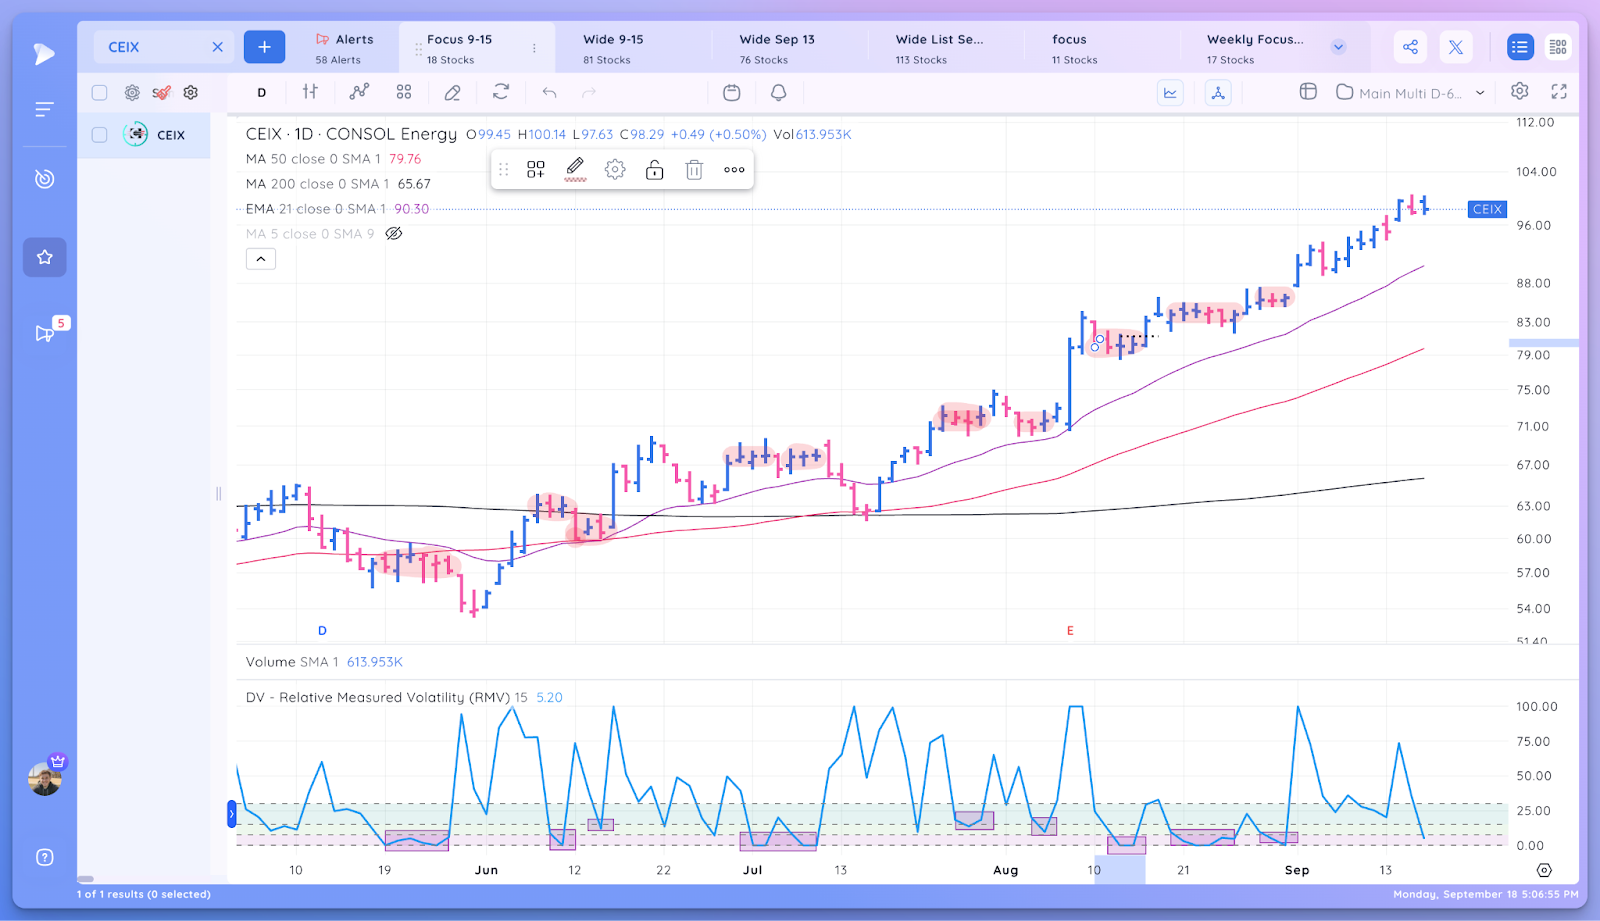
To help find the tight areas, we’ve created the Relative Measured Volatility (RMV) Indicator in Deepvue
The indicator produces two readings:
- Near 0 when the price tightens
- Near 100 when the price expands
For beginners, this is an incredibly valuable training tool.
For experienced traders, this indicator can serve as an objective confirmation of price tightness.
You can watch a tutorial on the indicator below.
factors to consider
Tight Areas should always be considered in the context of the larger pattern.
They are evidence of a balance of supply and demand and, in strong stocks, along with declining volume, a sign of accumulation.
When you identify a Tight Area, here are some other factors to consider:
- Is the Tight Area close to completing a larger base/pattern?
- Is volume contracting with price?
- Does the stock have a strong prior uptrend before the consolidation and tight area?
- Is a clear pivot level forming at the top of the tight area?
- Does the stock have strong Relative Strength?
- Is the stock part of a leading group?
Putting it all together
Tight Areas are a classic chart characteristic that appear repeatedly in the top stocks throughout their moves.
By training your eyes to look for them, you can gain an edge by finding low-risk entry points as they emerge through pivots.
Using RMV can help objectively determine a tight area, and you can also use it to scan for tight areas in Deepvue.


