What is a Hammer Candlestick?

Ameet Rai
Electrical Engineer and Swing Trader focused on achieving super-performance. Through extensive studies of previous super-performance stocks and proprietary data-based research I provide guidance for new traders with an emphasis on building processes and teaching traders how to think and trade for themselves.
Published: September 17, 2022


A Guide To Trading The Hammer Candlestick.
The hammer candlestick is a bullish reversal pattern that forms when a stock trades lower than its opening price, but rallies within the period to close near that same opening price. This candlestick looks like a hammer, with a long lower shadow or wick, a small or non-existent upper wick, and a small body. The body of the candlestick represents the difference between the opening and closing price, while the wicks represent the high and low of the period. We put together an easy infographic cheat sheet of the top candlestick patterns to help train your eye.

How to Trade the Hammer Candlestick
The hammer candlestick is a bullish reversal pattern that can be used to enter a long position or add to an existing long position. When trading the hammer candlestick pattern, traders will look for the following characteristics:
- The stock should be in a downtrend (any timeframe) leading up to the hammer formation.
- The hammer should form after a period of selling pressure.
- The hammer should have a small body with a long lower wick.
- The hammer should be followed by a period of buying pressure which acts as confirmation.
If these characteristics are met, traders will enter a long position when the stock breaks above the high of the hammer candle in the next period (the period depends on the timeframe). A stop loss can be placed below the low of the lower wick or shadow. Risk should be managed effectively and you can always tighten stops depending on your confidence in the trade. If the price breaks below the low of the hammer candle, the reversal signal is invalidated and selling pressure is likely to pick up.
If you’re having trouble understanding how to read candlesticks make sure you get the basics down first.
Hammer Candlestick Advantages
The hammer candlestick has a number of advantages. It is a relatively easy pattern to identify, it can be used in conjunction with other technical indicators, and it can provide a clear entry and exit point for a trade.
One of the key advantages of the hammer candlestick pattern is that it can be used in any timeframe, similar to the bullish engulfing pattern. This makes it a versatile tool for both day traders and swing traders alike.
Is a Hammer Candlestick bullish?
The hammer candlestick is a bullish reversal pattern. This means that it typically forms at the end of a downtrend and signals a potential move higher. This candlestick pattern is bullish because not only are sellers unable to push the price lower, but the buyers push the price back up aggressively and close the candle well-off lows. This type of price action is typically a bullish sign and tells us that buyers are in control.
Why do Hammer Candlesticks Form?
Hammers form due to a fight between buyers and sellers. This pattern forms when the market or stock is ‘oversold’ and buyers step in to push prices higher. The long lower shadow (or wick) shows that sellers were in control early in the period, but buyers stepped in and pushed prices back up.
This action results in the hammer candlestick formation. The hammer candlestick pattern is seen as a reversal pattern, which means it occurs at the end of a downtrend and signals a potential move higher. The key takeaway is the price closes nowhere near the low which indicates by the close of that specific candlestick, bulls were able to regain control.
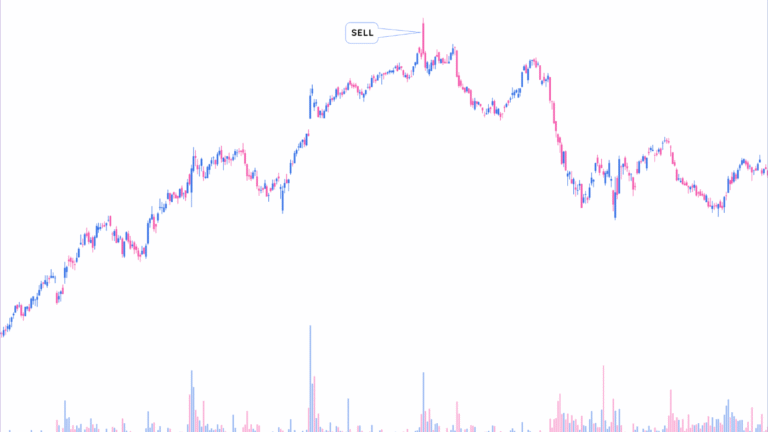
Hammer Candlesticks Examples
Click on the image below to expand the chart.
Hammer Candlestick vs Doji Candle
While hammer candlesticks and Doji candles may look similar at first glance, there are key differences between the two patterns. The hammer is a bullish pattern that typically forms at the end of a downtrend, while the Doji is a neutral pattern that can form at any time.
The hammer has a small body with a long lower shadow, while the Doji has a small body with generally equal upper and lower wicks. The hammer signals a potential reversal and is bullish, while the Doji is neutral and doesn’t necessarily signal any specific price action.
Hammer Candlestick vs Hanging Man Candlestick
The hammer and hanging man patterns are very similar, but there is one key difference. The hammer forms at the end of a downtrend and is bullish, while the hanging man forms during an uptrend and is bearish.
Other than that, the two patterns are identical. They have small bodies with long lower wicks, very little or non-existent upper wicks, and signal a potential reversal in the current trend.
The hammer is a bullish pattern that can signal the end of a downtrend and the start of an uptrend. The hanging man is a bearish pattern that can signal the end of an uptrend and the start of a downtrend.
Try our free position size calculator to help determine how many shares to buy.
What is an Inverted Hammer Candlestick?
The inverted hammer candlestick, just like the hammer candlestick, indicates a bullish reversal. The name perfectly sums it up. It looks just like the hammer candlestick but upside down.
It has a small body with a long upper wick and little to no lower wick. This indicates that sellers were in control early in the period, but buyers stepped in and pushed prices back up.
The buying pressure is more powerful in the regular hammer candlestick which is indicated by the price closing well off the lows of the day or period.
The inverted hammer doesn’t necessarily signal as strong of a move higher, but the pattern indicates that buyers are stepping in and that the downtrend may be coming to an end.
Remember candlestick patterns alone are not a complete technical analysis strategy. Good trading strategies include a plan for managing risk.
The Bottom Line
The hammer candlestick is a bullish pattern that can signal the end of a downtrend and the start of an uptrend. The key takeaway is the price closes nowhere near the low which indicates by the close of that specific candlestick, bulls were able to regain control. Trading strategies that include trading hammer candlesticks must always have a plan in place for managing risk.
Jump to: What is the Head and Shoulders Pattern?