When Will the Stock Market Top: A Comprehensive Study
Published: September 15, 2025
When does the stock market top? Insights from economic contexts
Stock market tops aren’t random events – they usually happen for a reason. Since 1985, history shows that tops often form when the economy is running hot.
We’re talking about times of excess spending, inflated stock prices, and investor euphoria. These periods might feel exciting, but they often set the stage for sharp corrections once underlying problems are exposed.
By looking at the economic conditions that build up before these peaks, and what ends up triggering the decline, we can better understand how the market behaves at major turning points.
No two market tops look exactly the same. But what they do have in common is that they’re driven by real-world economic trends, not just random market noise. Each major bear market (where stocks drop 20% or more) starts with a strong bull run, followed by a disruption that brings things crashing back down.
How do we define a stock market top?
A stock market top typically forms after a long rally. Everything seems great – stocks are climbing, optimism is high, and people believe the good times will keep rolling.
But then, the rally fades, and stocks fall 20% or more from their highs. That’s when we say a market top has occurred.
Here are a few signs you’re likely near a top:
- Euphoria sets in: Investors start piling into the market out of fear of missing out. Trading volume picks up as people chase quick gains.
- Everyone’s optimistic: Media headlines turn bullish, and sentiment surveys (like AAII) show extreme levels of confidence or even greed.
But market tops rarely collapse overnight. Here’s how the shift usually happens:
- Price begins to struggle: Buyers lose confidence, and sellers start to take control.
- The trend changes: Instead of hitting new highs, the market starts forming lower highs and lower lows, a classic sign of weakness.
Even with these signals, predicting the exact timing of a top is tough. That’s because it’s not just about sentiment – it’s about how that sentiment interacts with things like interest rates, corporate profits, inflation, and global events.
What happens after a stock market top?
After the peak, markets don’t always crash immediately. More often, you’ll see volatility increase, with sharp rallies followed by equally sharp drops. That’s a sign the market is trying to figure out what’s next.
Eventually, momentum shifts for good:
- Investors realize the rally was overdone.
- News sentiment begins to shift, highlighting risks instead of rewards.
- Fundamentals like slowing earnings or rising rates start to matter again.
At this point, the market enters correction or bear market territory. Long-term investors might feel the pain, but for others, this phase offers a chance to reset and reassess.
When has the stock market dropped 20% or more since 1985?
Let’s take a look at the five major stock market tops since 1985 that led to bear markets – defined as a decline of 20% or more in the S&P 500. Here’s when they happened and how deep the drop went:
| Peak Date | Trough Date | Percent Loss |
|---|---|---|
| 8/25/1987 | 12/4/1987 | -33.5% |
| 3/24/2000 | 10/9/2002 | -49.1% |
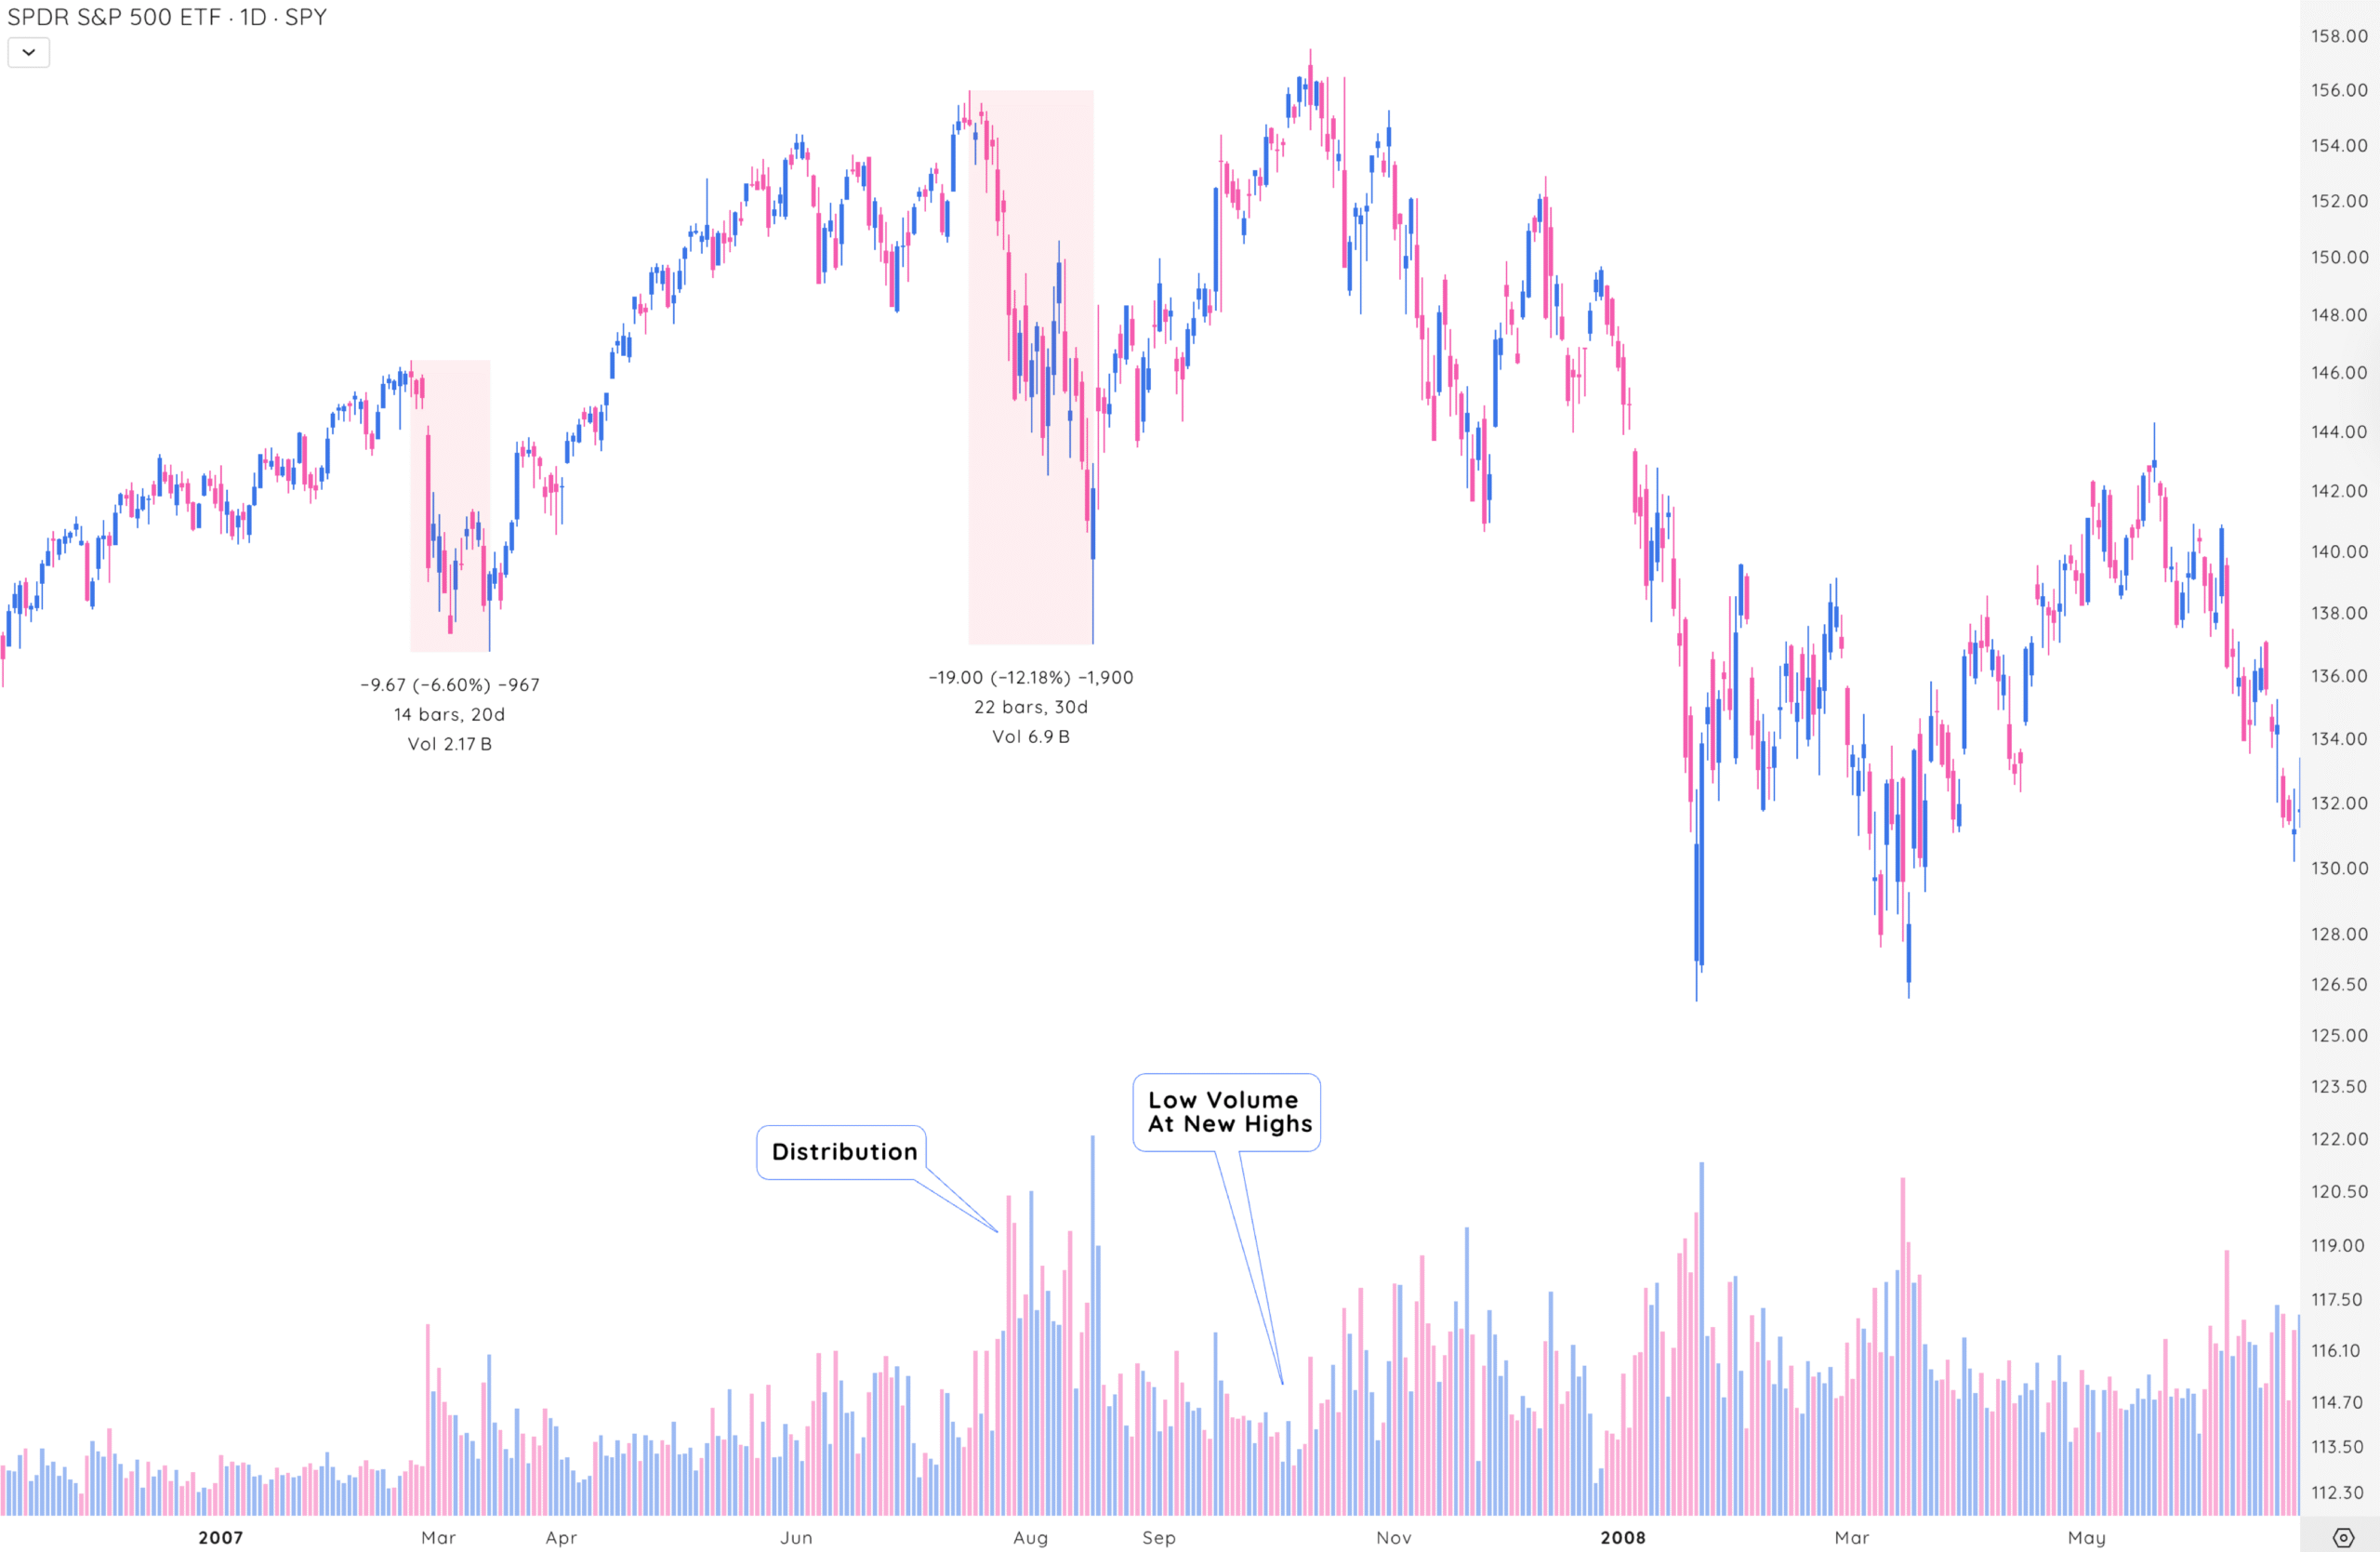
| 10/9/2007 | 3/9/2009 | -56.8% |
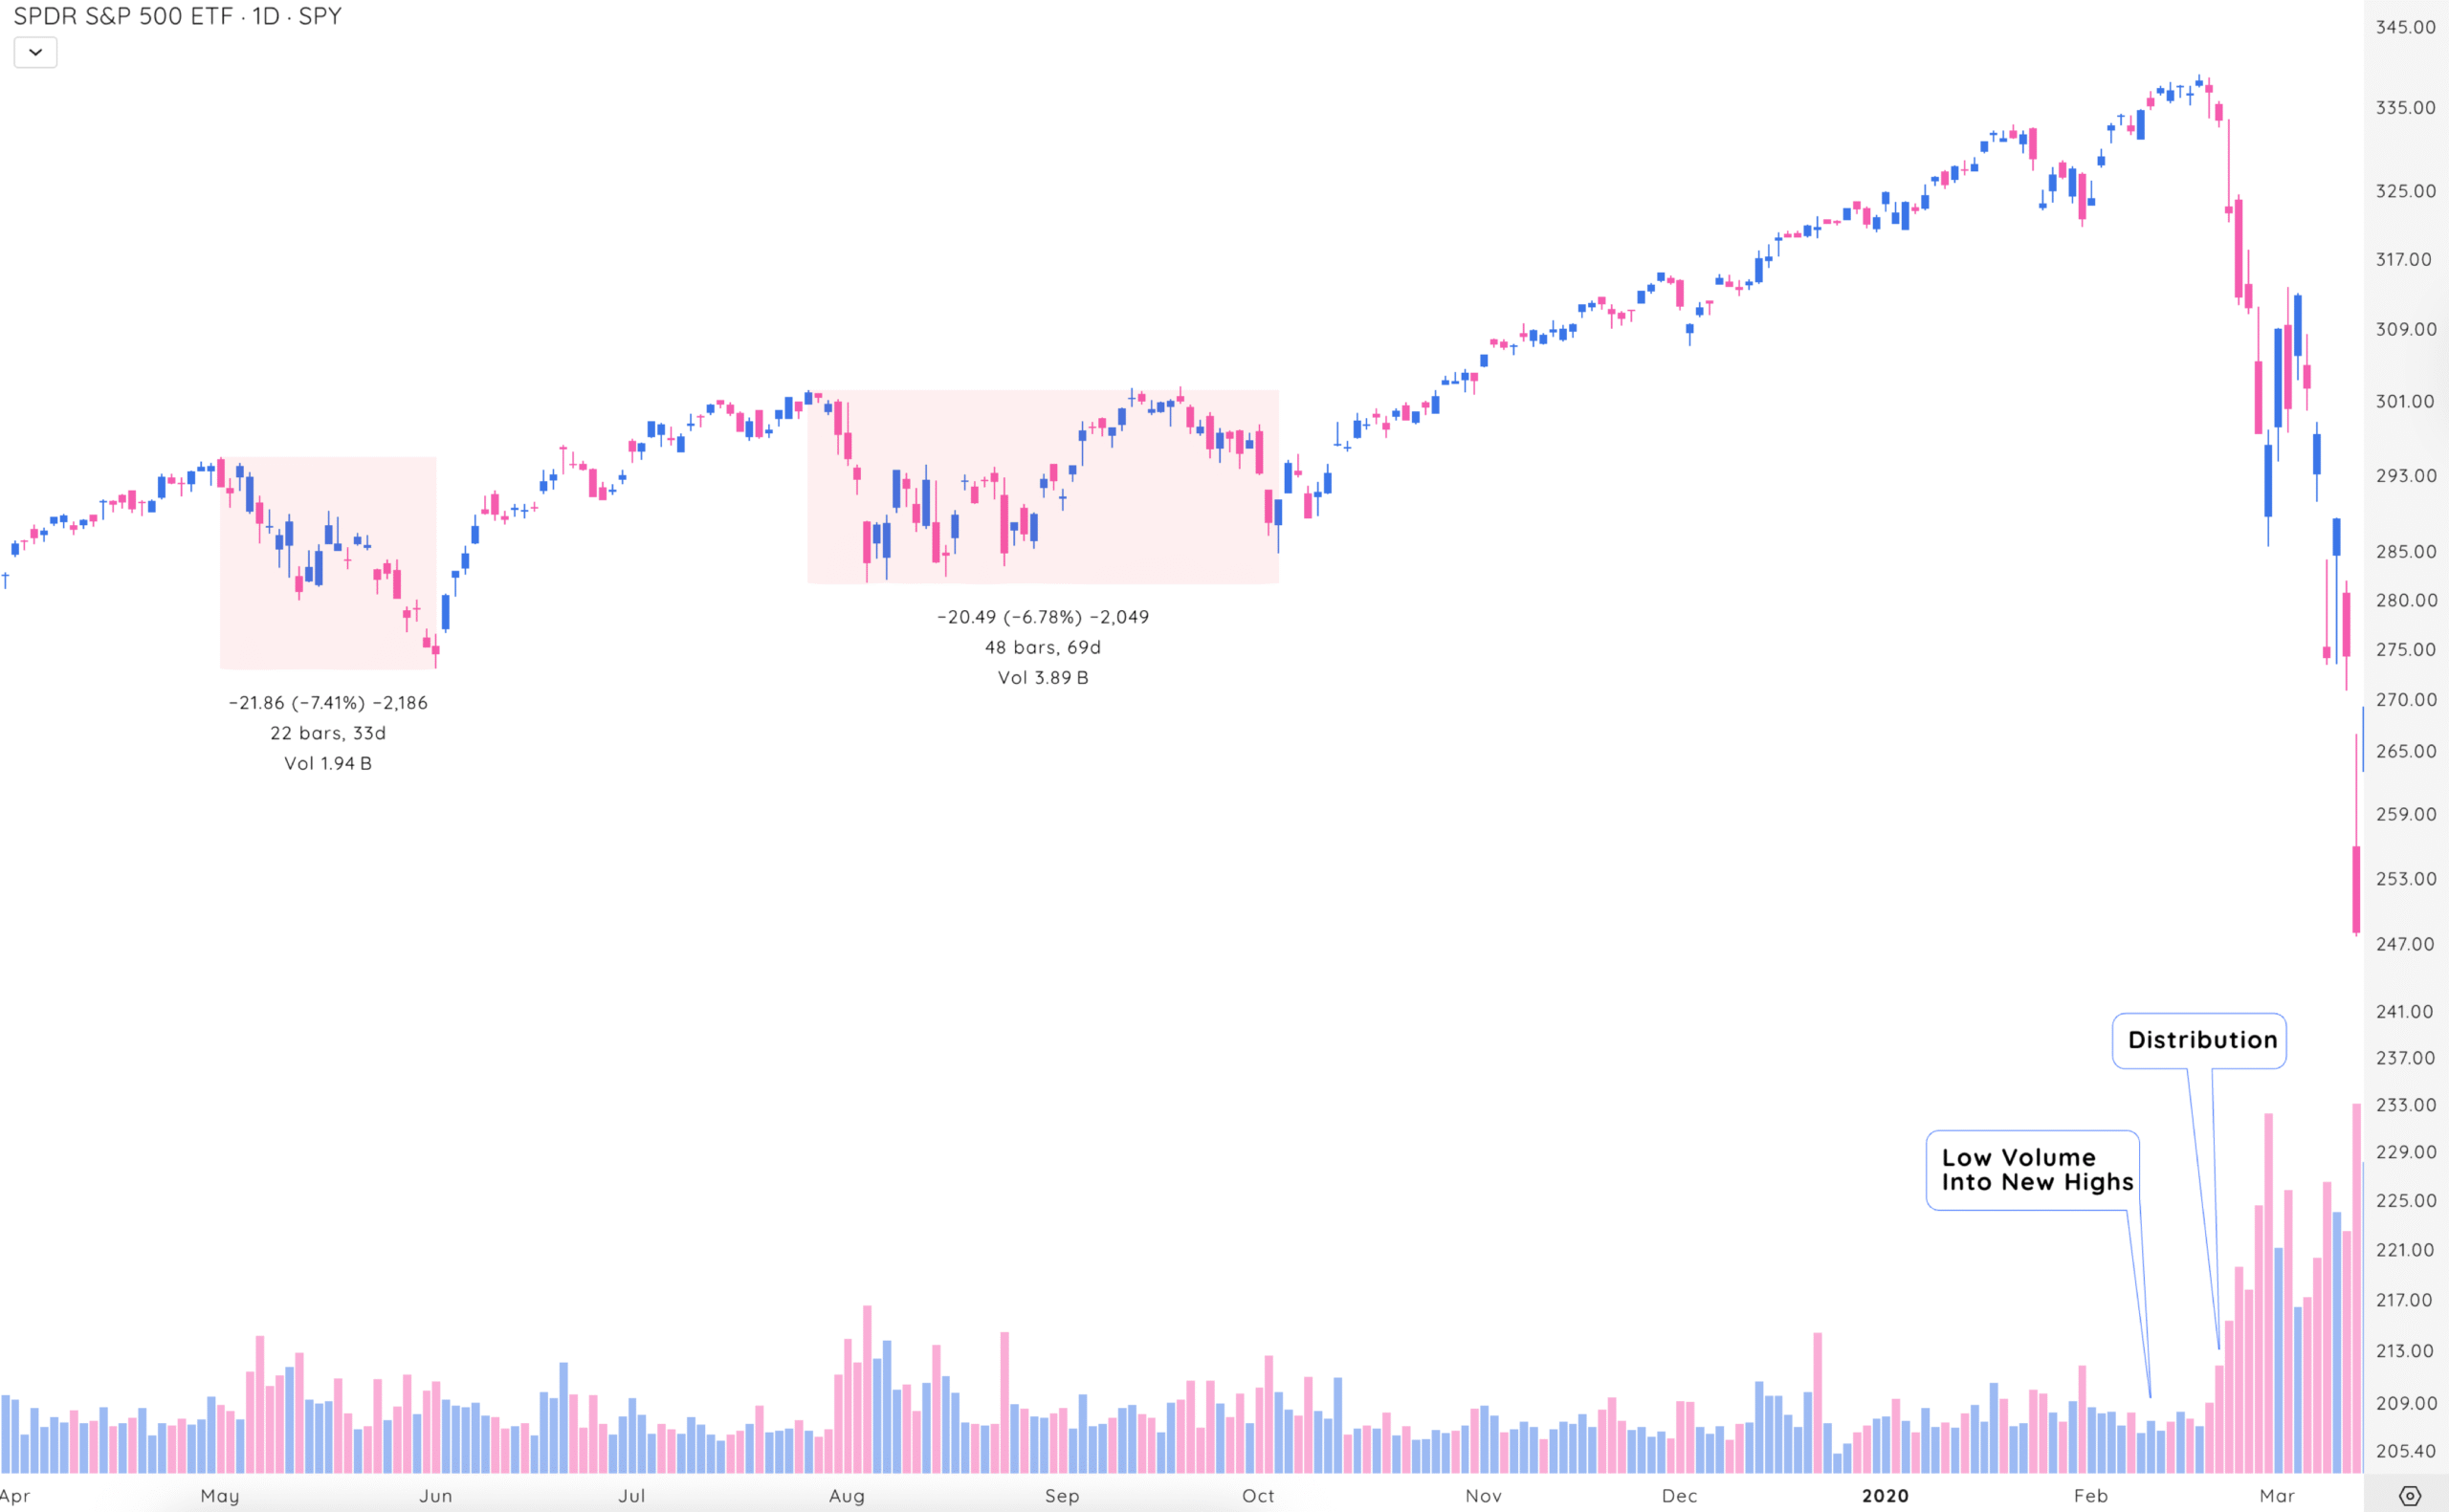
| 2/19/2020 | 3/23/2020 | -33.9% |
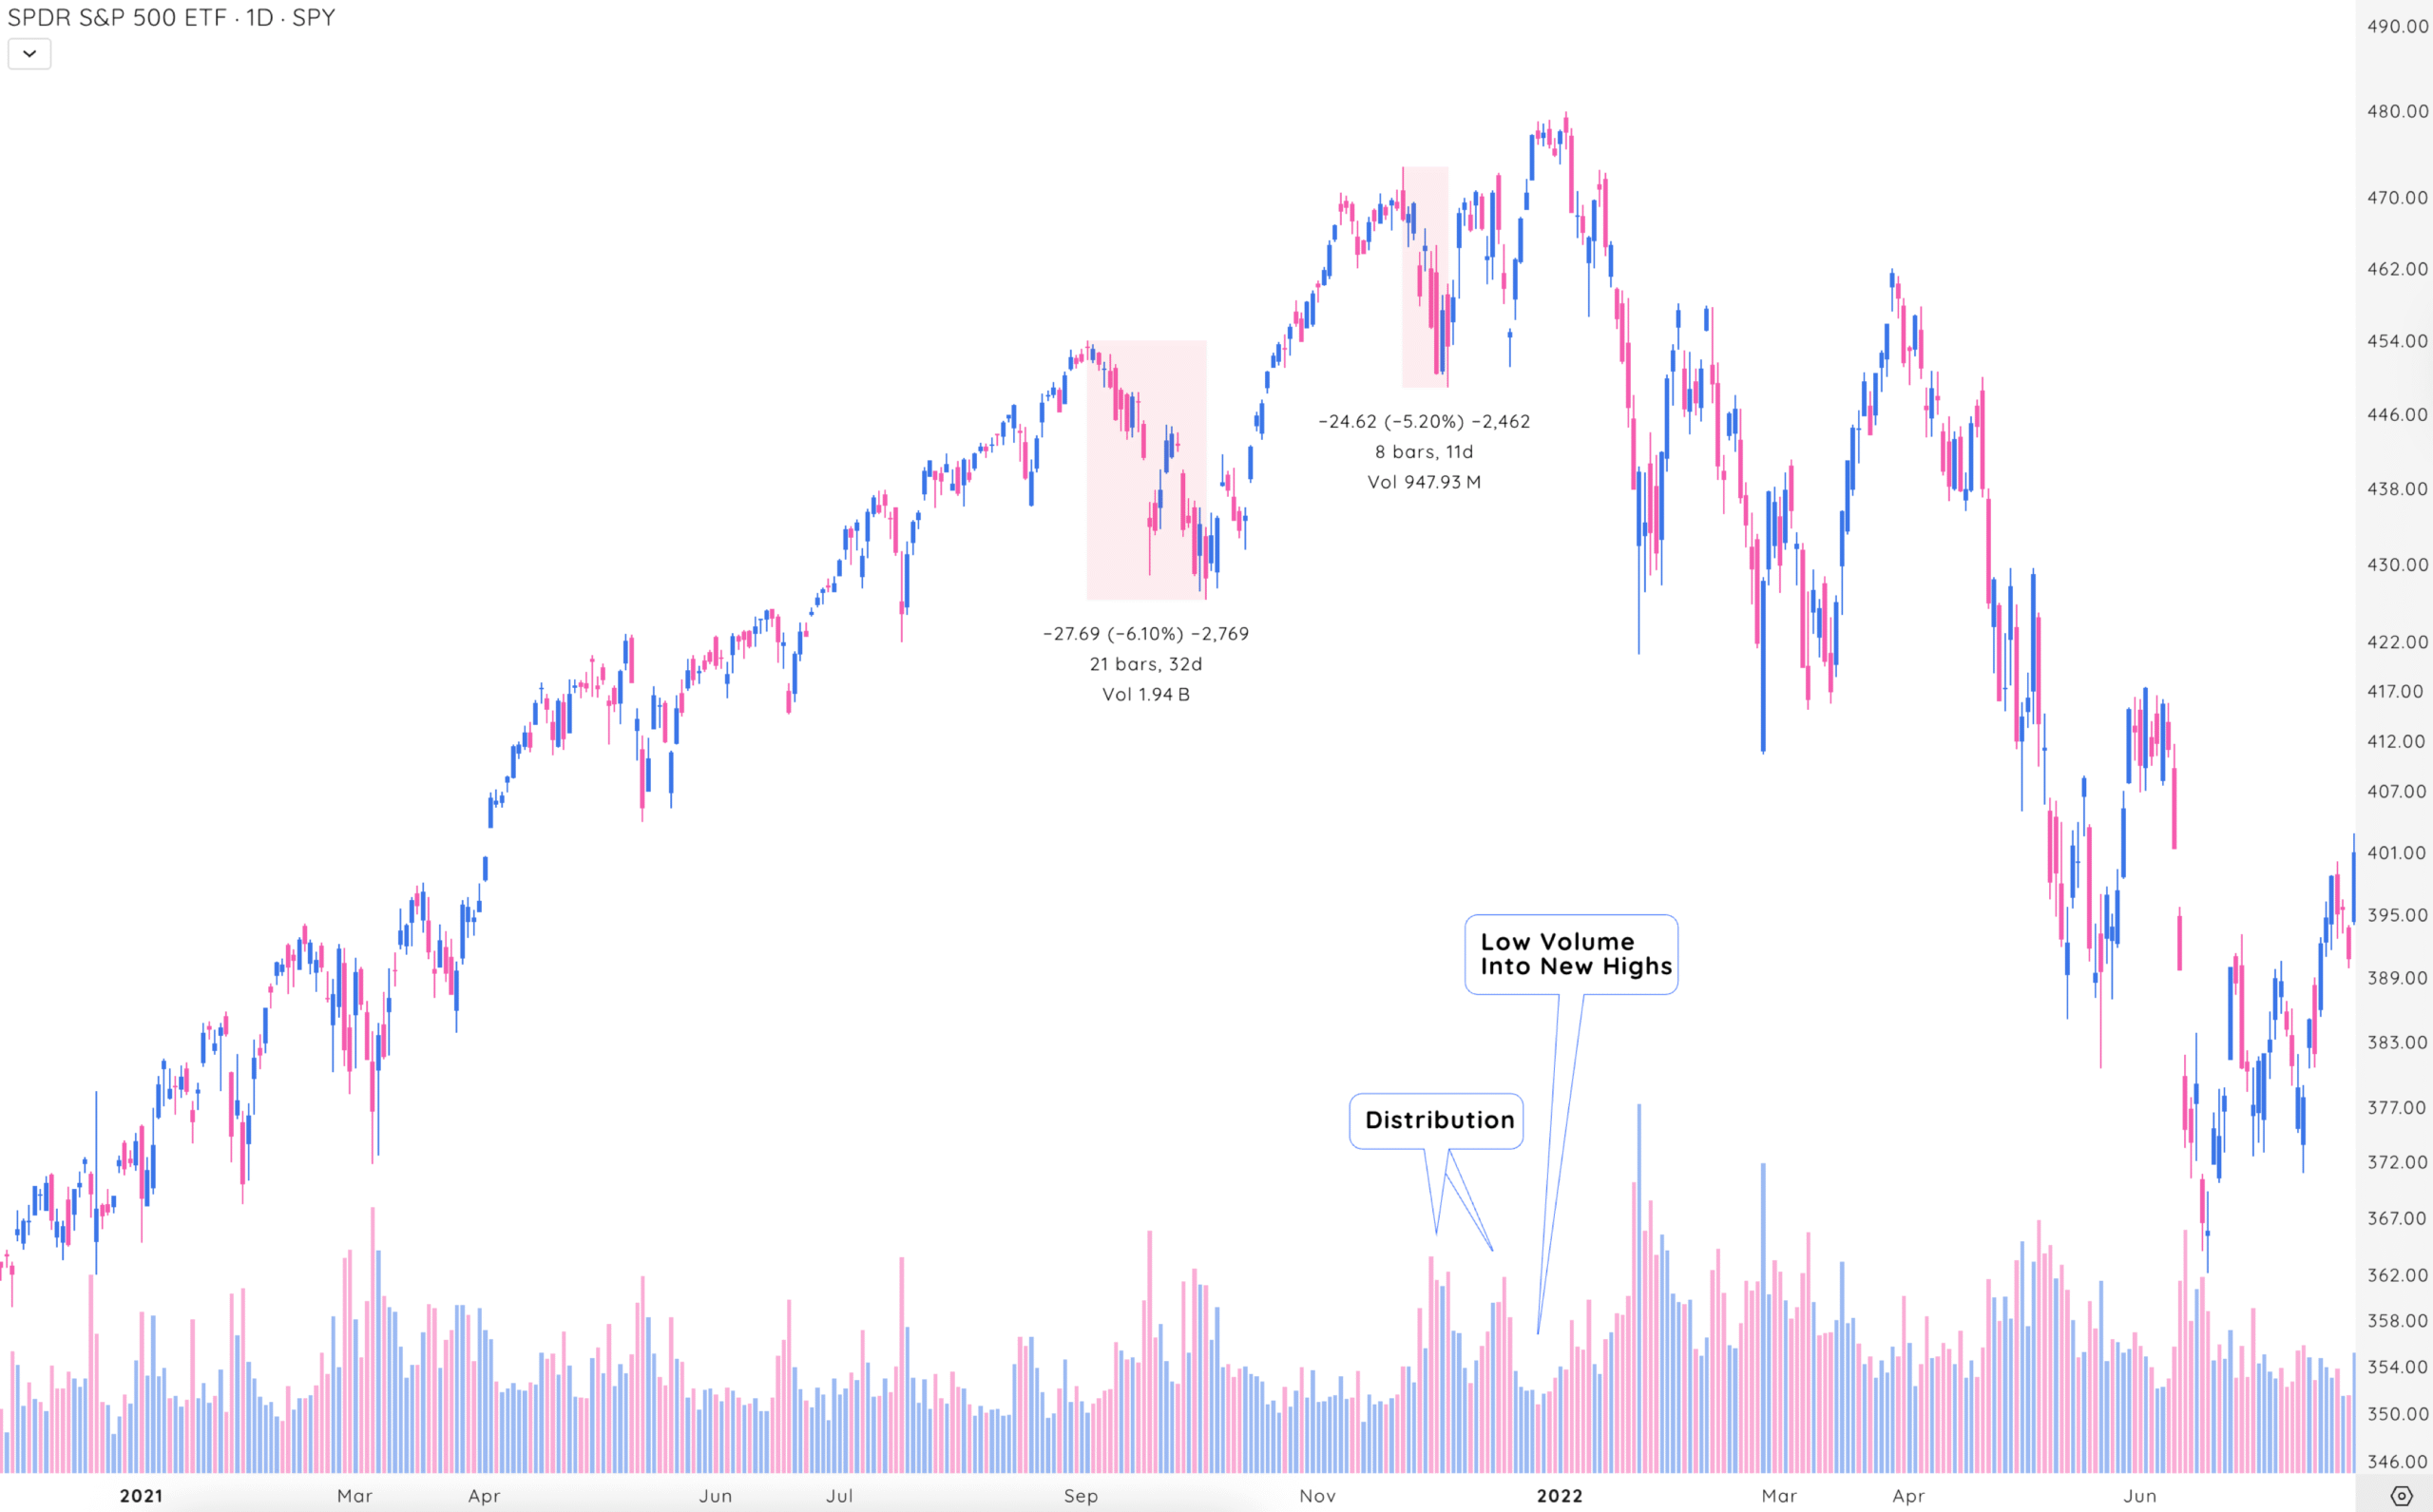
| 1/3/2022 | 10/12/2022 | -25.4% |
Even though the causes were different, they all followed the same basic pattern: too much optimism, rising risk, and eventually a turning point where the market couldn’t ignore the cracks anymore.
Economic lessons from past market tops
Each major market top since 1985 tells a story. Bull markets usually start with strong fundamentals like innovation, growth, or supportive policies. But as momentum builds, risk-taking increases and cracks begin to form. Eventually, those cracks grow into full-blown market reversals.
Let’s walk through the economic dynamics behind five of the biggest tops in recent history.
What drove the 1987 peak?
The early ’80s recession gave way to a strong recovery. From 1982 to 1987, the S&P 500 surged over 250%. Reagan-era tax cuts, deregulation, falling interest rates, and a booming corporate sector fueled the rally.
But by August 1987, warning signs were flashing. Valuations were stretched, and P/E ratios climbed too fast. Rising bond yields and currency issues added pressure.
Then came the final straw: program trading and portfolio insurance strategies caused a cascade of selling on October 19, 1987 – Black Monday.
This crash exposed how vulnerable the market was to automated trading and leverage, even in a strong economy.
Why did the 2000 dot-com bubble burst?
The 1990s were all about the Internet boom. Tech innovation, low inflation, and steady growth under the Clinton administration powered the S&P 500 to rise over 400%.
Venture capital poured into startups, and excitement about the digital future pushed stock prices to extremes. By 2000, valuations were sky-high – The S&P 500’s P/E ratio crossed 40, way above sustainable levels.
The Fed raised interest rates to cool things off, and suddenly the mood shifted. Many tech companies had no real profits.
When they started to fail, the bubble burst. A mild recession followed, made worse by the 9/11 attacks in 2001.
How the 2007 peak led to a financial crisis
After recovering from the dot-com bust, markets boomed again from 2002 to 2007. This time, low interest rates, easy credit, and a red-hot housing market were the main drivers.
Banks packaged risky mortgages into complex financial products, while consumers and investors loaded up on debt. By late 2007, it all started to unravel.
Subprime mortgage defaults surged, revealing systemic risk across the financial system. The crisis escalated fast – banks failed, credit markets froze, and the economy slid into the Great Recession.
This stock market top exposed the dangers of unregulated innovation and too much leverage.
What triggered the 2020 pandemic crash?
This bull market, March 2009 to February 2020, was the longest in U.S. history. Fueled by post-2008 stimulus, low interest rates, and strong tech sector growth, the S&P 500 climbed over 400%.
Corporate profits grew steadily, and unemployment stayed low. Then COVID-19 hit.
The pandemic caused a global shutdown. Travel stopped, factories closed, and consumer demand collapsed. Oil prices crashed due to a price war between Saudi Arabia and Russia.
The result? A rapid 33.9% drop in the S&P 500 in just over a month. It was a reminder that external shocks can end bull markets instantly, no matter how strong the fundamentals seem.
What led to the 2022 inflation-driven top
After the COVID crash, the market bounced back fast. From March 2020 to January 2022, the S&P 500 more than doubled. Stimulus checks, low rates, and vaccine rollouts drove a V-shaped recovery. Tech and consumer stocks thrived.
But then inflation surged. Supply chain issues, energy price spikes (especially after Russia’s invasion of Ukraine), and labor shortages pushed prices higher.
The Fed responded with aggressive rate hikes, tightening financial conditions. Overvalued stocks took the biggest hit, and the market fell into bear territory.
This was a reminder that inflation and rising rates can slow down even the fastest recoveries.
Why the economic context drives market tops
Stock market tops aren’t random – they’re tied to economic shifts. Bull markets thrive when things like low interest rates, government stimulus, or innovation fuel growth. But those same factors can create imbalances like asset bubbles, unsustainable debt, or runaway inflation.
Eventually, something triggers a reversal:
- Central banks raise interest rates
- Geopolitical conflicts emerge
- Unexpected events (like a pandemic) shock the system
For example, while the 1987 crash was made worse by trading mechanics, it started with excessive leverage and rising rates. The 2022 decline? Driven by persistent inflation and the Fed’s policy shift.
If you understand these underlying trends, you’re better equipped to read the market – not by guessing tops, but by recognizing when the environment is changing.
Can we rely on market top indicators?
Sort of, but don’t put too much faith in them.
Market indicators can give helpful signals, but they’re not perfect. Some of the most watched include:
- High valuations: P/E or CAPE ratios getting too high
- Extreme sentiment: Surveys showing too much bullishness or low volatility (like a low VIX)
- Economic warnings: Yield curve inversions, rising unemployment, or slowing GDP
- Policy changes: Interest rate hikes or the end of stimulus programs
These indicators showed up before the 2000 and 2022 tops, but the market can stay inflated longer than you’d expect. And sometimes, an unexpected event can throw everything off course.
Instead of relying on predictions, focus on:
- Watching the big picture
- Managing risk with tools like stop-losses
- Diversifying your portfolio
Taking a closer look at key market tops
Each one followed a strong bull run based on real economic momentum. But each also ended when that momentum was stretched too far or hit by a major shock.
Final thoughts on stock market top dynamics
Here’s what we’ve learned:
- Since 1985, there have been five major bear markets with declines of 20% or more.
- Each one followed a bull market driven by something positive—like policy easing, tech breakthroughs, or post-recession recoveries.
- The declines weren’t random – they were triggered by rising risks: overvaluation, leverage, inflation, or global crises.
- Markets are shaped by economic forces, not simple cycles or technical patterns.
You can’t time the top perfectly. But by understanding macro trends and staying alert to warning signs, you can build a strategy that helps you ride the gains and manage the downturns.


