What Is The Double Bottom Pattern?
Nick Schmidt
Nick Schmidt is a co-founder of TraderLion and Deepvue with over 10 years of market experience. Adopting a “less is more” philosophy, he focuses on weekly charts with an emphasis on price and volume.
Published: January 3, 2021
What is the Double Bottom Pattern?
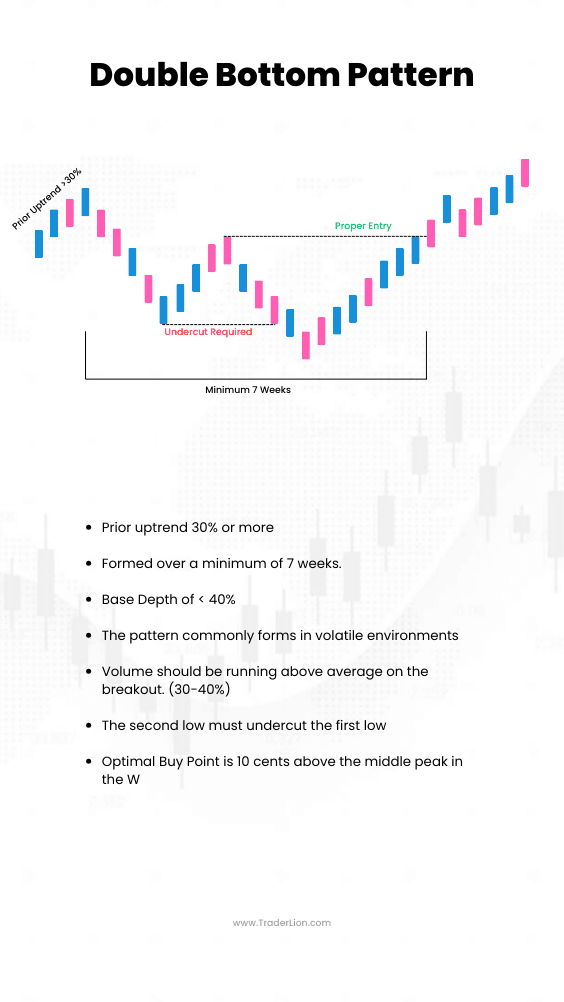
The Double Bottom is one of the most common chart patterns. The shape represents an uneven “W” with the second low always undercutting the first low.
After making a new high, the price pulls back and makes the first low. The price reverses upward until it finds resistance and makes a lower high. Then the stock falls again, now undercutting the first pullback, and makes a lower low.
The formation represents the shape of a “W”. The peak in the middle of the W is your resistance that you are looking to break after you reverse higher from the second low.
The official buy point is signaled when the price reclaims the first lower high, through the midpoint of the W-formation.
Never miss a post.
Sign up to get instant notifications when we publish a new post.
The double bottom pattern, just like the cup and handle pattern, is a traditional base formation defined as part of CANSLIM investing.
Double Bottom Pattern Characteristics
A traditional base is formed over a minimum of 7 weeks and after a prior uptrend of at least 30%. The depth of the base from the peak of the prior uptrend to the bottom of the second low should be 40% or less.
- The double bottom is a bullish continuation pattern.
- Prior uptrend 30% or more
- Formed over a minimum of 7 weeks.
- Base Depth of < 40%
- The pattern commonly forms in volatile environments
- Volume should be running above average on the breakout. (30-40%)
- The second low must undercut the first low
- Optimal Buy Point is through the middle peak in the W
Double Bottom Pattern Psychology
Double Bottoms are generally formed during volatile conditions which you can clearly see by the shape of the pattern. Institutional Investors control the market movements and will put selling pressure on stocks to purchase cheaper shares when retail traders capitulate.
If a stock begins to advance too quickly, institutions may begin to sell their stock to control the movement of the price. When the first lower low is undercut most retail traders will get stopped out of their positions as the price drops below an obvious level.
The purpose of the second low in the double bottom is to shake out “weak hands” by undercutting the first low before it is ready to officially break out.
If the second low doesn’t undercut the first low, this is not a double bottom and is failure-prone as smaller traders are still occupying their positions.
Double Bottom Pattern Success Rate
The success of a Double Bottom pattern depends on various factors. Including market volatility, market direction, trading volume, and the time frame of the pattern’s formation.
This pattern has a higher success rate if there’s a rise in volume at the breakout. To increase the likelihood of success volume during the breakout should be 30% or more above average signaling strong buyer interest.
Additionally, double bottom patterns that form over a longer timeframe are usually more reliable compared to similar formations on shorter timeframes.
Try our free position size calculator to help determine how many shares to buy.
Alternative Early Entry: Shakeout +3
Based on the strategies of famous trader Jesse Livermore, The Shakeout +3 is a technique used in a Double Bottom base for an early entry, helping traders profit from the pattern sooner than usual.
The technique involves entering the trade when the price increases by about three points, or 10%, from the first low. This early entry occurs before the traditional breakout level.
The technique is a more advanced entry point and can vary with the stock price. The crucial factor is a significant rise from the first low, indicating demand and a likelihood of price increase.
This strategy is valuable for traders looking to maximize their position by acting on early signs of demand. The Shakeout +3 allows for early entry, which can lead to higher profits.
Double Bottom Pattern Examples
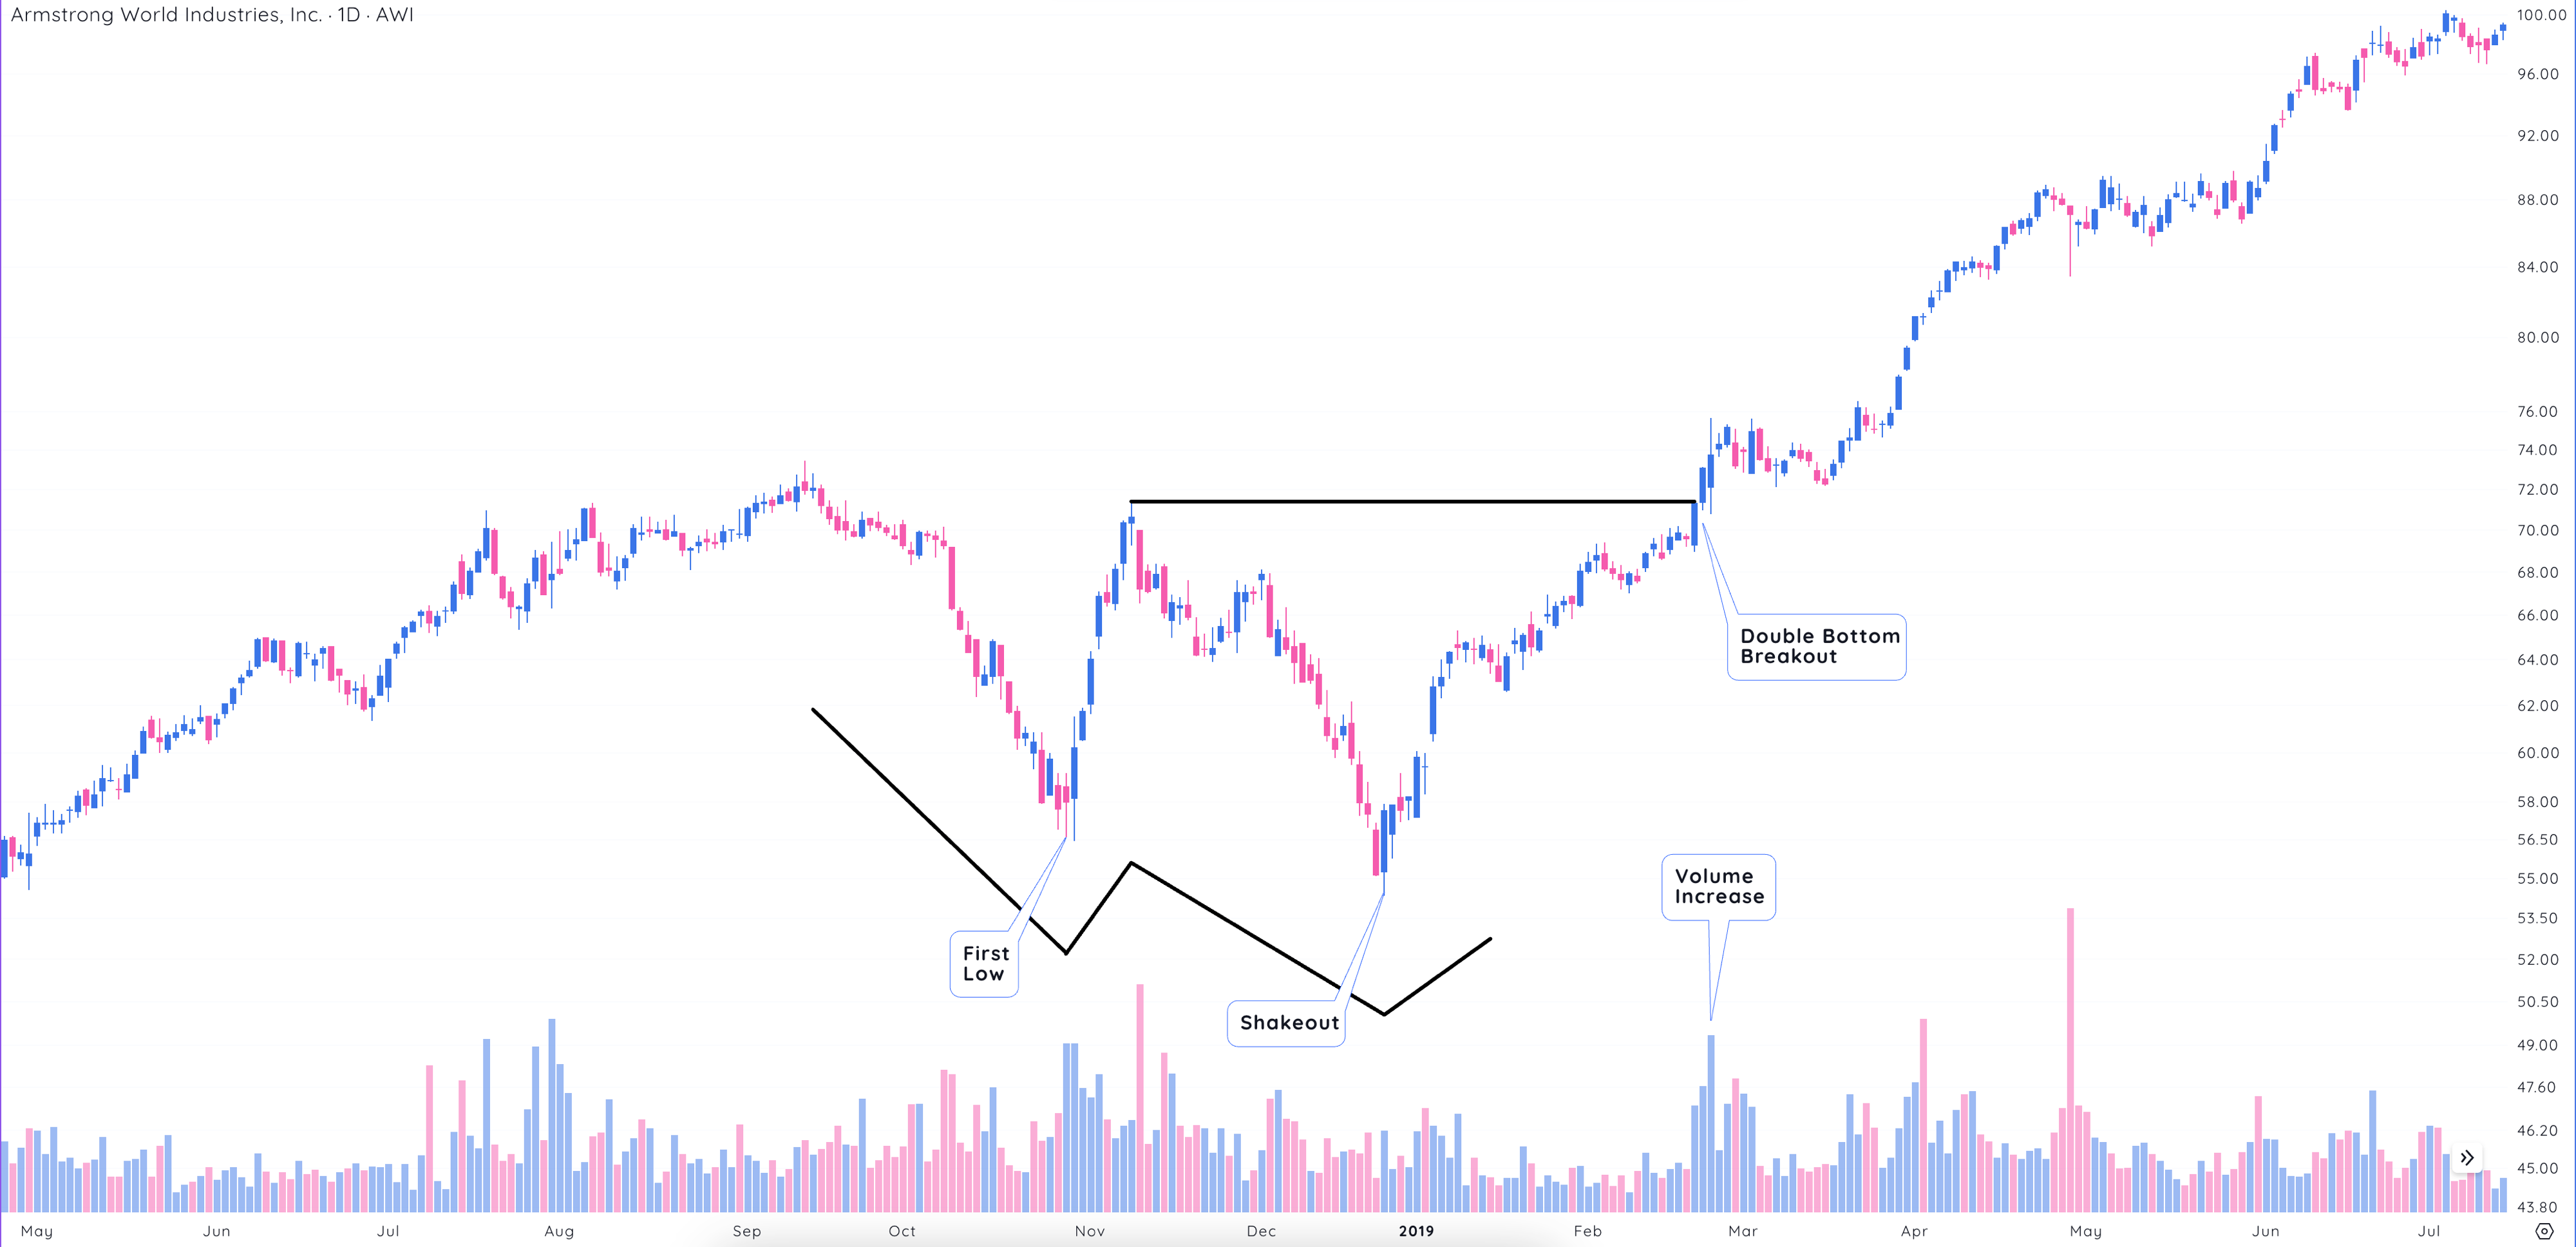
AWI formed a traditional Double Bottom pattern after it quickly recovered after a shakeout new low. Note the increase in volume as it moved through the middle of the W-formation.
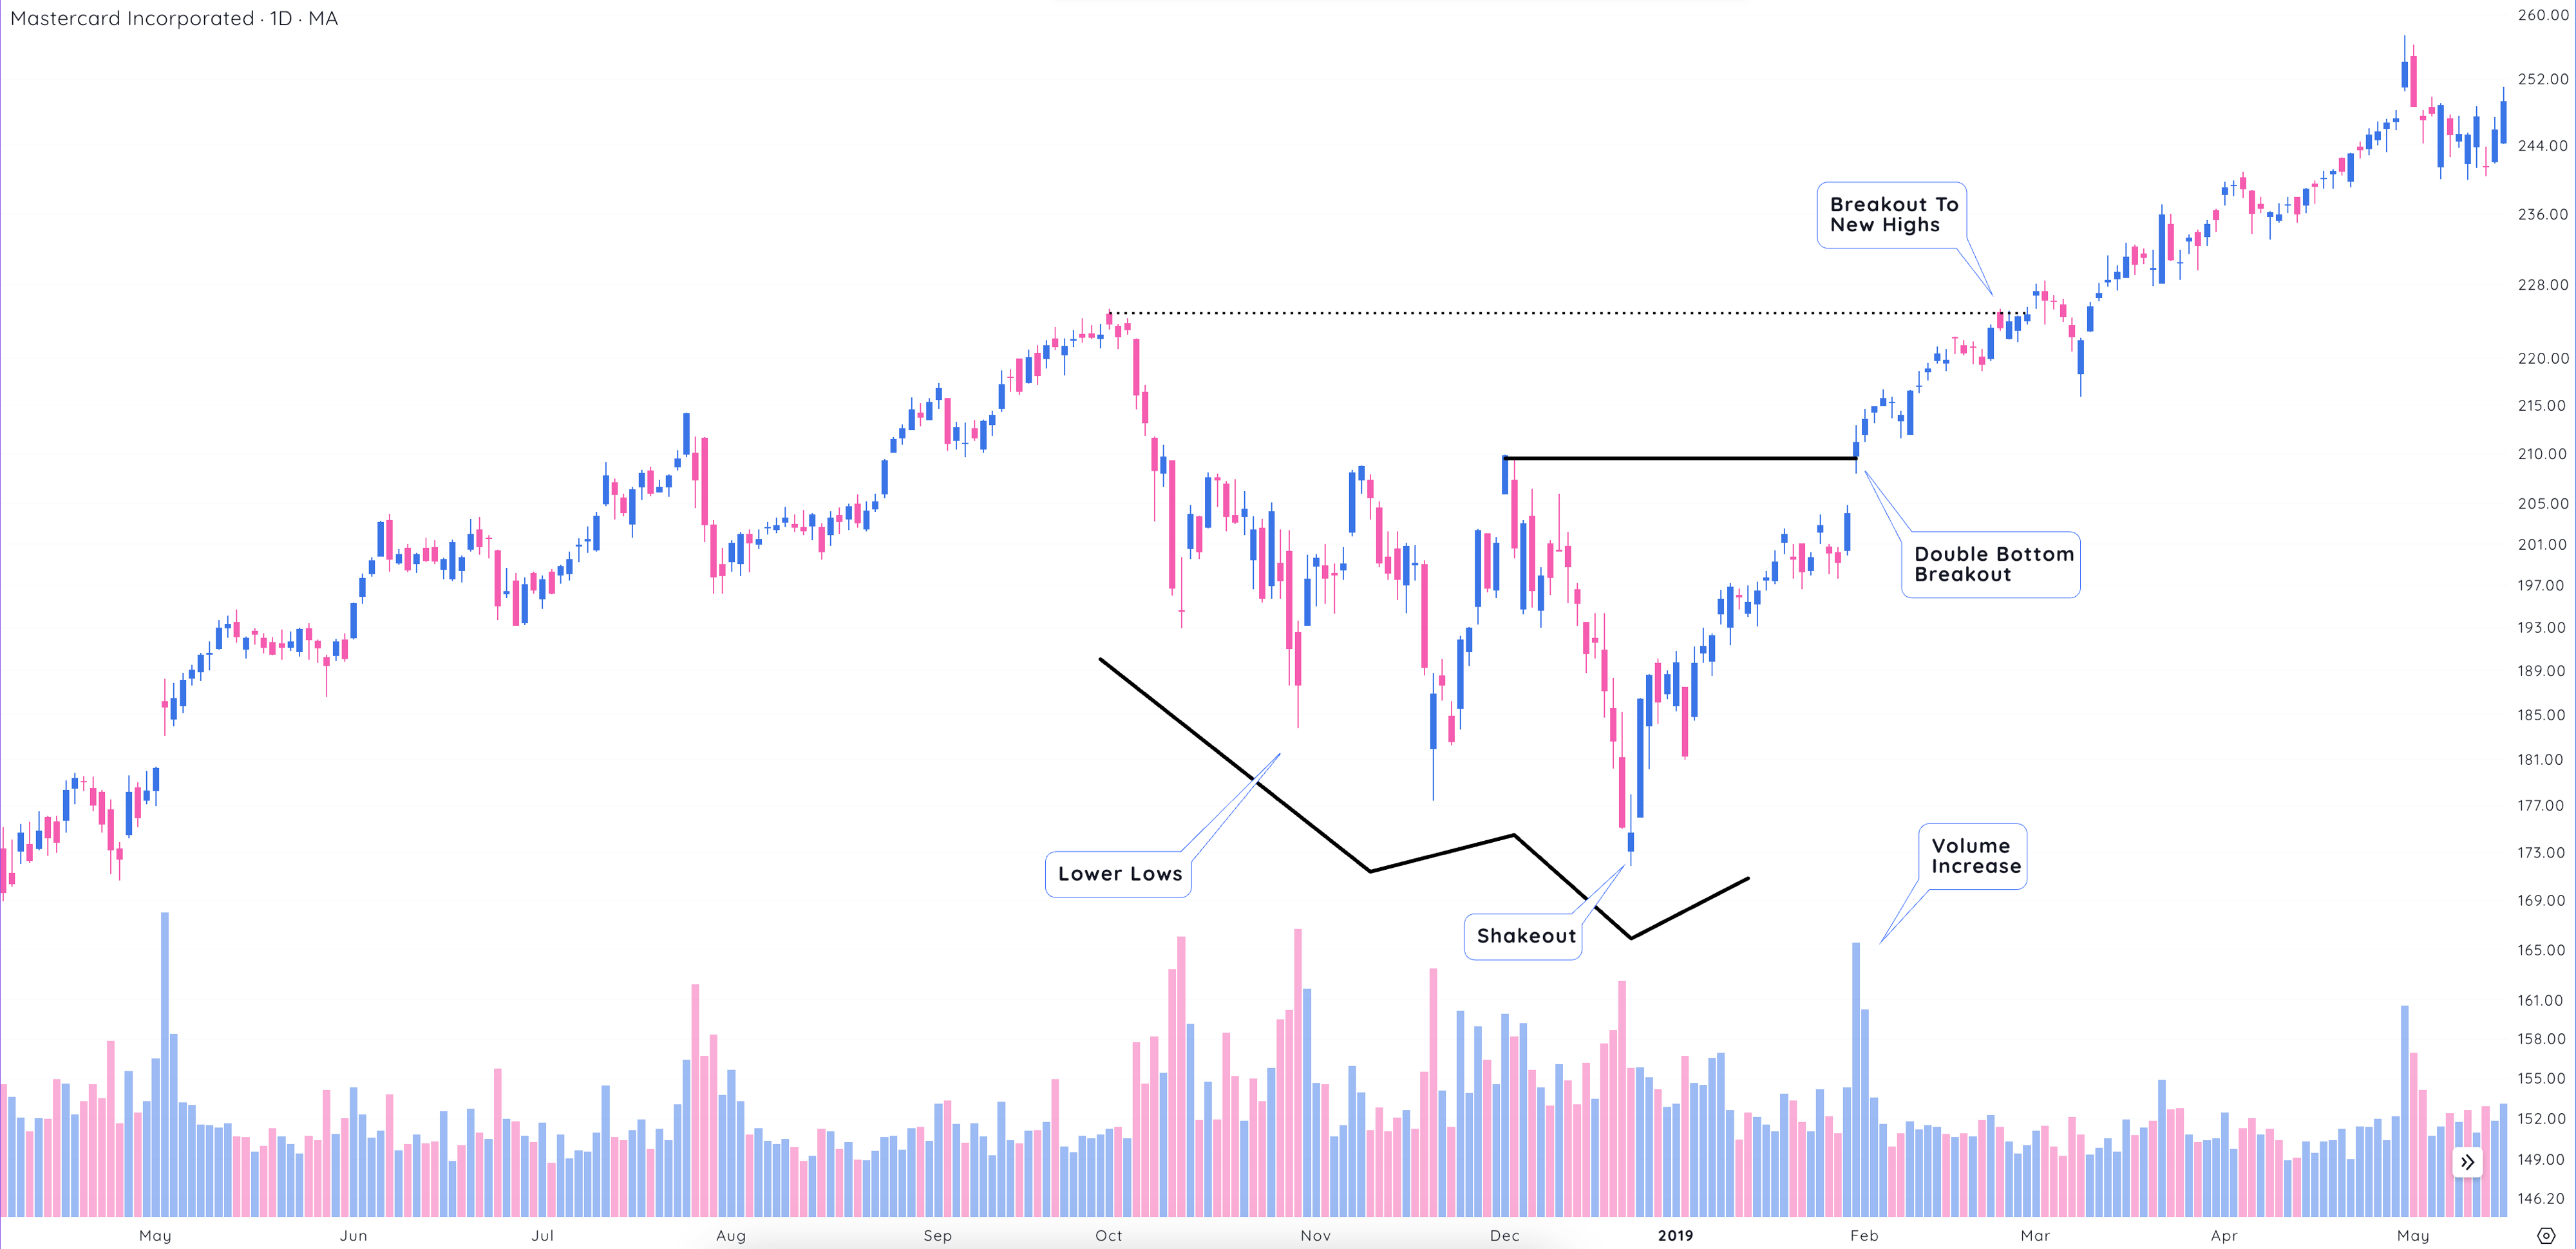
MA continued to make lower lows in a short timeframe but failed to see the follow-through to the upside. When the base matured, strength was found when the price gapped through the middle of the W.
Jump to: What is the Head and Shoulders Pattern?


