How to Analyze Stock Industry Group Strength and Why It Matters
Ross
Ross is a co-founder of TraderLion and Deepvue. He was mentored by William O’Neil, and co-authored The Model Book of Greatest Stock Market Winners at WON + Co.
Published: June 16, 2022
Never miss a new post from Ross Haber!
Stay in the loop by subscribing to the email list.
Identifying Industry Groups Is Key To Stock Market Success
Analyzing stock industry groups is a critical step for any investor looking to maximize gains. It’s not just about finding the right stock but also about understanding the strength and relevance of the group it belongs to. Let’s break down the key factors that make this process effective.
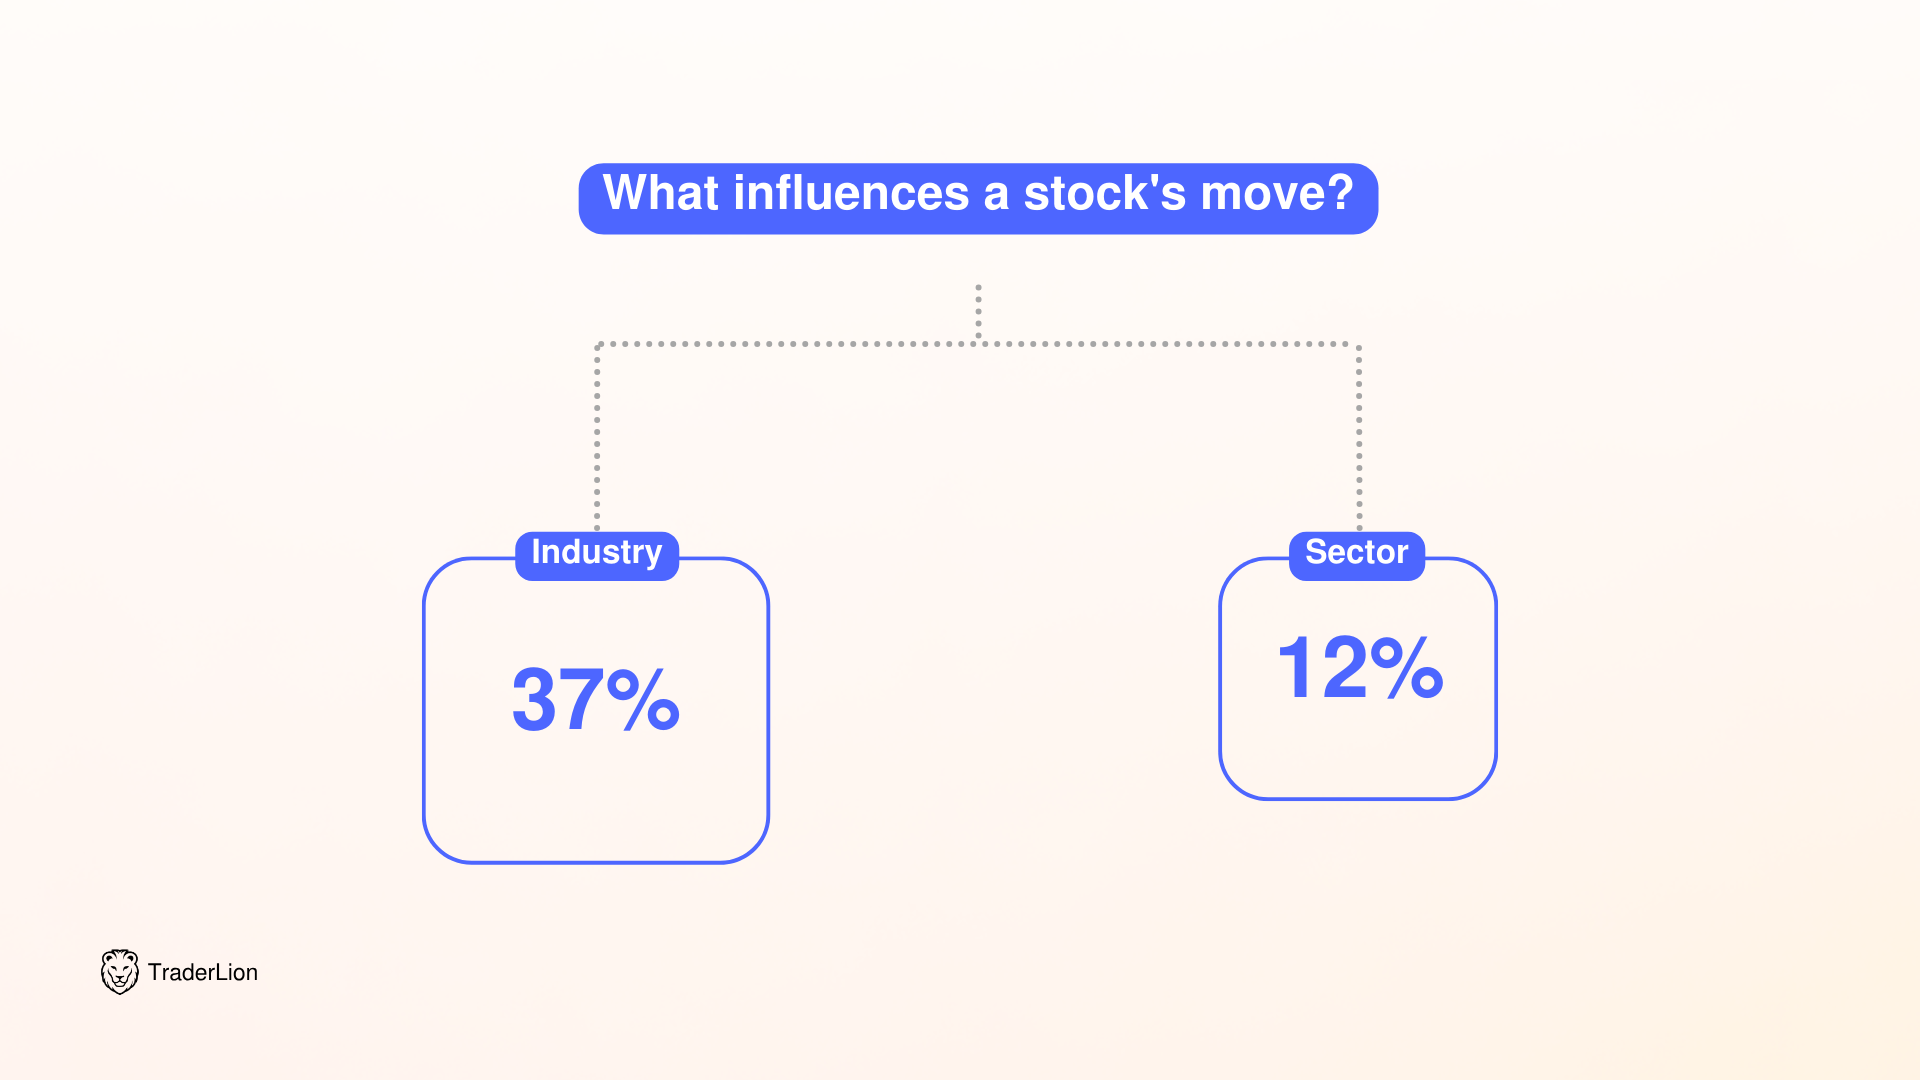
💡 37% of a stock’s move is related to its industry and 12% of the move is related to the sector.
With nearly 50% of a stock move tied to its sector and industry group, it is extremely important to identify the strongest stock in the strongest sector. A leading stock will vastly outperform when there is supportive strength from related stocks in the same industry.

Why Industry Group Strength Matters
When the overall market is in a healthy uptrend, identifying the strongest industry groups is the next logical step. These groups often lead the way higher and contain the stocks most likely to perform well.
The overall performance of a stock is heavily influenced by the strength or weakness of its industry group. Stocks in strong-performing groups tend to outperform the market, while those in weak groups often underperform.
Even a fundamentally strong stock may struggle if it belongs to a weak industry group, while a moderately strong stock in a leading group can outperform.
Stocks within strong industry groups benefit from collective momentum, as the group’s overall strength attracts institutional investors. This creates a reinforcing cycle of buying activity that propels the group higher, benefiting the individual stocks.
Industry group strength helps investors avoid underperforming sectors. Weak groups drag down their constituent stocks, regardless of individual technical patterns, leading to poor performance overall.
Identifying The Strongest Stocks
Popularized by Stan Weinstein, top-down approach as a strategic framework for analyzing and investing in the stock market. This method emphasizes starting with a broad market analysis and then narrowing the focus to individual sectors, groups, and finally, specific stocks.
Assess the Overall Market:
- Begin by evaluating the general market’s condition using major market indices and technical indicators.
- Determine whether the market is in a bull phase, bear phase, or transitional stage.
Identify Leading Industry Groups:
- After gauging the market’s trend, shift your focus to identifying the strongest and weakest sectors or industry groups.
- Use tools such as relative strength analysis and stage analysis to pinpoint groups in bullish trends while avoiding those in bearish trends.
Select Stocks Within Strong Groups:
- Once strong groups are identified, drill down to analyze individual stocks within these groups.
- Favor stocks that are set up in sound-basing structures and exhibit increasing relative strength and volume.
Avoid Weak Sectors and Stocks:
- The top-down approach not only highlights opportunities but also helps avoid pitfalls. By steering clear of stocks in declining or weak sectors, investors can reduce risk and focus on high-probability setups.
By aligning with broader market and group trends, the approach minimizes exposure to stocks that might perform poorly due to weak sector momentum. Concentrate your efforts on the areas of the market most likely to yield positive returns.
What To Look For In Leading Industry Groups
Which Groups Are Leading The Market?
Focus on areas of traditional growth. Groups like computer hardware, semiconductors, software, medical equipment, biotech, specialty retail, and financials often lead during uptrends.
How Big Is The Industry Group?
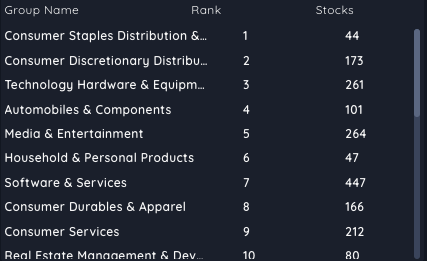
Larger groups with many stocks are better candidates for strong moves because they indicate broad participation. If the group is smaller, check if related groups in the same sector also show strength. In the screenshot below from Deepvue, you can see that Technology Hardware & Equipment is much larger than Consumer Staples.

Technical Patterns
Look for clear and robust chart patterns within the group. Groups with multiple stocks showing bullish signals often outperform. Some popular patterns that are known to be strong and reliable include the cup and handle pattern, the high tight flag pattern, and the flat base pattern.
Relative Strength
Assess the relative strength (RS) line for the group. A rising RS line indicates that the group is outperforming the broader market, a key signal of leadership.
Consistency Across Stocks
Groups, where most or all stocks exhibit bullish patterns, are strong candidates for trading. This uniformity suggests underlying momentum within the sector. Remember 49% of a stock’s move is related to it’s group. Noticing similar setups across many different stocks in a group helps you identify emerging themes.
Using Sector ETFs To Identify Leaders
Using ETFs makes it easier to analyze market trends, identify strong sectors, and align with industry group momentum.
Begin by analyzing the overall market using broad-based index ETFs like SPY (S&P 500) or QQQ (Nasdaq). Look at the price trends to determine if the market is in a bullish or bearish phase.
Sector ETFs like XLF (financials) or XLK (technology) help you zoom in on specific areas of the market. Use relative strength analysis to compare these ETFs against the overall market or each other – Focus on sectors outperforming the indices.
To dig deeper, use industry-specific or thematic ETFs like ITB (homebuilders) or SMH (semiconductors). Check their charts to see which group is outperforming others with positive price action and supportive volume.
Once you’ve identified a strong sector or industry group through ETFs, take a closer look at the ETF’s holdings. Use this list as a guide to find individual stocks with solid potential within the group.
Applying Relative Strength To Find The Strongest Stocks
Relative Strength (RS) gauges a stock’s performance against a major benchmark, such as the S&P 500 or Nasdaq. By integrating the RS Rating into technical analysis, investors can pinpoint stocks that are outperforming the general market movement.
Stocks with high Relative Strength are often leaders in the market. These are the stocks that tend to deliver outsized gains, especially in a market uptrend. By targeting high-RS stocks, you’re aligning your portfolio with momentum, which is critical for achieving super performance during each market cycle.
Monitor Relative Strength By Industry Groups
Start by analyzing the Relative Strength of industry groups versus major indices. This helps you determine which sectors are leading the market.
Strong industry groups provide an ideal area to identify individual stocks exhibiting significant momentum.
Compare Individual Stocks To Their Industry Groups
Once you’ve identified the leading sectors, compare the Relative Strength of individual stocks within those groups. The strongest stocks will have both a high RS Rating and belong to a top-performing group.
This dual layer of strength increases the likelihood of finding market leaders.
Market Navigation Tools
Navigating the stock market effectively requires the right tools and a clear strategy. By leveraging stock research tools like Deepvue and focusing on key metrics like Relative Strength (RS), you can identify emerging market themes and strong industry groups.
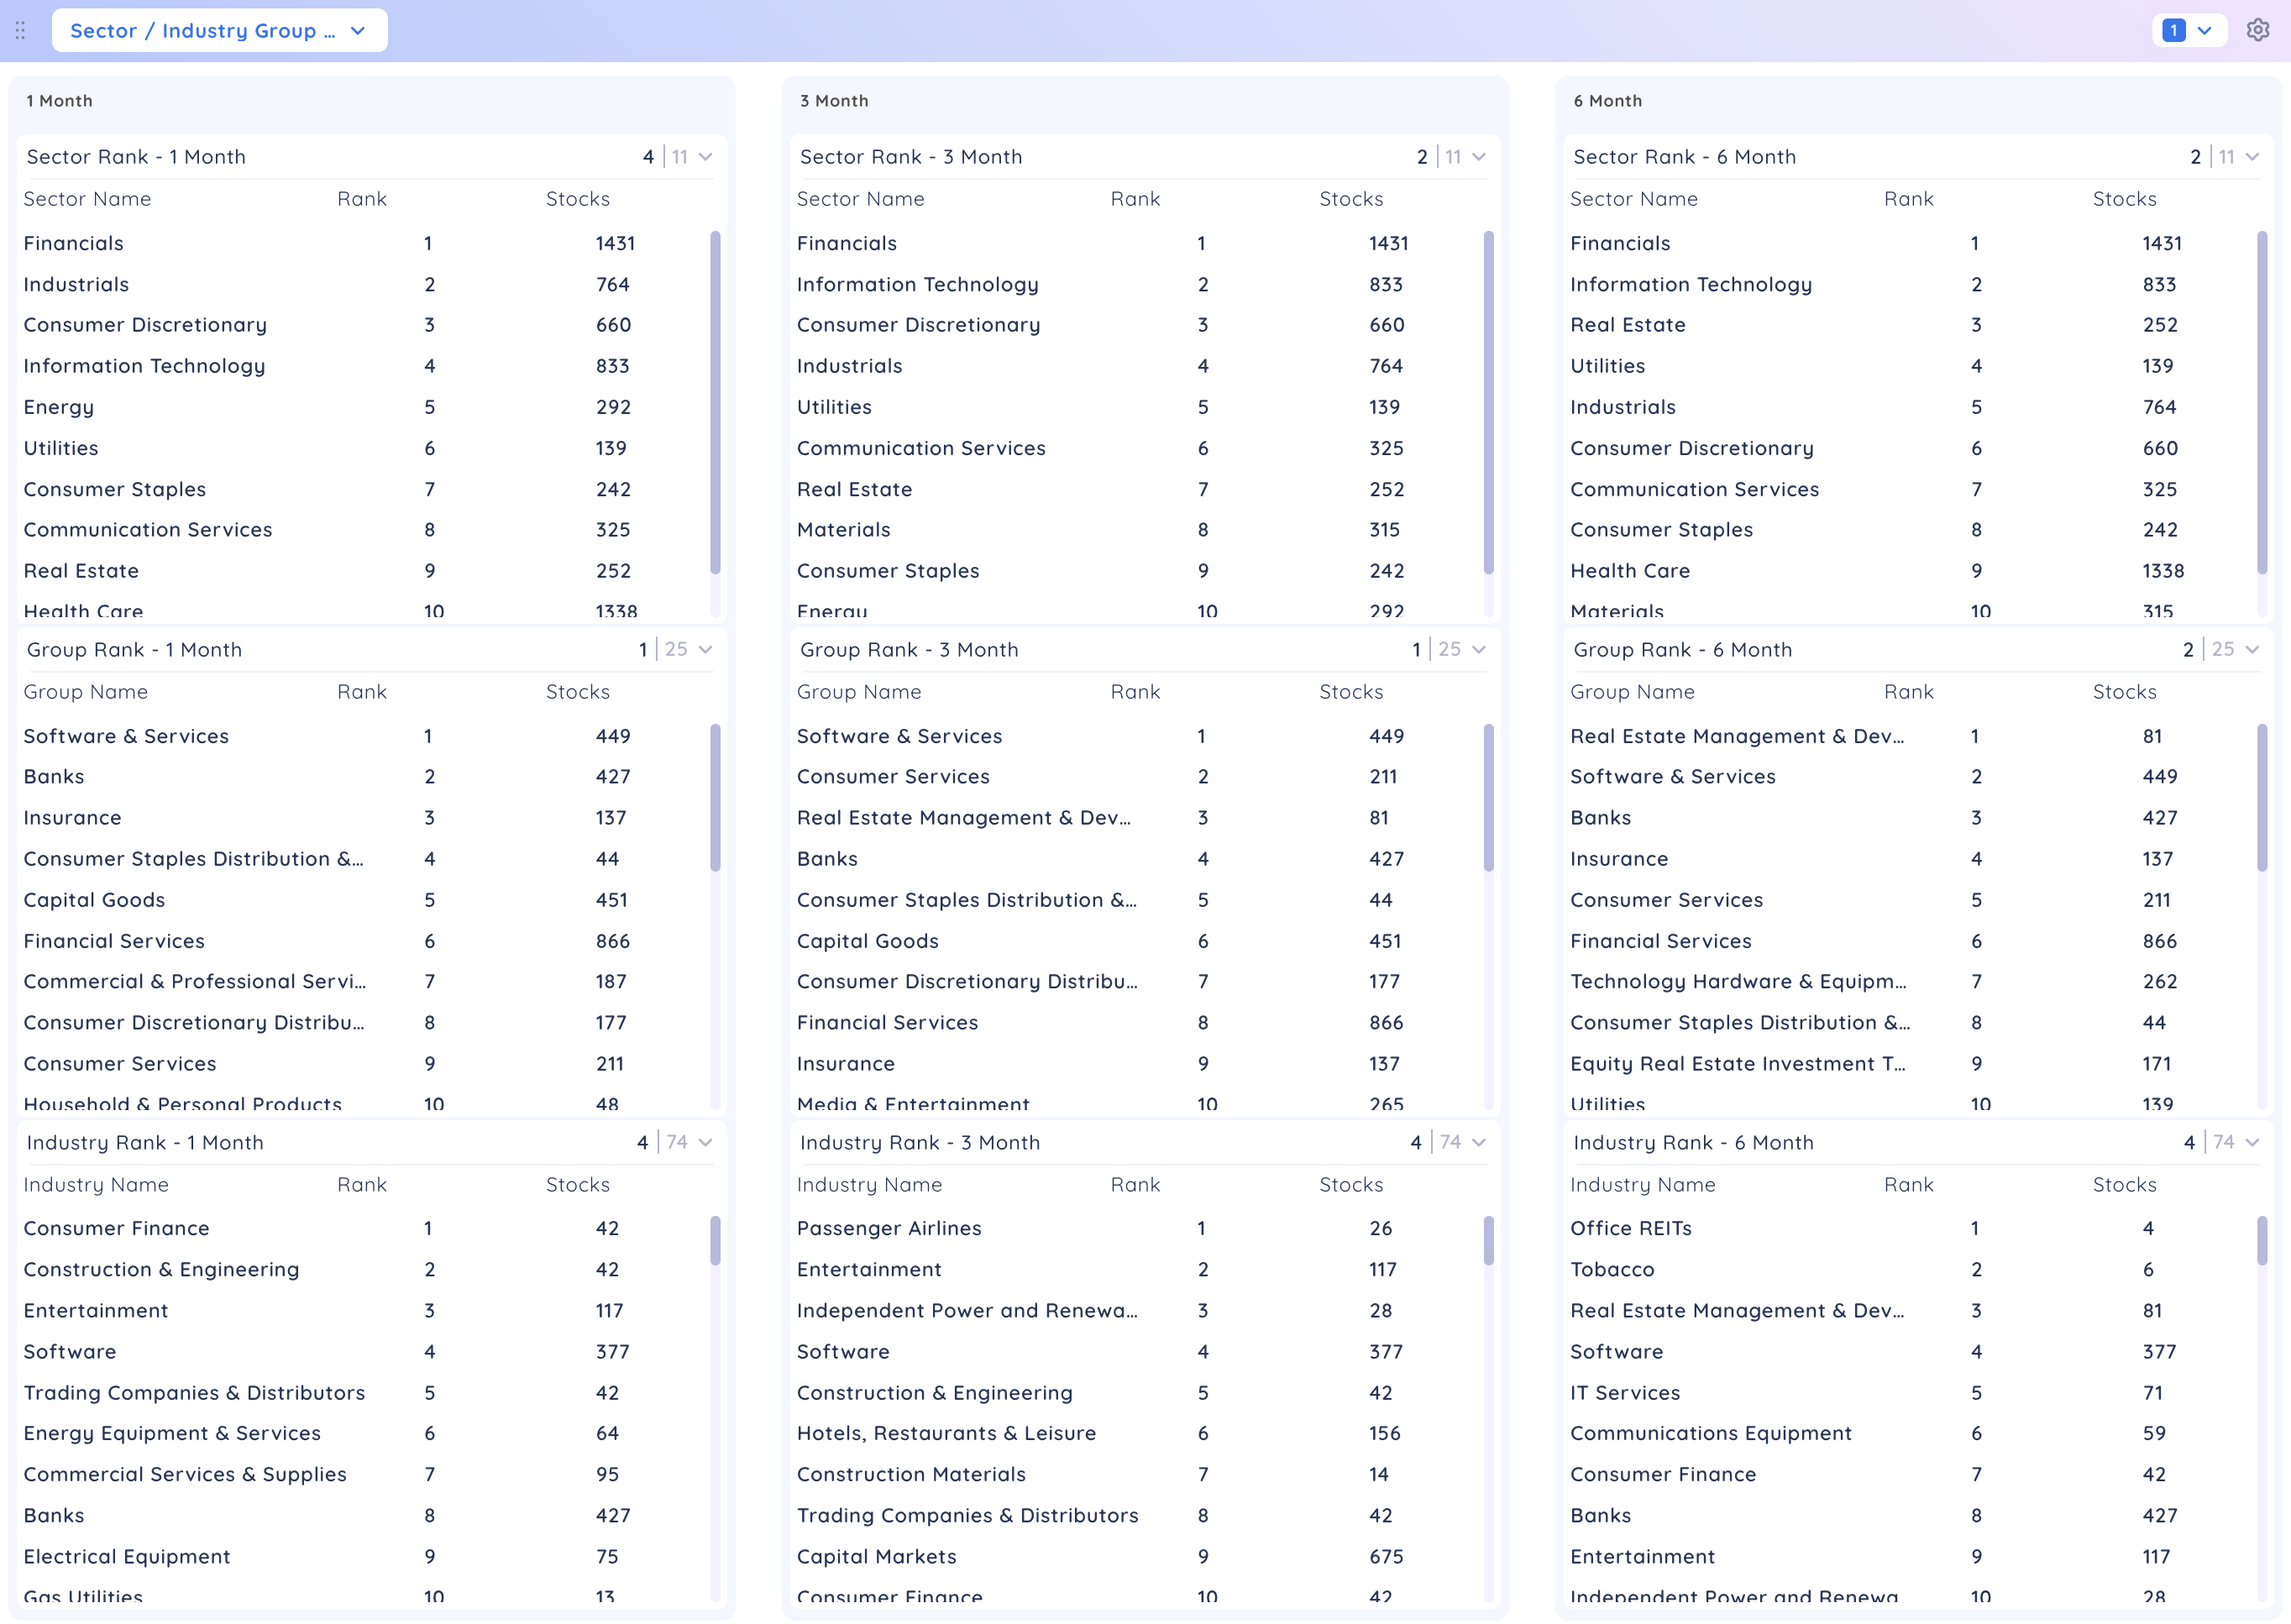
Deepvue provides simple insights into sector, group, and industry performance over different timeframes.
- Sector, Group, and Industry Rankings: See how different areas of the market stack up.
- Timeframe Comparisons: Evaluate performance over 1-month, 3-month, and 6-month periods.
- Emerging Themes: Spot new trends early by focusing on short-term performance.

Focus On Lower Timeframes To Spot New Themes
The 1-month rank timeframe is ideal for discovering emerging market trends. Pay close attention to sectors or groups making quick moves up the rankings.
These early movers indicate where new leadership could develop.
Use Higher Timeframes To Gauge Strength Longevity
The 3-month and 6-month timeframes are better for assessing whether a group’s strength has staying power. A strong ranking over a longer period suggests the group is stable and could continue its leadership role.
By comparing lower and higher timeframes, you’ll gain a full picture of both short-term opportunities and long-term trends.
Staying In Tune With Market Leadership
Keeping an updated watchlist and monitoring the strongest groups daily ensures you’re aligned with market trends. Leadership rotates over time, and staying in tune with this rotation gives you valuable clues about the overall market’s health.
Following the leading stocks of each market cycle will keep you in tune with the overall market dynamics.
- Remain Bullish When Leaders Are Strong: When leading stocks are forming tight bases and hitting new highs, the market is healthy.
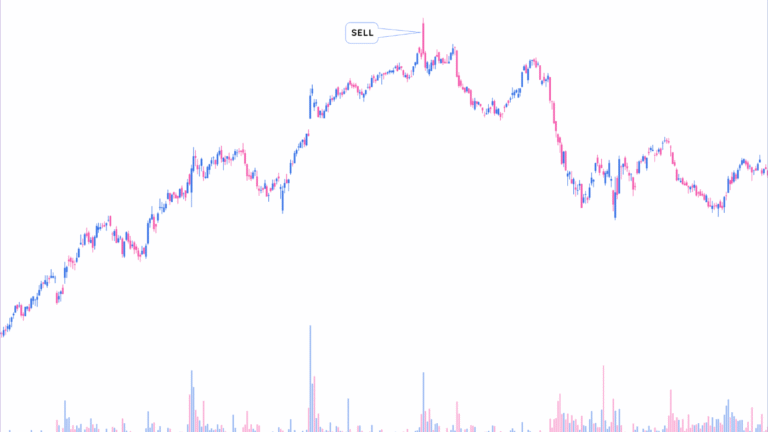
- Turn Defensive When Leaders Falter: If leading stocks show reversals, fail to breakout, or experience heavy selling, reduce exposure and protect your portfolio.
Key Takeaways
Nearly half of a stock’s performance is tied to its industry and sector. By focusing on strong industry groups, you align yourself with the market’s most powerful trends.
Use tools like relative strength analysis, sector ETFs, and stock charting software to identify emerging themes and track leadership. By narrowing your focus to the strongest groups and their leading stocks, you’ll dramatically improve your chances of success in the stock market.
Start with the broad market, zero in on the strongest sectors, and drill down to individual stocks with solid setups. This step-by-step process will help you stay ahead of the market and maximize your gains.
Continue Your Trading Education
Understanding the relative strength line is just one piece of the puzzle when it comes to finding
true market leaders.
Successful trading requires a deep understanding of technical analysis, market psychology, and
proven strategies that work
across different market conditions.
If you’re serious about taking your trading to the next level and want to learn from seasoned professionals like Ross Haber who’ve
consistently found market leaders using these exact techniques, you’ll want to check out our weekly market analysis.
TML Talk provides in-depth market commentary, real-time stock analysis, and actionable insights that help you identify
the strongest stocks before they make their big moves. You’ll get the same analysis and thought process that has helped
us spot winners like ELF and TSLA early in their runs.


