Stock Topping Process: 5 Signals to Warn The Uptrend Ended
Published: July 4, 2025


What is a stock topping process?
When a stock hits an all-time high, it doesn’t always crash right away – it usually starts to slowly lose momentum. That’s what traders call the stock topping process.
It’s a gradual shift that signals the end of a strong uptrend and often leads to a reversal or a period of sideways movement.
Unlike sudden market corrections or crashes, the stock topping process usually plays out over weeks or even months. During this time, the stock may trade in a tight range, show signs of weakness, or fail to make new highs.
Think of it like a runner who’s been sprinting hard – Eventually, they start to slow down before stopping completely. Stocks behave in a similar way when they top out.
Timing the exact peak is tricky, just like timing the exact bottom. But there are several warning signs that can help you spot when a stock might be topping.
Recognizing these signs early can give you the confidence to start trimming your positions, lock in profits, and protect yourself from the next downturn.
Why should you sell stocks?
Knowing when to sell stocks is just as important as knowing when to buy. If you want to grow your portfolio over time, you can’t just focus on finding good entries, you also need to have a solid exit plan.
Selling stocks near their highs helps you lock in profits and gives you fresh capital to put into stronger opportunities.
Selling plays a key role in risk management. Avoiding big losses protects not just your account but also your mindset.
When you’re stuck in a losing position, it affects your confidence. You might hesitate on new trades, hold onto losers too long, or ignore clear signals that it’s time to get out. That kind of mental fog can cost you more than the loss itself.
On the financial side, drawdowns are tough to recover from. A 10% loss needs an 11% gain to break even.
But a 50% loss? You’d need to double your money, gaining 100%, just to get back to where you started. That’s why ignoring the stock topping process can be so costly – not just financially, but mentally.
So while it’s tempting to hang on and “hope it comes back,” hope isn’t a strategy. Selling at the right time keeps you in control, helps you protect your gains, and sets you up to grow your account with less stress.
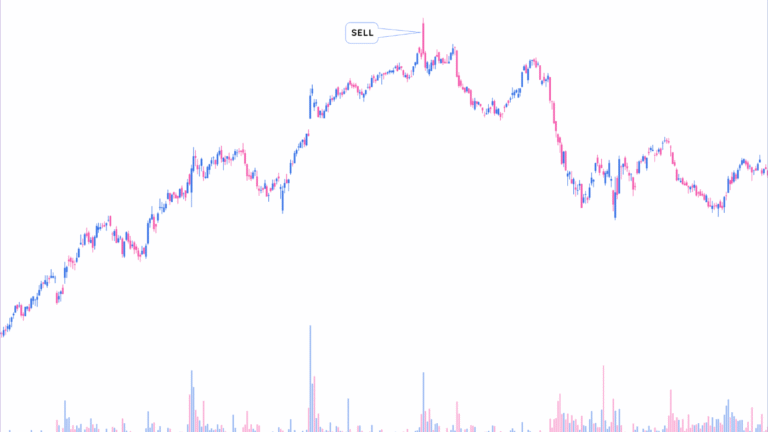
Symbol: DOCU
Company: DocuSign
Year: 2020-2021

What to look for in a stock topping process
When a stock has been trending higher for weeks or even months, it’s tempting to believe the rally will last forever. But just like every uptrend starts with a breakout, every uptrend eventually ends, and the stock topping process gives signs that are there if you know what to look for.
There are five key signals that can help you spot when a stock is topping out. On their own, each signal may just be a caution flag. But when they start showing up together, it’s often a strong sign that the uptrend is running out of steam and a deeper pullback or new base may be coming.
1. Key reversal bars signal trend changes
In a healthy uptrend, price moves in a smooth, controlled rhythm. You’ll often see a staircase pattern of higher highs and higher lows with clear support on pullbacks.
But as a stock topping process begins to form, this pattern breaks. A key reversal bar is usually the first clue that something’s off. These bars are easy to spot if you know what to look for. They often take the shape of:
- A downside reversal – The stock makes a new high but closes near the lows.
- A wedge drop – A sharp breakdown from a narrowing rising wedge pattern.
- A large gap down – Especially if the stock opens much lower and doesn’t recover.
- A shooting star – A candlestick with a long upper wick and a close near the session low, showing sellers took control.
These reversal bars stand out because they break the usual uptrend rhythm and often come with higher volume. They tell you buyers are losing control, and sellers are starting to step in.
Symbol: NVDA
Company: NVIDIA
Date: March 8, 2024

After a 90% rally, NVDA gapped up 3% at the open, but reversed hard and closed down 5%. This bearish outside day came with heavy volume, suggesting the stock was running out of gas and likely needed to build a new base.
2. Gaps kick off volatility and uncertainty
During strong uptrends, price action tends to be orderly with few surprises. Gaps, where the stock opens significantly higher or lower than the previous close, are rarer.
Strong uptrends will see gaps up with continued strength. Gaps down will soon be filled as the uptrend resumes its trend.
But as the stock topping process begins, gaps become more frequent, more extreme, and more unpredictable.
- Gaps up that fail – If a stock gaps up, pushes to new highs, and then reverses hard to make new lows, it’s a sign that buyers are drying up and sellers are unloading into strength. These failed breakouts are often traps for late buyers.
- Gaps down that remain unfilled – These are even more concerning. When a stock gaps down on high volume and doesn’t bounce, it usually means big investors are bailing. If no support steps in quickly, the trend could be in serious trouble.
Frequent gaps, especially when they come in clusters, often mark the transition from an uptrend to a volatile topping phase.
Symbol: MSTR
Company: MicroStrategy Incorporated
Date: November-December 2024

After a massive 200% run, MSTR started gapping up only to sell off by the close. It then gapped down multiple times. These wild swings showed that volatility was replacing strength.
3. Distribution days show large selling pressure
Volume is the fuel behind price action. So when you see high volume on down days, that’s a big clue that institutional investors, the ones who drive major trends, are starting to sell.
This is what traders call distribution: big players offloading shares while retail investors keep chasing the price higher.
You can spot distribution by looking for:
- A sudden spike in volume on a red candle (down day)
- Several down days in a row with increasing volume
- A failed breakout followed by a heavy-volume selloff
Often, the largest red volume bar near the top ends up marking the peak. When you see that kind of action after a long rally, the stock topping process begins and it’s time to protect gains.
Symbol: CAVA
Company: CAVA Group
Date: November 13, 2024

CAVA rallied 200% after breaking out above its IPO high. But near the top, volume surged dramatically as the stock started pulling back. That’s classic distribution from big sellers.
4. Tops come with big daily losses
Uptrends thrive on tight price action. Most days, gains are small and pullbacks are shallow. But once the stock topping process begins, you’ll start seeing larger red days, and they often come fast.
Pay close attention to:
- The size of the drop – If the stock falls 5%–7% or more in one day, that’s significant, especially if it hasn’t done that during the uptrend.
- Where it closes – A close near the low of the day, especially below the previous day’s range, shows strong selling pressure.
- Volume confirmation – Big losses on big volume are even more telling. That’s fear, not just profit-taking.
These large down days often happen after a failed breakout, a nasty gap down, or a series of choppy sessions. They’re usually the moment when traders realize the trend has flipped.
Symbol: RDDT
Company: Reddit, Inc.
Date: February 2025

RDDT’s biggest down day during its uptrend was around 4%. But after topping, it gapped down three days in a row and then dropped 7% in one session. That was the start of its decline from all-time highs.
5. RS phase ends as momentum fades
The Relative Strength (RS) line compares how a stock is performing versus the overall market, usually the S&P 500 or Nasdaq. It’s a great tool to spot early leadership and when that leadership starts to fade.
To get more insight, plot a 21-day moving average on the RS line. Here’s how to use it:
- When the RS line is above the moving average, the stock is outperforming the market and likely in a strong uptrend.
- When the RS line breaks below the moving average, that outperformance is gone, and a top could be forming.
This shift can happen gradually or suddenly, and can signal that a stock topping process is starting. Either way, it’s a sign that the stock’s momentum is slipping and that money may be rotating elsewhere.
Symbol: COIN
Company: Coinbase Global
Date: 2024

COIN formed a 2nd base after an initial uptrend off the lows. Note how the RS line crosses above its moving average during an uptrend, and below the moving average when the base forms. The next time the RS line crossed below the moving average, a major top formed.
Is a stock forming a top or needs to rebase?
Just because a stock shows signs of topping doesn’t mean the all-time high is permanent. Many strong names go through normal pullbacks or base-building phases before resuming their trend.
That’s why it’s to know where you are in the overall market cycle:
- Early in a bull market – Be patient. Leading stocks might need time to rest and reset.
- Late in a bull market – Be quicker to sell. Topping patterns are more likely to lead to deeper corrections.
So ask yourself: Is this a temporary consolidation, or a full stock topping process?
If you’re seeing multiple red flags, key reversal bars, failed gaps, heavy distribution, large red days, and RS weakness, it’s probably time to trim, sell, or step aside.
Key Points on how to spot and act on a stock topping process
The stock topping process isn’t about one big signal – it’s about recognizing a pattern of weakening behavior after a strong uptrend. If you can spot it early, you’ll be in a much better position to protect gains and avoid unnecessary losses.
Key points to remember:
- The stock topping process is gradual, not instant. It can unfold over weeks or months.
- Key reversal bars show when the buying rhythm breaks and sellers start taking over.
- Frequent gaps, especially failed gap-ups and unfilled gap-downs, introduce volatility and signal uncertainty.
- Distribution days reveal when big institutions are quietly exiting.
- Large red daily candles suggest momentum is breaking down.
- Relative Strength (RS) weakness confirms the stock is losing leadership status.
Knowing these signs helps you decide if a stock topping process has begun or if the stock is just pausing to build a new base. Context is everything – early in a bull market, you might give stocks more room. But late in the cycle, you’ll want to act faster.
You don’t need to sell at the exact top. But if you can spot a stock topping process early and exit smartly, you’ll keep more of your profits, avoid major drawdowns, and stay emotionally and financially ready for the next opportunity.