Stock Market Analysis: 3 Simple Ways to Identify a Healthy Environment
Published: April 17, 2025


Why Successful Traders Perform Stock Market Analysis
If you want to become a successful trader, you’ve got to know the overall market environment at all times.
Trading during a strong uptrend gives your positions the best chance to grow. In fact, the direction of the market plays a huge role in how your stocks perform – about 3 out of 4 stocks move with the market.

Great stock picks start with analyzing the big picture. A top-down approach means you begin by looking at the overall market trend. So before you jump into a trade, make sure your stock market analysis confirms the market’s moving in the right direction.
If the market’s in an uptrend, you can narrow your focus to the strongest stocks leading that move. It’s like checking the weather before heading out – if a storm’s coming, you’re not going to have a great time, no matter how nice your outfit is.
What a Healthy Stock Market Looks Like
You don’t need a dozen complicated indicators to figure out if the market is healthy. In fact, too much information can make things more confusing than helpful.
The best traders stick to a few simple, reliable signals. These core principles help you understand whether the market is trending up and whether it’s the right time to be buying stocks.
Here are three easy ways to spot a healthy, up-trending stock market:
Uptrending Stock Markets Make Higher Highs and Higher Lows
One of the most obvious signs of a strong market is a steady pattern of higher highs and higher lows.
- When demand outweighs supply, each rally pushes the market to a new high – a clear sign buyers are in charge.
- When the market pulls back, it finds support above the previous low, showing that sellers aren’t strong enough to break the trend.
This stair-step pattern is like watching someone walk uphill. There might be pauses or slight dips, but overall, they’re climbing higher.
If you don’t see this consistent rise and support, it could mean the uptrend is weakening or reversing.
Symbol: QQQ
Year: 2013

Click on the chart above to make it bigger.
Healthy Stock Markets Trend Above Key Moving Averages
Moving averages are one of the most effective ways to confirm market strength. They help smooth out price action and reveal the underlying trend.
When the market is healthy:
- Price stays above key moving averages, acting like a rising floor of support.
- The moving averages themselves should be sloping upward, showing momentum.
Which moving average you use depends on your trading style:
- Swing traders often watch the 21-day exponential moving average (EMA) or the 20-day simple moving average (SMA) for shorter-term signals.
- Position traders typically rely on the 50-day SMA as a long-term support level.
When price consistently holds above these lines, it shows buyers are stepping in and keeping the uptrend alive. But when the market dips below them and struggles to bounce back, that’s a warning sign of possible weakness ahead.
Symbol: QQQ
Year: 2014

Click on the chart above to make it bigger.
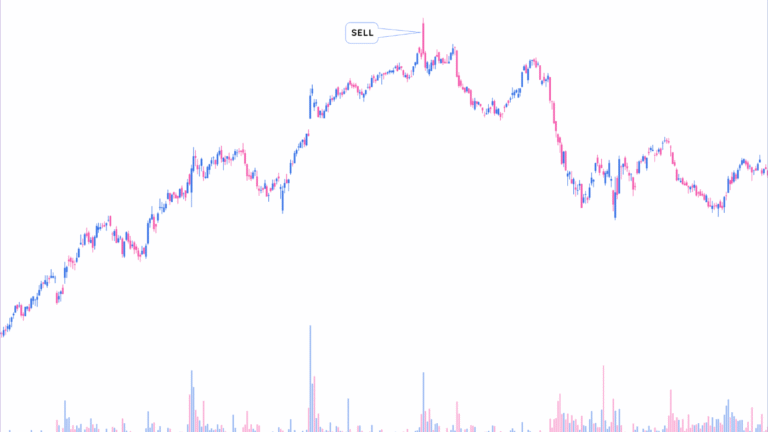
Strong Stock Markets Close Near Their Daily Highs
Another clear sign of strength is when the price closes at the end of the day.
In healthy markets, strong buying pushes prices up throughout the day, and they often finish near the daily high. That tells you buyers stayed in control right until the close – a bullish sign.
A consistent pattern of closing near the highs suggests institutional investors are active and accumulating. That’s exactly the type of stock market environment you want to trade in.
Conversely, if prices close near the low, it often means sellers stepped in and took over in the final hours. If you’re seeing more and more days where the market finishes weak, it could be a signal that the uptrend is running out of steam.
Symbol: QQQ
Year: 2012

Click on the chart above to make it bigger.
Study Past Bull Markets
One of the best ways to improve your stock market analysis is by looking back at previous bull markets. Studying past precedents helps you recognize the patterns and behaviors that show up when the market is in a strong uptrend.
It’s like training your eye to spot red flags – or in this case, green lights.
Markets tend to repeat themselves. While no two rallies are exactly the same, strong bull markets usually share the same core traits. Once you get familiar with these patterns, you’ll be able to spot high-quality trading environments much faster.
Remember, strong market uptrends exhibit the following:
- Bull markets show that buyers stay in control by pushing prices up to new highs and defending higher lows.
- In strong stock markets, the index rides moving averages higher like a rising support line.
- Strong markets often close near the top of the day’s range, meaning buyers were active from open to close.
Symbol: QQQ
Year: 2017

Click on the chart above to make it bigger.
Not every uptrend starts cleanly. Some of the biggest bull runs began after messy, choppy price action. Subtle shifts often mark the early stages of a new rally.
Start by looking for higher lows. This tells you that selling pressure is fading and that buyers are quietly stepping back in. It’s like the ground is starting to firm up before a big move higher.
Symbol: QQQ
Year: 2017

Click on the chart above to make it bigger.
When you compare bull markets to choppy or weak environments, the contrast is huge.
Choppy markets make erratic moves, gaps down, and weak closes near the lows, while moving averages often fail to support the price.
Symbol: QQQ
Year: 2023
Click on the chart above to make it bigger.
As trends gain momentum, you’ll see more gaps up, tight price action, and support from the moving averages.
Stock Market Analysis Keeps You Out of Choppy Markets
One of the biggest benefits of solid market analysis is that it helps you stay out of trouble. When the market is trending clearly, it’s easier to hold positions and let your trades work.
But when things get messy? That’s when having rules really pays off.
Choppy, sideways markets can be deceptively frustrating. They’re not trending up or down – they’re just bouncing around with no clear direction.
Even good stocks struggle in these environments. You might buy on a breakout only to get stopped out days later for no real reason.
The problem isn’t your setup – it’s the market.
Learn to identify choppy markets so you can protect your capital and avoid trading when the risk isn’t worth it.
Avoid Buying Stocks in Weak Market Conditions
This one’s simple but important: don’t fight the trend. If the market is in a confirmed downtrend, your odds of success drop dramatically.
Here’s what happens in a weak market:
- Stocks form a pattern of lower highs and lower lows
- Selling pressure builds, especially on any bounce
- Volatility spikes, and sharp drops happen fast
- Even the strongest names start breaking down
💡 Pro Tip: Leading growth stocks can fall 20–40% during just a 10% market correction.
If you want to stack the odds in your favor, focus your trades during confirmed uptrends. That’s when institutions are buying, setups follow through, and you can actually let your winners run.
Avoiding weak or sideways markets won’t just save your account – it’ll save you stress, frustration, and emotional burnout. Your goal isn’t to trade every day. It’s to trade smart.
Key Points for Successful Stock Market Analysis
Follow the overall market trend
- 75% of stocks move with the market.
- Trade when the market is in an uptrend for higher success.
Use a top-down trading approach
- Start with the market’s health before choosing individual stocks.
- Look for the strongest stocks only after confirming a market uptrend.
Keep your market analysis simple
- Don’t overload on indicators – simple tools give clearer signals.
Watch for higher highs and higher lows
- This pattern shows strong buyer demand and signals an uptrend.
Price should stay above key moving averages
- Use the 21-day EMA or 20-day SMA for swing trading.
- Use the 50-day SMA for longer-term position trades.
Strong markets close near the highs
- A strong close signals buyer strength throughout the day.
- Weak markets close near the lows due to selling pressure.
Study past bull markets
- Look for repeating patterns of strength: rising highs/lows, tight price action, and support from moving averages.
Avoid trading in choppy or down-trending markets
- Choppy markets lead to confusion and losses.
- Downtrends bring sharp, fast drops, especially in growth stocks.