Key Reversal Bar: 4 Warnings to Sell Stocks
Published: September 8, 2025


What is a Key Reversal Bar?
In a healthy uptrend, price moves in a steady, almost predictable rhythm – like climbing a staircase. You’ll see a pattern of higher highs and higher lows, with strong buying support during pullbacks.
This kind of movement tells you the bulls are in control, but trends don’t last forever. As a stock starts to top out, that rhythm begins to change.
One of the first signs that bullish momentum is about to shift is the appearance of a key reversal bar.
These bars are like red flags waving in the middle of what seemed like smooth sailing. They’re not always dramatic, but they definitely stand out, especially if you know what to look for.
Why is a Key Reversal Bar Important?
Key reversal bars matter because they break the flow of the uptrend. When the price drops, especially on a pickup in volume, it means more traders are hitting the sell button and the trend is changing direction.
They’re like the market whispering, “Hey, something’s not right here.”
That shift in behavior is your cue that the tide might be turning. It doesn’t always mean a full trend reversal is coming, but it’s often the first crack in the armor.
Here are why key reversal bars are so important:
- Early warning signal – These bars can show up before a full-blown trend reversal happens. Catching the shift early gives you more time to manage risk, tighten stops, or exit a position.
- Psychological shift – Reversal bars reflect a change in trader sentiment. What started as a bullish uptrend ends with sellers taking over, showing fear or profit-taking is entering the picture.
- Volume confirmation – When a reversal bar comes with higher-than-average volume, it’s not just noise – it’s a sign that institutions or large players may be selling.
- Momentum breakdown – These bars often show up at the end of a strong move, right when the stock is overextended. They can mark the beginning of a pullback or a much bigger correction.
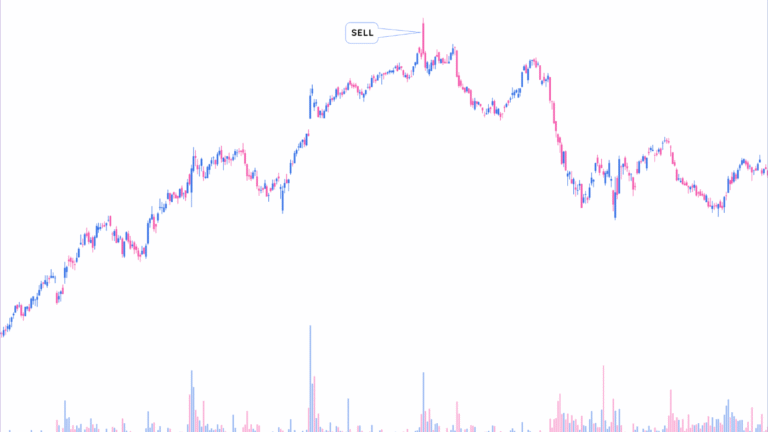
Symbol: NVDA
Company: NVIDIA Corporation
Year: 2023 – 2024

The slowdown might be brief, or it might indicate a stock topping pattern. Either way, ignoring them can leave you exposed, especially if you’re holding a stock that’s been on a hot streak.
So when you spot a key reversal bar, especially near resistance or after a strong rally, it’s a good idea to take a closer look. It could be the market’s way of telling you it’s time to take some profits, protect gains, or wait for a new setup.
How to Spot a Key Reversal Bar
Spotting a key reversal bar isn’t hard once you know what to look for. It’s all about catching the moment when momentum shifts from buyers to sellers.
In an uptrend, a key reversal bar usually starts by pushing to a new intraday high, often higher than the previous few bars. This is where things flip – After making that new high or low, the price reverses sharply and closes near the opposite end of the range.
This tells you momentum shifted during the day – buyers started strong, but sellers took over.
If the reversal bar comes with higher-than-average volume, it shows serious selling pressure. That means institutions or large traders could be behind the move, forcing it lower within the next few sessions.
Most key reversal bars are larger than the recent candles, which makes them stand out visually. Let’s take a look at some examples:
1. Downside Reversal
This happens when a stock makes a new high during the session, often triggering excitement or breakout buying. But instead of following through, it reverses sharply and closes near the session low. That means early buyers got trapped, and late-day sellers overwhelmed demand.
You’ll often see this after a strong run-up or near a resistance level. The downside reversal stands out even more if:
- The candle is large and red
- Volume spikes compared to recent days
- The close is below the previous day’s low
Symbol: CAVA
Company: CAVA Group
Date: November 13, 2024

Downside reversals show a shift in control from bulls to bears – often the first sign of a short-term top or deeper pullback.
2. Wedge Drop
This reversal starts with a rising wedge pattern, where price climbs higher but the range gets tighter. It’s a sign that momentum is slowing, even as the price keeps inching up.
Think of it like a coiled spring – it can’t stay compressed forever. Eventually, the stock breaks down below the lower trendline, often with speed and volume.
That sharp drop signals the wedge has “snapped,” and buyers are no longer in control. Look for these signs:
- A tight, rising pattern with converging trendlines
- Lower volume as price rises
- A fast, high-volume breakdown that closes near the low of the day
Symbol: NET
Company: Cloudfare, Inc.
Date: November 21, 2021

Wedge drops often kick off deeper corrections because the breakdown clears out weak hands and stops below the pattern.
3. Large Gap Down
This happens when a stock opens much lower than the previous day’s close and can’t recover during the session. These are often caused by bad news like earnings misses, analyst downgrades, or macro headlines.
What makes it a true key reversal is:
- The gap doesn’t get filled
- Volume is well above average
- The candle closes near the low of the day
This kind of move signals panic selling or institutional unloading, especially if it breaks key support levels.
Symbol: RBLX
Company: Roblox, Corporation
Date: February 6, 2025

Large gap downs are powerful because they reset sentiment quickly and often lead to follow-through selling in the days ahead.
4. Shooting Star
This is a classic candlestick pattern you’ll usually find at the top of an uptrend. The stock opens strong, pushes higher during the session, but then reverses and closes near the low, leaving a long upper wick and a small real body near the bottom of the candle.
It’s called a shooting star because the price “shoots” up but then quickly falls back down. It looks dramatic on a chart and signals that buyers ran out of fuel and sellers took over.
Key features of a shooting star:
- Long upper wick (at least 2x the size of the body)
- Small body near the session low
- Ideally on high volume for confirmation
- Occurs after a run-up or near resistance
Symbol: TSLA
Company: Tesla, Inc.
Date: February 4, 2020

It’s often one of the first signs of a short-term top. If followed by more weakness the next day, it can mark the beginning of a deeper trend reversal.
The bottom line? Key reversal bars are a first clue that something’s changing. You don’t want to trade off them blindly, but they’re a strong signal to take warning.
If they line up with other signs of weakness like a failed breakout, relative weakness, or continued distribution, it could be time to reduce risk or get out ahead of the crowd.
Is The Stock Forming a Major Top or Just Taking a Breather?
Just because a stock looks like it’s topping doesn’t mean it’s game over. In fact, many strong stocks go through normal pullbacks or base-building phases before they head higher again.
To figure out what’s really going on, ask yourself where you are in the bigger market cycle:
- Early in a bull market – Be patient. Leaders might just need a break after a strong run. A healthy consolidation or sideways base could be the setup for the next leg higher.
- Late in a bull market – Be more cautious. When the market’s stretched and momentum is fading, topping patterns are more likely to lead to deeper corrections or even bear markets.
So the key question becomes: Is this just a temporary pause, or is the stock forming a long-term top?
Here’s what to watch for:
- Key reversal bars that signal a shift in control from buyers to sellers.
- Failed breakouts or gap-ups that quickly reverse and trap late buyers.
- Heavy distribution days, where the stock drops on high volume.
- Multiple large red candles, especially if they come back-to-back.
- Relative strength (RS) weakness, where the stock underperforms the market or peers.
If you’re seeing just one of these, it might be a normal shakeout. But if you’re spotting several red flags at once, it’s often a sign that momentum is breaking down. In that case, it’s probably time to trim your position, sell into strength, or step aside and wait for a clearer setup.
Remember, strong stocks can come back, but they need time to rebuild. Your job is to protect capital so you’re ready for the next breakout when the timing is right.
Final Thoughts: Why To Sell Stocks When You See a Key Reversal Bar
The key reversal bar is one of the most important price action signals you can learn to recognize. It’s a simple yet powerful tool that helps you spot early signs of trend exhaustion before a prolonged correction sets in.
Whether you’re an active trader or a longer-term investor, knowing how to spot a key reversal bar can give you a serious edge. It’s not just about reading candlesticks – it’s about understanding when momentum is shifting and when it’s time to protect profits or reduce risk.
Here’s a quick recap:
- A key reversal bar often shows up after a strong move and signals that buyers are losing control.
- The most reliable signals come when the bar appears near resistance, with higher-than-average volume, and alongside other red flags like failed breakouts or RS weakness.
- Use it as part of a broader decision-making process – not a standalone trigger, but a sign that it’s time to pay close attention.
Markets move fast, and trends don’t last forever. By adding the key reversal bar to your trading toolkit, you’ll be better prepared to spot when strength is turning into weakness and when it’s time to shift your strategy.
Frequently asked questions
Related articles
-
-
-
-
Stock Topping Process: 5 Signals to Warn The Uptrend Ended
July 4, 202510 min read