What Is The High Tight Flag Chart Pattern?
Published: January 10, 2020


What is the High Tight Flag Pattern?
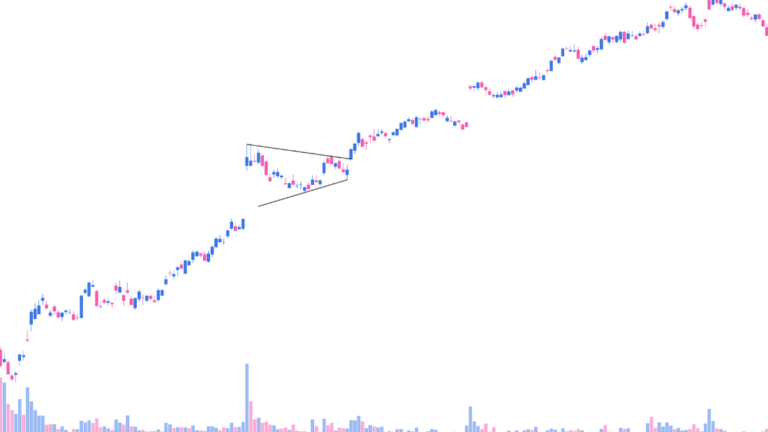
The high tight flag chart pattern is an extremely rare, bullish formation. Stocks that have amazing CANSLIM fundamentals generally form these. The high tight flag is created when the stock has a very sharp move higher followed by a brief consolidation period. This consolidation creates the flag part of the pattern. The breakout from the flag generally signals a continuation of the move higher.
The high tight flag is considered to be one of the most bullish chart patterns that a stock can form. This is because it requires such a strong move higher to form the initial part of the pattern which shows very strong institutional demand for the stock. This huge advance in price then consolidates near highs without giving much progress back which tells us that even though it just had a massive move higher, nobody is interested in selling yet.
Check out the Hight Tight Flag Masterclass by Leif Soreide!
Find High-Growth Stocks Before They Skyrocket
Key Criteria for the Hight Tight Flag

This rare bull pattern forms after a stock gains 100% or more in only 4 to 8 weeks and consolidates while pulling back less than 25% over the course of the following 3 to 5 weeks.
This setup is then completed when the stock breaks out of the flag to new highs on above-average volume. The flags that have a downward slope generally outperform those that don’t, similar to the downward slope in the handle of a cup and handle pattern.
- The prior uptrend of 100% or more in 4-8 weeks
- The base depth is 10-25%
- Buy point is the high of the flag plus 10 cents
Why the Hight Tight Flag Works
This pattern is so powerful because even though the stock has already gained more than 100%, doubling in value, the pullback is extremely shallow which tells us there is nobody interested in selling. Generally, when the price increases over 100%, people want to take profits and the stock will pull back quickly as everybody tries to get out with a gain first.
In the case of the high tight flag, the pullback being so shallow and staying near highs means that buying pressure is still very high and institutions are still buying the stock.
How Reliable is the High Tight Flag?
The high tight flag is a great pattern to trade because it has such a high probability of success. This is a rare pattern and when it does form, the stock generally continues higher after breaking out of the flag. The key to trading this pattern is to make sure that the initial move higher is very strong and that the consolidation period is relatively short and shallow.
When these criteria are met, the high tight flag is a high probability trade that can lead to some very large profits.
Real-World High Tight Flag Example
Symbol: TBCH
Company: Turtle Beach
Year: 2018

Click on the chart to enlarge.
Check out the Hight Tight Flag Masterclass by Leif Soreide!
Find High-Growth Stocks Before They Skyrocket