Trading the Green Line Breakout: 6 Steps for Breakout Trades
Published: June 18, 2025
What is a green line breakout?
The Green Line Breakout (GLB) is a trading strategy made popular by Dr. Eric Wish, a finance professor and market technician. He shares this method on his Wishing Wealth Blog.
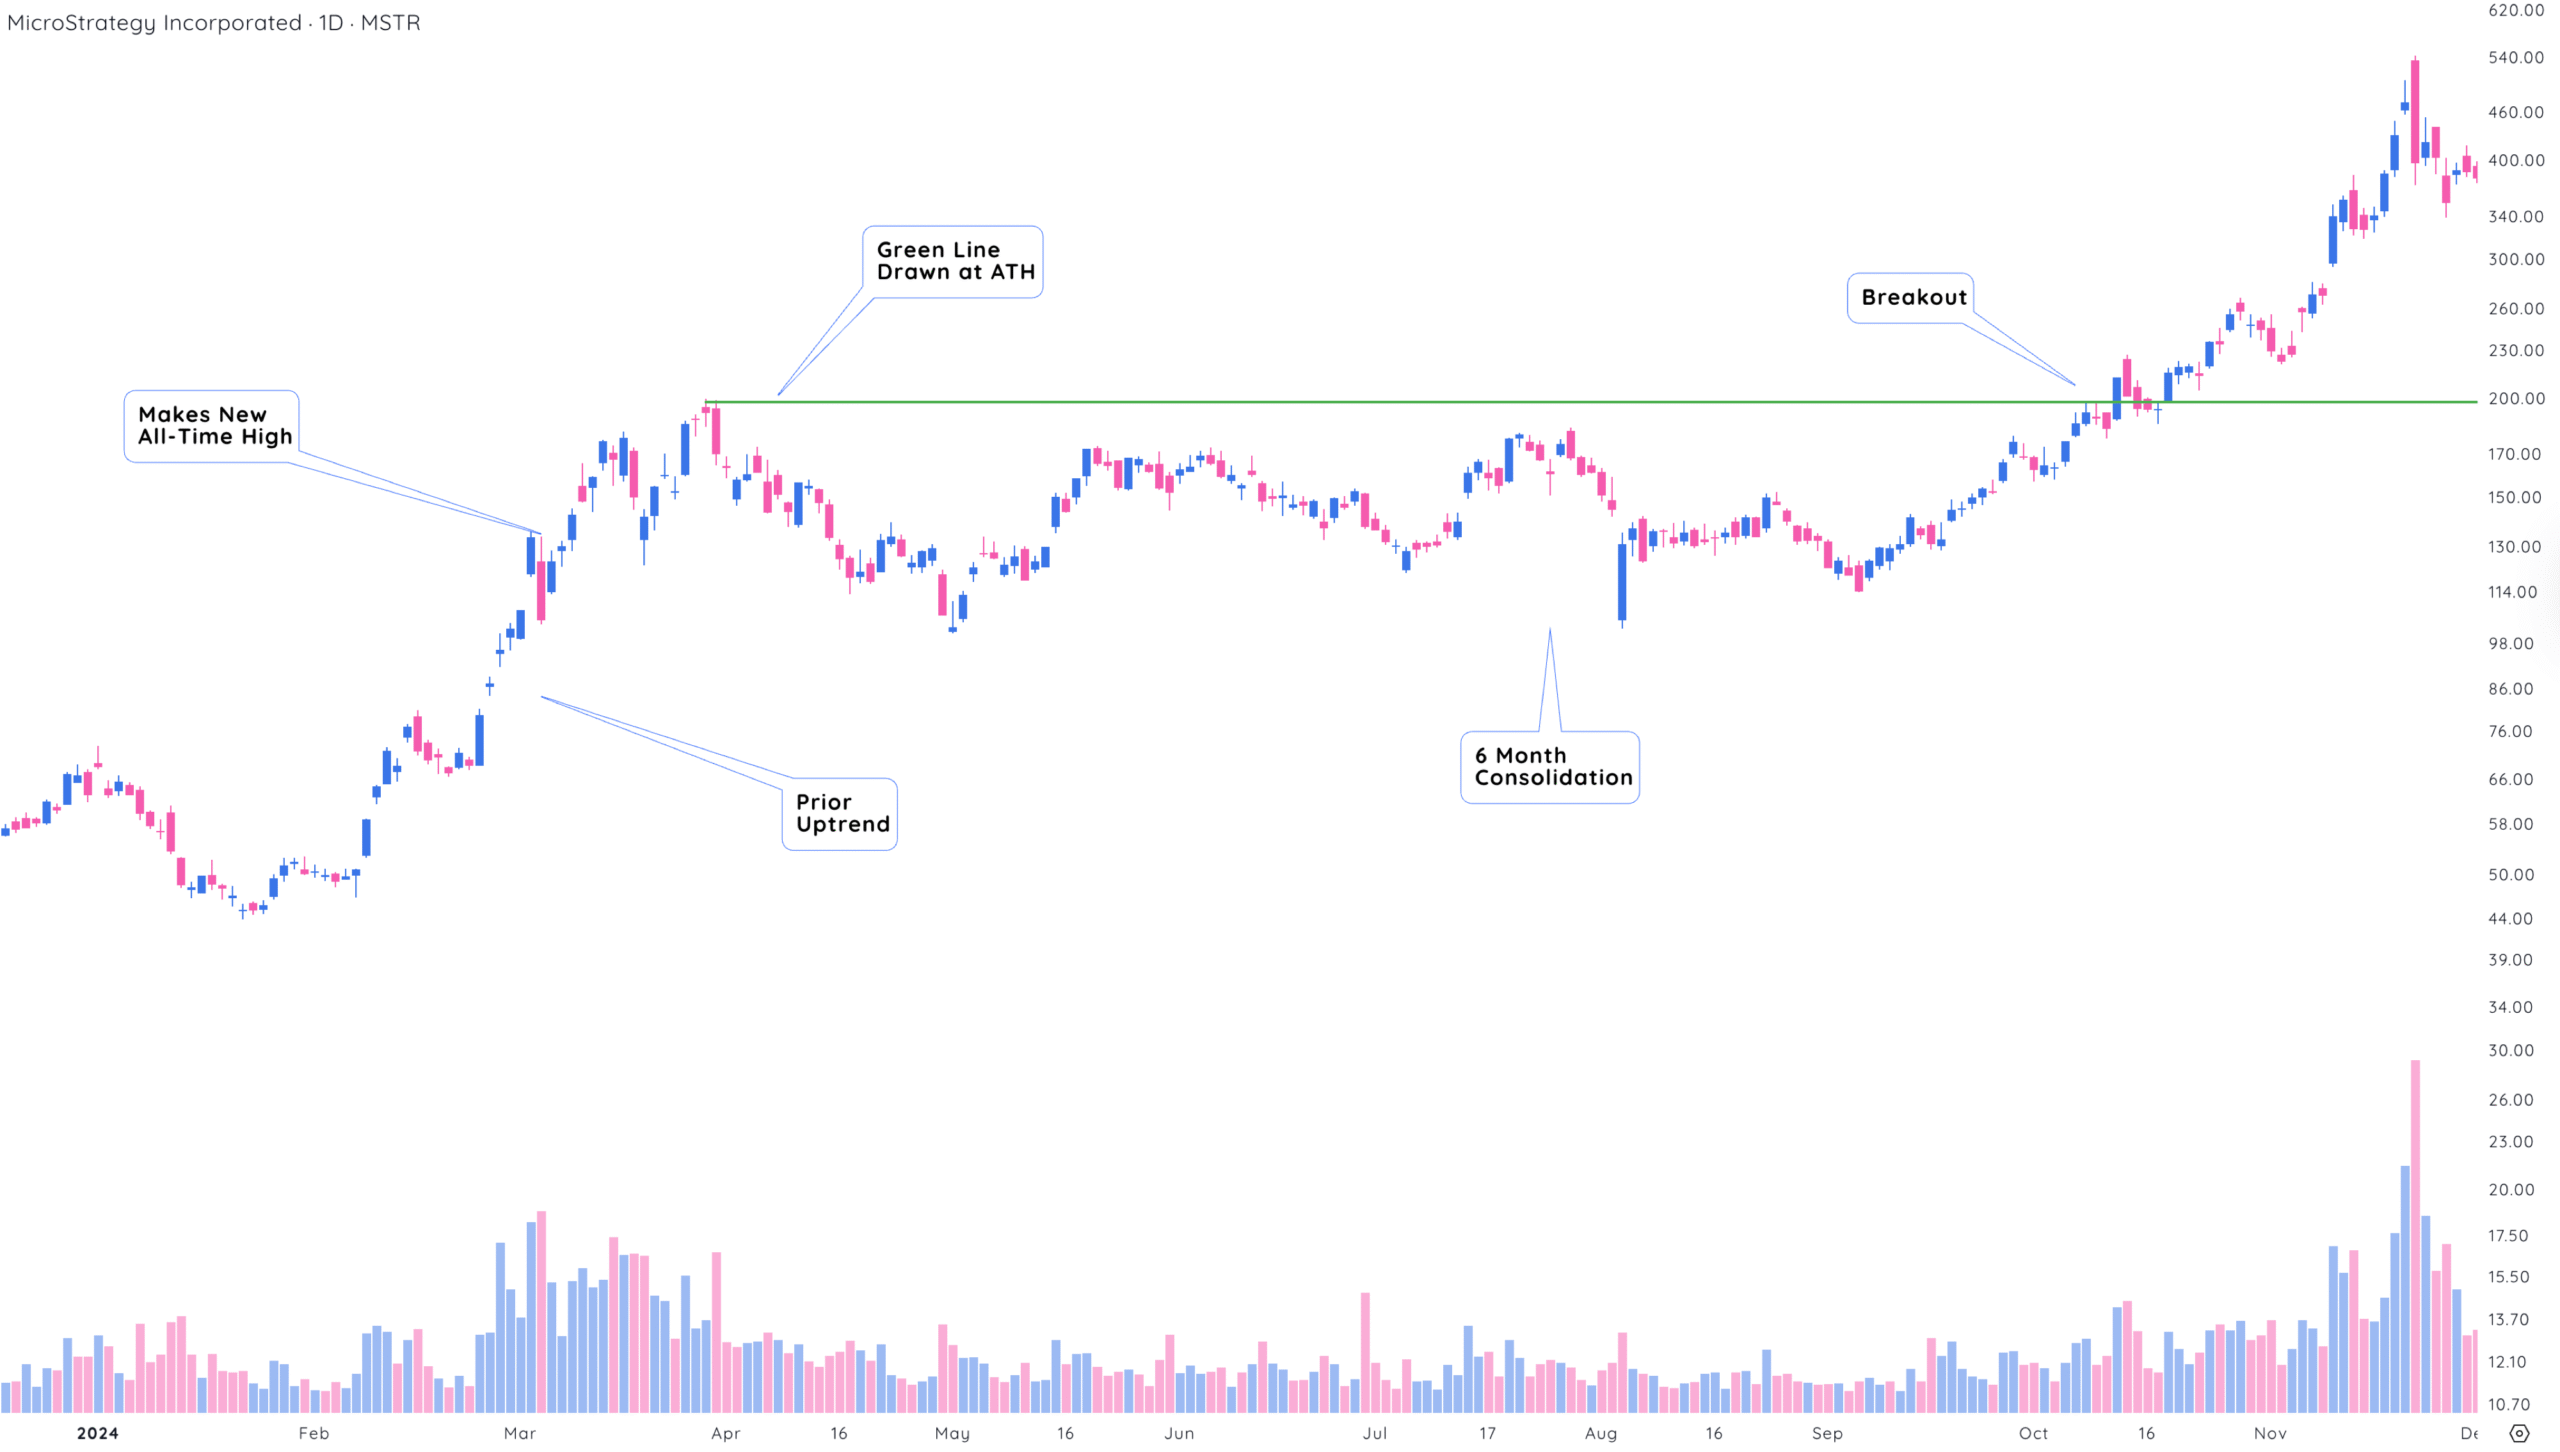
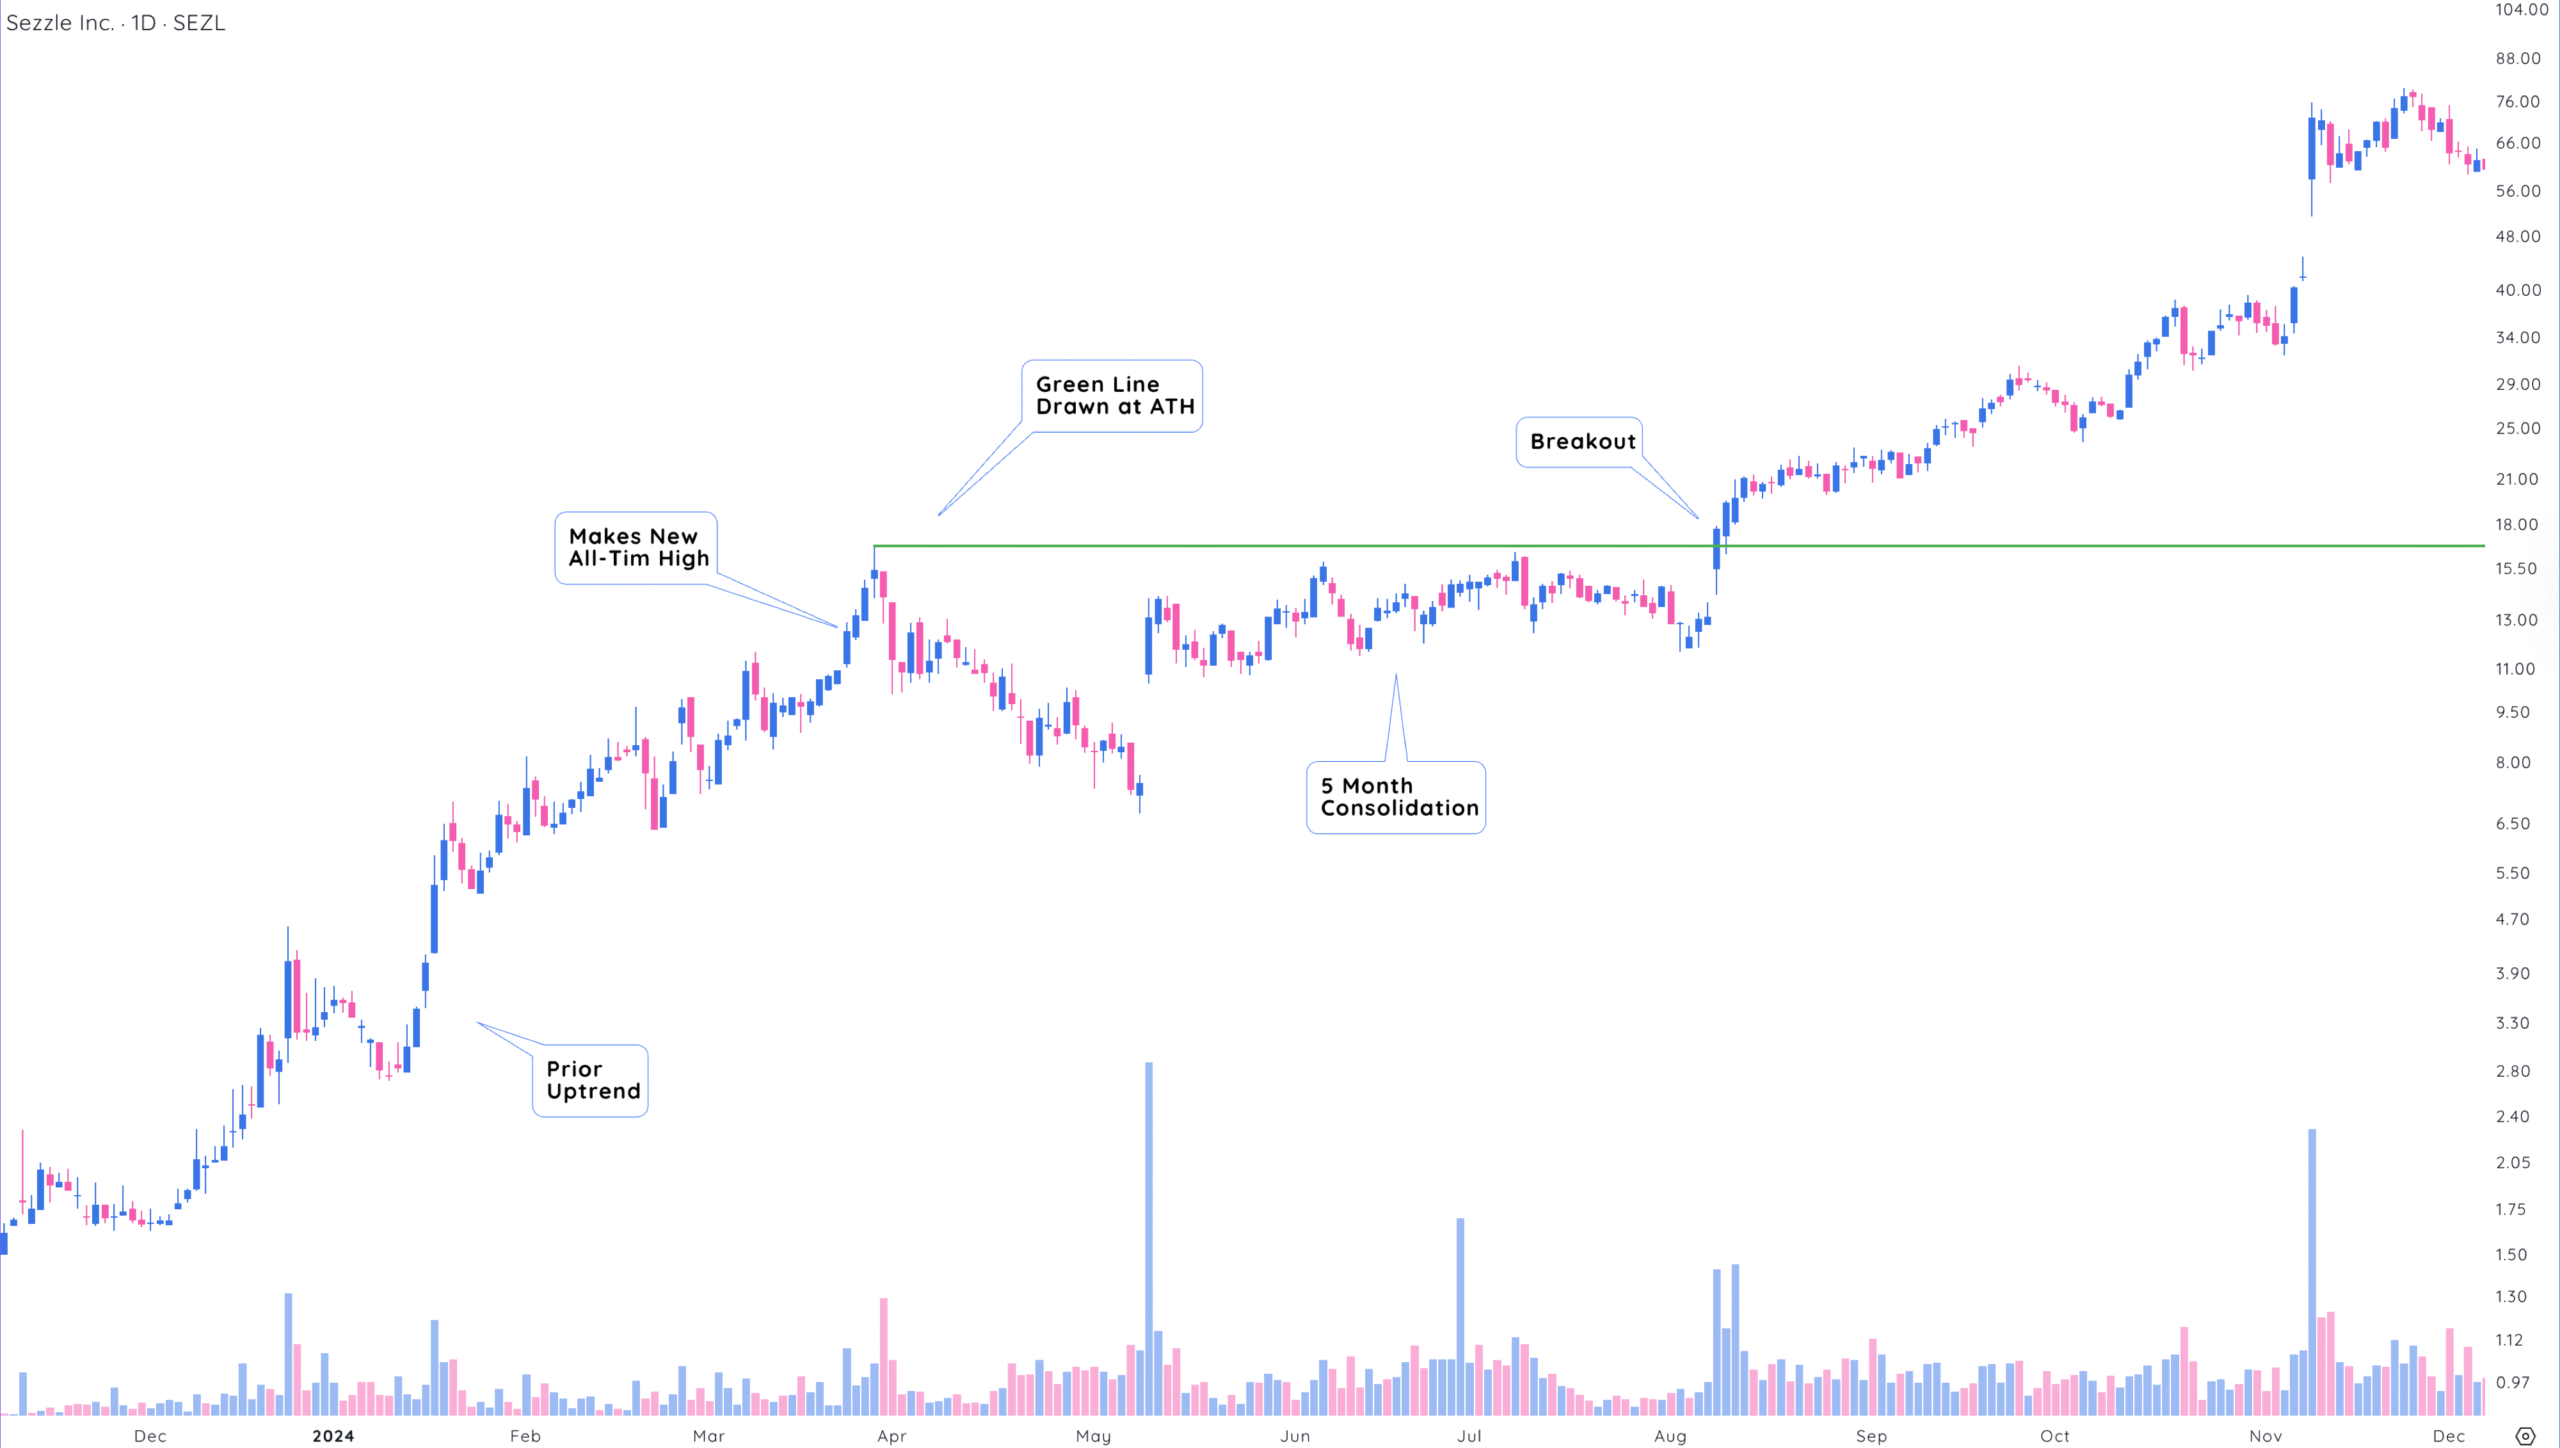
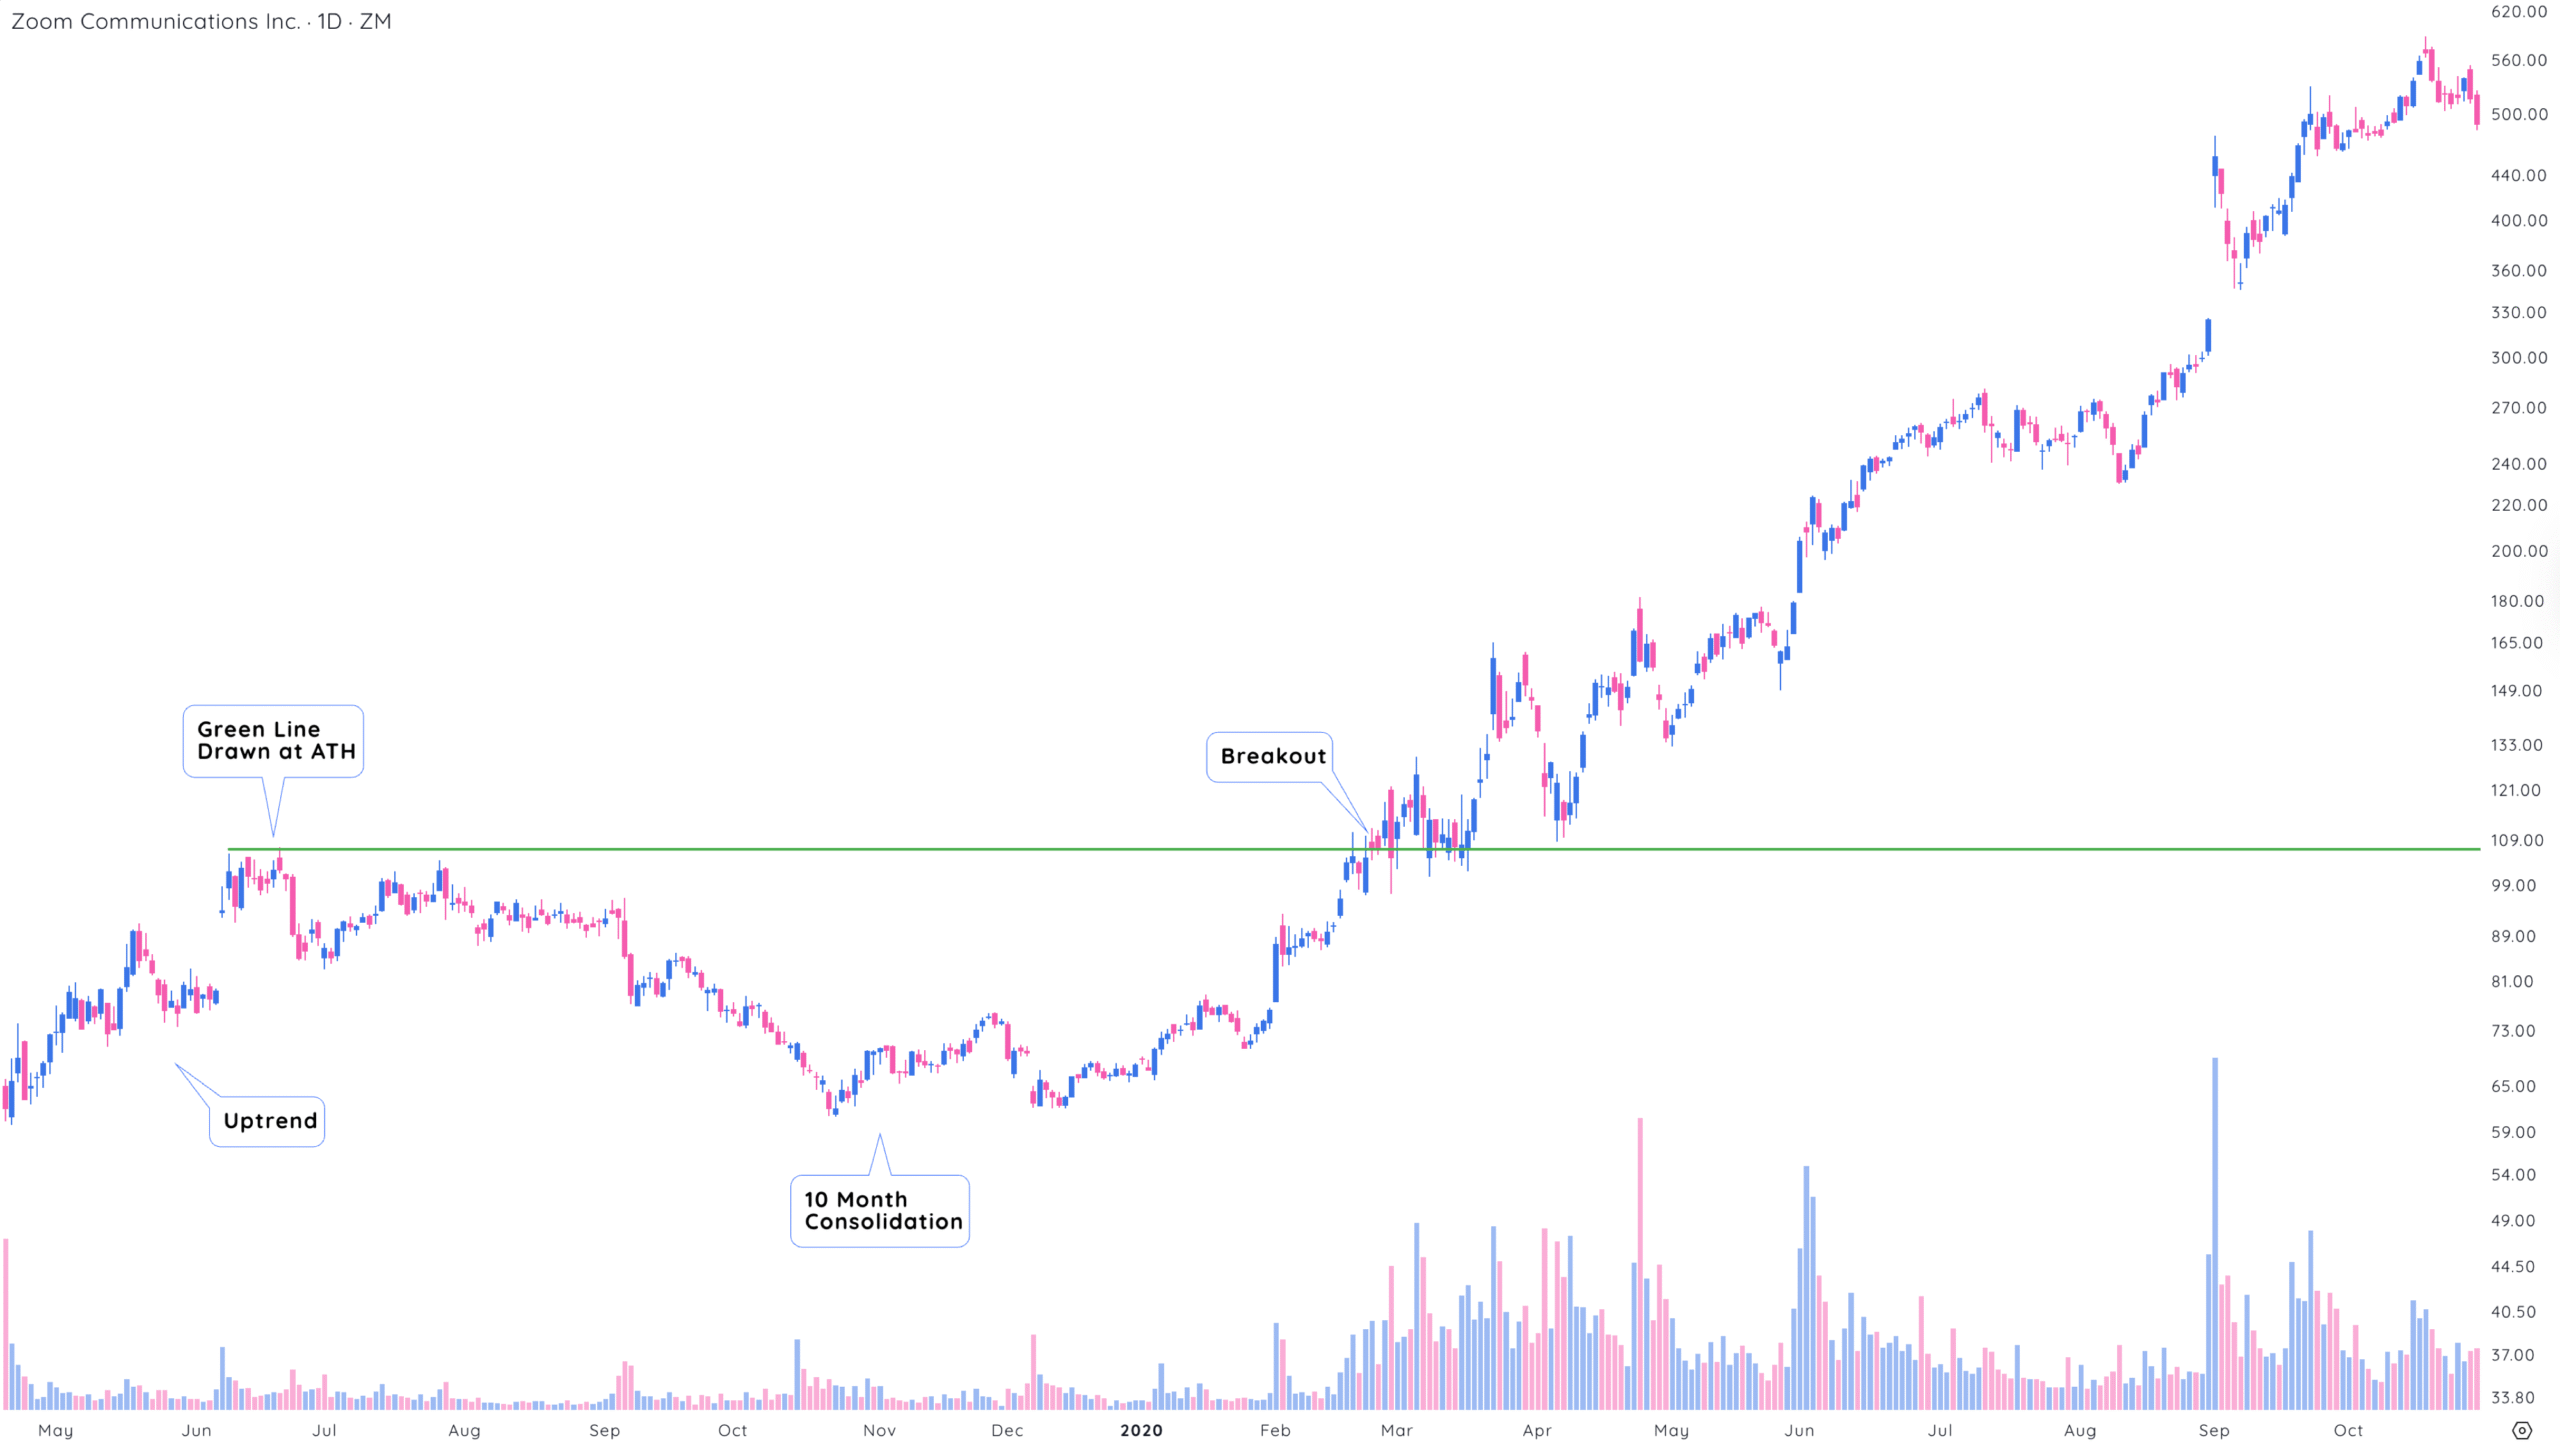
At its core, the GLB strategy focuses on stocks breaking out of long consolidation periods and reaching new all-time highs. The idea is that these breakouts often signal renewed buying from big institutions and a surge in upward momentum.
To qualify as a GLB, a stock must meet three main conditions:
- New All-Time High:
- The stock must have recently hit a new all-time high (ATH).
- Minimum 3-Month Consolidation:
- Before breaking out, the stock should have moved sideways for at least three months. This period creates a clear resistance level marked as a “green line” on a chart.
- Breakout Above Green Line:
- A true GLB happens when the stock breaks above this green line with strong volume. This surge confirms buying interest, especially from institutions, and marks a potential entry point.
MSTR continued another 150% in under 30 days after it printed a GLB
Why the green line breakout works?
The GLB works based on the principle that a stock breaking out to a new all-time high after consolidation shows strong momentum and potential for further price advance. This breakout into new highs, when accompanied by significant buying interest, can lead to a sustained uptrend.
Here’s why:
1. All-Time High Psychology
- When a stock breaks into new all-time high territory, there’s no overhead resistance – meaning there are no trapped buyers waiting to sell at breakeven.
- Investors perceive it as a sign of strength and confidence in the company, which attracts additional buying interest.
2. Consolidation = Accumulation
- The 3+ month consolidation acts as an accumulation period, often shaking out retail traders and removing weak holders.
- During this time, institutions often build larger positions over time, preparing for another breakout.
- After a traditional base forms, a breakout above the green line is often accompanied by surging volume, confirming new demand.
3. Growth and Momentum Traits
- Many GLB setups also meet CANSLIM or momentum growth criteria: strong earnings, high sales growth, and leadership within a sector.
- When a stock is already in a powerful uptrend, the breakout simply continues the trend.
💡 Pro Tip: Stocks that have doubled within the past year that then continue to break into new highs can offer huge potential returns.
After a GLB, SEZL continued to advance 370% in 75 days.
How to trade the green line breakout
Before considering how to enter a GLB trade, you must first screen for stocks that are breaking out.
1. Screen for All-Time Highs (ATH):
- Look for stocks that have hit an all-time high within the past 6–12 months.
- Use screeners that include ATH or 52-week high filters.
- Sort your watchlist by % off of ATH.
2. Define the Green Line.
- Use Monthly or Weekly Charts:
- These help eliminate short-term noise and clarify trend structure.
- Look for 3+ Months of Consolidation:
- After the ATH, the stock should have formed a base of at least three full months
- Draw the Green Line:
- Mark the horizontal resistance at the all-time high on the chart.
- This becomes your buy trigger level.
3. Wait for the Breakout.
- Watch for a Clean Break Above the Green Line:
- Preferably on above-average volume, which indicates institutional participation.
- The breakout day should close above the green line to confirm the signal.
- Avoid Premature Entries:
- Do not buy before the breakout – the setup is valid only after the price closes above the green line.
4. Enter the Trade.
- Buy Immediately With a Breakout:
- Enter near the breakout level to avoid chasing extended prices.
- If you miss the breakout day, wait for a pullback and a successful retest of the green line.
5. Set a Stop-Loss
- Initial Stop: Just below the green line or below the breakout candle’s low.
- Trailing Stops: Use moving averages (10-week, 21-day EMA) or price structure (swing lows) to trail the stop.
6. Manage the Trade
- Monitor Using Weekly Charts:
- Weekly closes help avoid emotional decisions caused by intraday volatility.
- Look for tight price action, rising volume, and relative strength improving.
- Add on Strength (Optional):
- Advanced traders may add on subsequent bases or flags above the green line.
- Take Partial Profits:
- Consider selling a portion after a 20–25% gain to lock in profits and reduce emotional stress.
Although market conditions were tough in the first quarter of 2020, ZM was breaking out to all-time highs and then continued another 440%
Final thoughts on trading the green line breakout
The Green Line Breakout strategy is a powerful way to spot high-potential stocks poised for major moves.
It focuses on three key ingredients: a new all-time high, a solid 3-month consolidation base, and a breakout on strong volume.
These setups often reflect growing institutional interest and strong momentum, especially when paired with strong fundamentals. By using weekly or monthly charts, waiting for confirmation above the green line, and managing risk with smart stop-losses, you can stack the odds in your favor.
Whether you’re a momentum trader or growth investor, GLBs offer a clear, repeatable framework for catching big winners at the right time.


