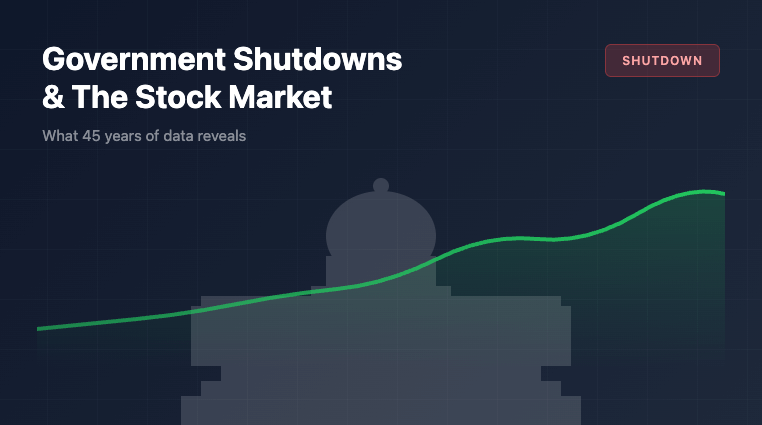
Do Government Shutdowns Hurt Stocks? The Data Says No
Published: December 10, 2025


Government shutdowns make headlines and create anxiety. But the market data tells a different story. Here’s what 45 years of history reveals about how the S&P 500 actually performs during these political standoffs.
What the Numbers Actually Show
Since 1980, the S&P 500 has posted gains one month after the start of every single government shutdown—a 100% success rate.
A Brief History: Why Government Shutdowns Became Common
Government shutdowns are a uniquely American phenomenon. Before the early 1980s, federal agencies simply continued operating during funding gaps with minimal disruption, assuming Congress would pass appropriations bills shortly.
The Evolution of Political Shutdowns
The Four Major Government Shutdowns That Actually Impacted Markets
While there have been 11 funding gaps since 1980, only four lasted long enough to broadly disrupt government operations and potentially move markets. Here’s how the S&P 500 performed during each crisis.
November 14-19, 1995 — President Clinton vetoed Republican spending bills that included cuts to Medicare, education, and environmental programs. Approximately 800,000 federal workers were furloughed.
Speaker Newt Gingrich and congressional Republicans sought to reduce government spending growth, while Clinton prioritized protecting social programs.
Congress passed a temporary funding bill after five days to allow continued negotiations.
December 16, 1995 – January 6, 1996 — The November shutdown’s temporary funding expired. About 284,000 federal workers were furloughed, costing $400 million in back pay.
Republicans demanded Clinton use CBO projections showing the budget could be balanced in seven years. Clinton refused, insisting on OMB projections requiring fewer cuts.
Senate Majority Leader Bob Dole pushed to end the standoff. On New Year’s Eve, Dole declared Republicans should end the shutdown. Public opinion turned decisively against the GOP (46% vs 27%).
October 1-17, 2013 — Congressional Republicans refused to pass spending bills that funded the Affordable Care Act. Senator Ted Cruz delivered a famous 21-hour speech protesting the healthcare law.
Furloughed 800,000 employees and delayed payment to 1.3 million workers. Cost the economy an estimated $24 billion. Congressional approval ratings fell to a record-low 9%.
Bipartisan Senate negotiations produced a deal with only minor changes to Obamacare. The government reopened on October 17, 2013.
December 22, 2018 – January 25, 2019 — President Trump demanded $5.7 billion for a border wall. Affected approximately 800,000 federal workers—380,000 furloughed, 420,000 worked without pay.
Delayed $140 billion in IRS tax refunds. Disrupted FBI investigations. Caused airports to close due to TSA staffing problems. The CBO estimated $3 billion in permanent economic losses.
Mounting pressure, particularly travel delays from air traffic controllers calling out sick, led Trump to agree to a three-week temporary deal without wall funding.
S&P 500 Performance During Government Shutdowns: What the Data Really Says
Looking beyond individual shutdowns and focusing on the bigger picture reveals a clear trend. Since the current budget process began in 1976, the U.S. has seen 21 full government shutdowns. On average, these have lasted about 8 days.
The standout stat: Since 1980, the S&P 500 has been higher one month after the start of every single shutdown. That’s a 100% success rate.
Since 1990, the S&P 500 has actually gone up during every shutdown. And over time, bigger factors—like economic growth, corporate earnings, and interest rates—have mattered far more to market direction than temporary budget standoffs.
Why Markets Remain Resilient
Limited and Temporary
Government shutdowns reduce quarterly GDP growth by an estimated 0.1-0.2% per week. However, this impact is almost entirely reversed once the government reopens because furloughed workers receive back pay and delayed spending catches up.
Markets Price Future Conditions
Investors focus on corporate earnings, economic growth prospects, and monetary policy—not temporary political dysfunction. Markets assume shutdowns will eventually end and look through short-term noise.
Shutdowns Always End
Unlike debt ceiling crises that could trigger actual default, shutdowns have clear endpoints. Public pressure eventually forces politicians to compromise. Investors understand this dynamic.
Shutdowns Are Expected
With six shutdowns since 1990, investors have experience with these events. This familiarity reduces panic selling and irrational behavior. Shutdowns no longer surprise markets.
The 2025 Government Shutdown
In late 2025, the federal government shut down for 35 days, matching the record set during the 2018-2019 closure. The shutdown began on October 1, 2025, when Congress failed to pass funding legislation for fiscal year 2026.
What Drove the Impasse
Senate Democrats and Republicans blocked separate continuing resolutions from the House. Democrats opposed Republican bills lacking extensions of Affordable Care Act subsidies. Republicans voted against Democratic bills that included these subsidy extensions.
- Approximately 900,000 workers were furloughed
- 2 million additional workers worked without pay
- SNAP faced critical funding shortages by October 20
- President Trump indicated potential permanent elimination of some federal positions
What Drove Market Strength?
Despite the shutdown lasting over a month, the S&P 500 continued trading near all-time highs throughout, demonstrating once again that markets prioritize corporate fundamentals and monetary policy over Washington dysfunction.
Artificial Intelligence
Major technology companies announced massive, multi-year commitments to AI infrastructure. Meta and Microsoft’s large-scale chip and data center investments lifted the entire AI ecosystem.
Federal Reserve
Markets priced in rate cuts throughout the fall. Without shutdown-delayed economic data, the Fed was expected to deliver “risk management” cuts.
Corporate Earnings
The S&P 500 reported blended earnings growth of approximately 8.5-9% year-over-year for Q3 2025—the ninth consecutive quarter of earnings growth. Over 83% of companies beat expectations.
Historical Precedent
With multiple government shutdowns in recent years, investors understood these were temporary political events. The market’s positive performance during the 2018-2019 shutdown provided a roadmap.
What Investors Should Do (and Not Do) During Government Shutdowns
Historical evidence and current market behavior provide clear guidance for investors navigating government shutdowns. The worst mistake is making emotional decisions based on political headlines rather than economic fundamentals.
- Maintain your long-term investment plan and asset allocation
- Focus on your investment horizon, not daily news cycles
- Consider buying opportunities if markets show weakness
- Remember that shutdowns are temporary political events
- Monitor corporate earnings—they matter more than politics
- Panic sell based on shutdown headlines
- Make emotional decisions based on political news
- Assume longer shutdowns mean worse market outcomes
- Confuse shutdowns with actual economic crises
- Time the market based on political developments
What to Monitor During Government Shutdowns
Key Areas to Watch
- Economic Data: Government shutdowns disrupt data releases. Markets may experience higher volatility when key reports are delayed, but this doesn’t change underlying economic conditions.
- Corporate Earnings: Company earnings reports continue during shutdowns and matter far more for stock prices than political dysfunction.
- Federal Reserve: Interest rate decisions and Fed commentary often have greater market impact than shutdowns themselves.
- Shutdown Duration: Surprisingly, there’s no clear relationship between shutdown length and market performance. The longest shutdown (35 days) produced the best returns.
Final Thoughts
Government shutdowns always sound scary. They dominate headlines, stir up political drama, and create real stress for federal workers and families. But when you look at how the market responds, the story changes completely.
Since 1980, the S&P 500 has gone up one month after every single government shutdown. That’s not just a trend—that’s a 100% success rate.
Markets don’t fixate on temporary gridlock in Washington. They care about earnings, growth, and interest rates. Political noise might grab attention, but it rarely moves the needle long-term. The data from past shutdowns proves it: even during some of the longest and most heated standoffs, the S&P 500 kept climbing.
“In the end, the numbers don’t lie: shutdowns shake Washington, not Wall Street.”
So, what should you take away from all this? Simple: don’t let the headlines throw you off your game. History shows that staying invested through political drama has paid off time and time again.