Consolidation Pivot Trading: Finding Early Entry Points in Market Leaders

Ross
Ross is a co-founder of TraderLion and Deepvue. He was mentored by William O’Neil, and co-authored The Model Book of Greatest Stock Market Winners at WON + Co.
Published: September 23, 2025


After 30+ years of trading and helping grow a fund from $15M to $850M, I’ve learned that the difference between catching a market leader early and chasing it at new highs can mean the difference between a 2-3% risk and a 10-15% drawdown. Consolidation pivot trading is my systematic approach to identifying these early entry opportunities in stocks that are destined to become the market’s biggest winners.
As someone who’s spent over three decades in the markets and worked directly with investing legend William O’Neil, I’ve had the privilege of studying thousands of big market winners. The key to successful growth stock trading isn’t just finding great companies—it’s getting positioned in them early, with manageable risk. This is where consolidation pivot trading becomes invaluable.
During my time as a portfolio manager at William O’Neil & Co., I helped build model books that tracked the biggest winners over multi-year periods. This systematic study revealed specific patterns that repeat in stock after stock. These consolidation pivot setups often provide the last low-risk entry opportunity before a stock makes its major move higher.
Never miss a new post from Ross Haber!
Stay in the loop by subscribing to the email list.
What Are Consolidation Pivots?
Understanding Consolidation Pivots
A consolidation pivot occurs when a stock makes an initial move higher, then pauses to “digest” those gains through tight, low-volume trading near key moving averages. These pivot points often represent the final shakeout before a significant breakout.
These patterns trace back to legendary trader Jesse Livermore’s “Shakeout Plus Three” concept. The idea is simple: after a stock undercuts a previous low (the shakeout), you add a small buffer (traditionally $3, but now adjusted for percentage) to enter early into what becomes a double bottom formation.
Why Consolidation Pivots Matter:
Most retail traders wait for the “textbook” breakout to new highs. By then, the easy money has already been made. Consolidation pivots allow you to position yourself during the base-building process, often with significantly less risk.
The pattern works because institutions and smart money are accumulating shares during these quiet consolidation periods. When the stock finally breaks out, there’s already significant buying power behind the move.
The Foundation: Tight and Logical Stop Losses
Before diving into specific setups, let me share my fundamental rule that I’ve followed for decades: “If you don’t know where your stop loss is and why before you buy a stock, you don’t have a trade.” This principle has saved my capital countless times and allowed me to stay in the game long enough to catch the big winners.
What I Mean by “Tight and Logical”
Tight: I typically aim for 2-3% risk when possible, but will go as much as 5% depending on the stock. My absolute maximum stop loss on any trade is 7-8%—no exceptions.
Logical: The stop must be placed at a key technical level where the setup has genuinely failed. This might be a moving average, prior consolidation pivot, or significant support level that makes sense for that particular stock.
Here’s where many traders go wrong with the “logical” component: You can’t simply place a 3% stop on any stock regardless of its personality. If you’ve got a stock that’s blasted off and is trading well above its 10-day moving average, and you look to the left and see that this stock can pull back 10-12% and still be healthy, it makes no sense to put a 2-3% stop on it.
How I Size My Positions
My approach to position sizing is completely methodical. I determine my maximum risk per trade first, then work backwards to calculate position size based on where I can place a logical stop. This allows me to take 20-30% positions when I can manage risk effectively, and smaller positions when stops must be placed further away.
I always know my numbers before I pull the trigger on even one share. I know my worst-case scenario if it goes against me on all my stocks. This level of preparation is what separates professional trading from gambling.
Identifying High-Quality Consolidation Pivot Setups
Not all consolidation periods create tradeable pivot points. Here are the specific characteristics I look for when evaluating potential setups—criteria I’ve developed through decades of studying winners and losers:
The Five Elements I Must See
- Two Tight Days: After an initial move higher, I want to see 1-2 days of tight, sideways trading
- Above Moving Averages: The consolidation must occur above key moving averages (10-day, 21-day)
- Low Volume: Volume should contract during consolidation—no selling pressure
- Proximity to Support: I need a logical support level nearby for stop placement
- Market Context: Ideally occurring during or after a market follow-through day
Why I Focus on “Two Tight Days”
I specifically watch for two consecutive days of tight trading action after a stock has made an initial move higher. This pattern tells me the stock is holding its gains while building energy for the next leg up. The tighter the trading range during this period, the more explosive the eventual breakout tends to be—I’ve seen this pattern hundreds of times.
Something I’ve Learned: The best consolidation pivots often form after a stock has already moved 15-25% from its base. This might seem counterintuitive to most traders, but these secondary pivots often provide the safest entry points with the highest probability of success.
How I Read Volume
Volume behavior during consolidation pivots is absolutely critical to my analysis. I want to see volume dry up during the consolidation phase—this tells me sellers are exhausted and the stock is being quietly accumulated by institutions. When volume expands on any upward movement from the pivot, it confirms buying interest is returning.
Real-World Examples from My Own Trading
Let me walk you through specific consolidation pivot trades I’ve executed recently, showing both how I identified the setups and managed the risk. These aren’t theoretical examples—these are actual trades from my own portfolio.
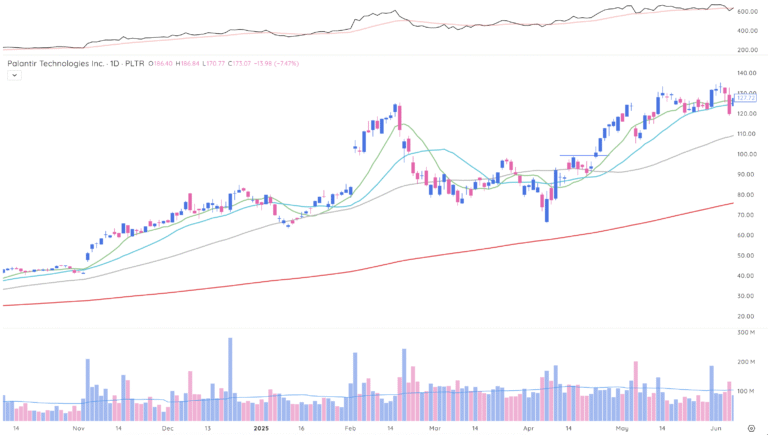
Case Study 1: My Palantir (PLTR) Trade – The Perfect Setup

PLTR showing the classic consolidation pivot I traded
This PLTR setup was what I call “absolutely irresistible.” After the stock made a massive push higher, it gave me two tight days above all the major moving averages. The setup offered multiple stop-loss options—I could use the 10-day MA, 21-day MA, or the recent pivot low.
Why I Couldn’t Resist This Setup
- Massive Initial Push: The stock had already proven its strength with a significant move
- Perfect Consolidation: Two consecutive days of tight trading above all moving averages
- Multiple Stop Options: I could place my stop at any of several logical levels
- High Liquidity: High-priced, liquid stock allowing for larger position sizes
- Exceptional Risk-Reward: I could put on 20-30% and take minimal downside risk
This was exactly the type of setup where I put on 20-30% right from the get-go. The risk-reward was so compelling that I was willing to take the chance it wouldn’t gap down below my stop levels. Having multiple logical stop choices gave me confidence in the trade structure.
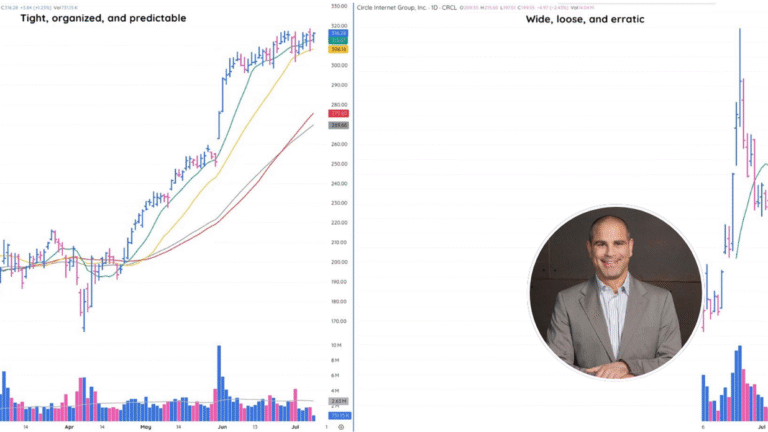
Case Study 2: Netflix (NFLX) – Following the Leader

NFLX demonstrating the leadership behavior I look for
Netflix provided a perfect example of how I like to see true market leaders behave. This stock consistently respected its 10-day moving average, giving me multiple opportunities for entries with very tight stops. When I see this kind of technical behavior, I know I’m dealing with a real leader.
Why I Watch the Leaders: Netflix was one of the first stocks to break out and make new highs during the market’s recovery. When leading stocks like NFLX start moving first, it tells me the broader market trend is probably strengthening. This is invaluable market intelligence.
What I love about trading leading stocks during their consolidation pivots is their tendency to “trade tight and logically.” Netflix would hold the 10-day moving average during minor pullbacks, then move to the 21-day MA during deeper corrections. This gives me very clear and predictable levels for my risk management.
Case Study 3: My Robinhood (HOOD) Experience – Patience Pays

HOOD showing how I handled an intraday U-turn setup
The HOOD example shows how I handle situations where a stock doesn’t quite reach my ideal entry level. Rather than chasing or giving up, I waited for what I call an intraday U-turn pattern to develop. This requires patience, but it’s often worth the wait.
The Intraday Pivot Entry Method
When a stock stops declining and begins to turn higher intraday, I switch to shorter timeframes to fine-tune my entry. I wait for the U-turn to confirm, then enter with a stop below the intraday low or my predetermined daily support level. The key is patience—I don’t force the trade.
I learned long ago that being patient pays, especially in volatile market conditions. I’d rather wait for my exact setup than take something that’s “close enough.” This discipline has saved me from countless poor entries over the years.
When My Consolidation Pivot Setups Fail
Not every consolidation pivot I trade leads to a successful breakout—I wish it were that simple! Understanding how to manage failed setups is absolutely crucial for long-term success. I’ve learned this the hard way over three decades of trading.
Becoming a Robot When Cutting Losses
One of the most difficult aspects of trading is maintaining objectivity when a position moves against you. Over the years, I’ve had to become “like a robot” when it comes to cutting losses. The more mechanical I can make this process, the less emotional damage it causes me.
Something I’ve Learned the Hard Way: Not losing money is a huge deal, which I don’t think most people understand. Protecting my capital during failed setups allows me to be properly positioned when the next high-probability opportunity comes along.
How I Handle Re-entry After Being Stopped Out
Getting stopped out of a position doesn’t mean I’m done with that stock forever—not at all. I frequently re-enter positions after being shaken out, often at higher prices, when the technical setup improves again. The key is staying objective about the stock’s price action rather than getting emotionally attached to my original entry price.
I’ve learned that if a stock sets up properly at a higher level with manageable risk, it can still represent a good trading opportunity. My ego has cost me money in the past by preventing me from buying back higher—I don’t make that mistake anymore.
Why I Use Closing-Basis Stops
Unless a position hits my maximum 7-8% stop loss intraday, I make all my stop-loss decisions on a closing basis. This approach has saved me from getting shaken out by intraday volatility countless times. This is especially important in powerful bull markets where stocks often open weak and close strong.
I always try to give myself that benefit of waiting until the close, unless I’m forced to use my max sell stop during the day. Then I have no choice—I’m out immediately.
How I Built My Pattern Recognition Skills
Developing the ability to quickly identify high-quality consolidation pivot setups didn’t happen overnight. It required years of systematic study and practice. Much of my expertise comes from building “model books” during my time at William O’Neil & Co.—and I can’t thank Bill O’Neil enough for asking me to do this work.
The Model Book Approach That Changed My Trading
A model book is a systematic study of the biggest stock market winners over a specific time period. I worked with Mike Webster building model books for Bill, analyzing winners from 1998-2000. By studying how these stocks behaved during their base-building phases, I began to recognize recurring patterns.
- Start with 3-5 current market leaders that clearly show the patterns
- Study their consolidation phases and identify where you could have entered
- Compare what actually happened vs. what your rules would have dictated
- Gradually expand to include more historical examples
The great part about building model books was that Bill had final say on all the stocks that went in. I learned so much from seeing what I thought were model book stocks versus what Bill would actually select and why. That contrast taught me more about quality than I could have learned any other way.
Learning My Trading Personality
Not every trader will be successful with the same stocks or setups, and I’ve had to learn this about myself. There are certain stocks I’ll look at the chart and just go “forget it”—I know I’ll get shaken out. I’ve learned to be honest with myself about this.
Self-Awareness Saved My Career: Learning which stocks and setups match my temperament has been crucial for my consistent success. I look for stocks that tighten up and trade directionally while giving me clear warning signs when they’re getting tired.
I’ve developed a feel for stocks that respect their moving averages and consolidate properly rather than making wild swings. This intuition came only through extensive study and years of real-time market experience—there’s no shortcut to this knowledge.
How I Watch Market Context and Group Rotation
Individual stock setups don’t exist in a vacuum, and I’ve learned to constantly monitor the bigger picture. The strongest consolidation pivot trades often occur in stocks that are part of leading industry groups during favorable market conditions. I spend time every day tracking group rotation and focusing on sectors showing the most institutional sponsorship.
When I see software names like Rubrik, CrowdStrike, and Zscaler all shaping up together, all starting to curl up and find support at their moving averages, that tells me where to focus my attention. Group confirmation is extremely powerful for trade selection.
My Current Market Outlook
Understanding consolidation pivot patterns is just one piece of successful growth stock trading.
The real edge comes from combining this technical analysis with deep fundamental research,
market timing, and the experience to know which setups offer the best risk-reward
opportunities.
Based on what I’m seeing right now, I think we could have a solid bull market ahead of us.
There’s going to be plenty of opportunity, so I don’t care if you feel like you’re behind the eight-ball—you’re absolutely not.
Stay calm. There are going to be plenty of opportunities on stocks that you think you missed and on new stocks that you don’t even realize are there yet.
If you want to learn how I apply these consolidation pivot techniques in real-time market conditions,
I break down the market’s strongest setups every Friday in my TML Talk sessions. I analyze emerging leaders,
discuss current consolidation pivots, and answer specific questions about applying these techniques to your own trading.
Frequently Asked Questions
My Key Trading Principles
Stay patient, manage risk, and be ready for the opportunities ahead
Related articles
-
Modern CANSLIM Strategy: How to Trade Growth Stocks in Today’s Volatile Market
September 17, 202511 min read -

-

How To Use The Relative Strength Line To Find The Best True Market Leaders
September 11, 20258 min read -

How to Analyze Stock Industry Group Strength and Why It Matters
June 16, 20229 min read