TSLA Standing Out – Stocks to Watch and Market Analysis

Richard Moglen
Stock Trader & Student of the Markets. I help traders improve their systems & performance at TraderLion & Deepvue
October 27, 2024


Market Action
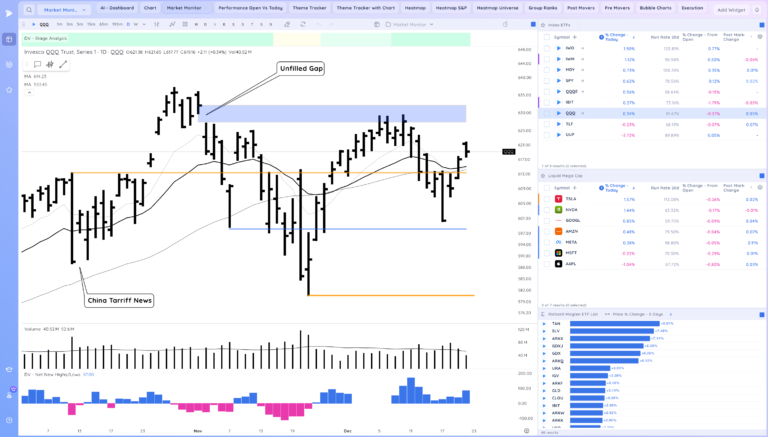
QQQ – Gap up and push but then a close near lows. Short term indecision
Short Term Expectation based on the close is consolidation or lower
Bulls want to see us build hear hold near the gap area and then reconfirm higher
Bears want to see us follow through down, close the gap and undercut the 21ema next week

IWM – downside reversal at the 21ema

Trends (4/4 Up)
Shortest – 10 Day EMA – Above Rising
Short-term – 21 ema – Above Rising
Intermediate term – 50 sma – Above Rising
Longterm – 200 sma – Up – Above Rising
Never miss a post from Richard Moglen!
Stay in the loop by subscribing.
Starts This Week! – Don’t miss the High Tight Flag Masterclass with Leif Soreide!
We are hosting a High Tight Flag Masterclass with Leif on Nov 2 and Nov 9. Leif will be sharing his full process for Identifying, entering, and exiting these high potential setups, which can dramatically improve your performance.
- Learn advanced alternate entries to manage risk while trading high momentum growth stocks
- Learn Leif’s sell rules to maximize returns
- Learn Leif’s personal screening and trading routines

You can join hundreds of traders and register using the button below. Live spots are limited!
Groups/Sectors – % Change
From yesterday’s close on the left, from today’s open on the right

Performance Charts from Deepvue
S&P 500

Deepvue Leaders Heatmap

Heatmap from Deepvue
Group Ranks: 1 Day, 1 Week, 1 Month, 3 Month from left to right

Key Stocks in Deepvue
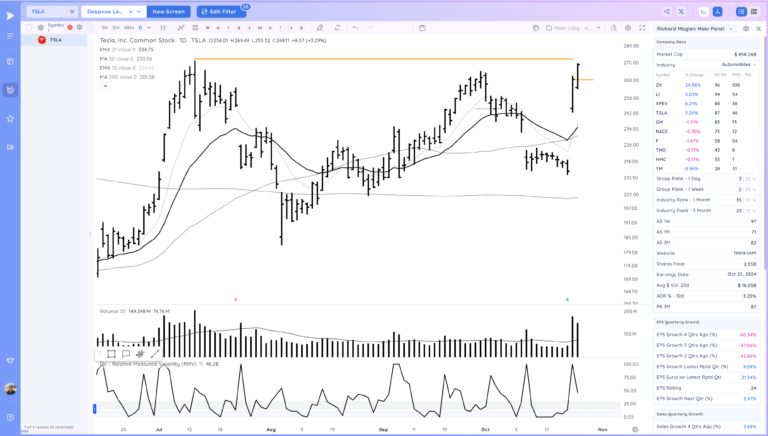
TSLA strong follow through – 272 is the big level to start the weekly and monthly uptrend. lots of volume and power here

TSLA Weekly – Superior. EPS and Sales lines below, seem to be turning a corner. Annual estimates revised up

NVDA tried to push up from inside day but faded. I want to see it respect the orange level

META see if it can build from this gap up

ZK Explosive, looked at this many times last week near the 21ema as it formed a tight area

VIST breakout

ONON pop through the 21ema

DUOL got the move from the tight area after the shake to the 21ema, watching for follow through

RDDT riding the 10ema

ALAB short term stretched feeling but showing consistent RS

TSM still u turning, move from inside day. See if more side ways is needed

RBRK showing the value of finding early and tight areas. Whippy up hear near the pivot. one to stalk to see if it sets up another spot

HIMS tight action on the 10ema. No follow through down so far on that bar, see if it pushes up or loses the 10ema

ANET tight on the 21ema. Downside reversal friday

CCJ pullback

CEG tight at the 21ema in this base. Earnings Nov 7

VST same story as CEG

SMR flag post breakout. LEU tight at 10ema

CCL 10ema flag

COIN tightening under the level

UPST 10ema flag. Not best close but inside day

MSTR trending but maybe a bit short term stretched form 10ema

DECK big volume gap up from base lows

Market Thoughts
See how we act early next week after the fade. If we gap monday see if we hold or roll over.
Day by Day – Managing risk along the way
Recent Trade Lab Reports
-
-
-
Reclaim of the Level to End the Week. Space Theme in Focus
December 19, 202514 min read -