The Nasdaq Reverses down as NVDA hits key level

Richard Moglen
Stock Trader & Student of the Markets. I help traders improve their systems & performance at TraderLion & Deepvue
October 7, 2024


Market Action
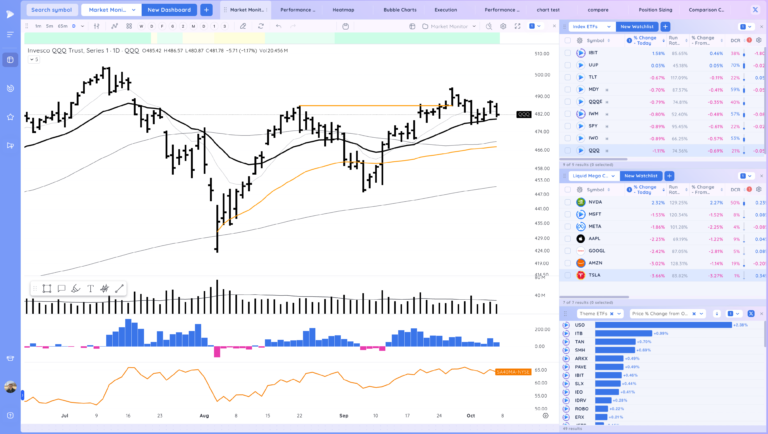
QQQ – slight gap down, and continuation lower undercutting the friday low. Above the 21ema
Short Term Expectation based on the close is consolidation or continuation lower. 21ema is a key level
Bulls want to see respect for that level and reversal back up
Bears want to see us follow through down and undercut the 21ema

IWM – similar action, but better close off lows

Trends (4/4 Up)
Shortest – 10 Day EMA – Above Rising
Short-term – 21 ema – Above Rising
Intermediate term – 50 sma – Above Flat
Longterm – 200 sma – Up – Above Rising
Never miss a post from Richard Moglen!
Stay in the loop by subscribing.
Powered by the Leif Soreide Hight Tight Flag Masterclass
We are hosting a High Tight Flag Masterclass with Leif next month. Leif will be sharing his full process for Identifying, entering, and exiting these high potential setups, which can dramatically improve your performance.

You can register using the button below. Live spots are limited!
Groups/Sectors – % Change
From yesterday’s close on the left, from today’s open on the right

Performance Charts from Deepvue
S&P 500 % Change from Open vs Relative Volume

Deepvue Leaders Heatmap

Key Stocks in Deepvue
NVDA followed through higher but faded slightly after hitting that key level

TSLA slightly below the 21 ema now ahead on 10/10 robotaxi event

META downside reversal, remains above the 10ema

GNRC breakout on volume. may be linked to recent hurricane impacts

MSTR some follow through

HIMS gap up, addition to an ETF news but this has had good closes despite that gap down

CART nice action after the base pivot retest

VITL push above the shelf
LNTH tight 2 days above the 21ema

KVYO tight above the 10 ema, getting close to highs

PDD tight range. China related stocks very volatile but powerful moves

SE tight at the 10ema

AHR 21ema pullback

CORZ could not quite push out

CAVA tigth day at the 10ema

AFRM at this key level, in a range

ASTS inside day, early pivot at the 50 sma and today’s highs

UBER still near the level fade from highs

TEM starting to form a range near the MAs at the bottom of the base

Market Thoughts
See how NVDA acts after today’s fade. Overall not too many stocks in prime spots.
Day by Day – Managing risk along the way
Recent Trade Lab Reports
-
-
-
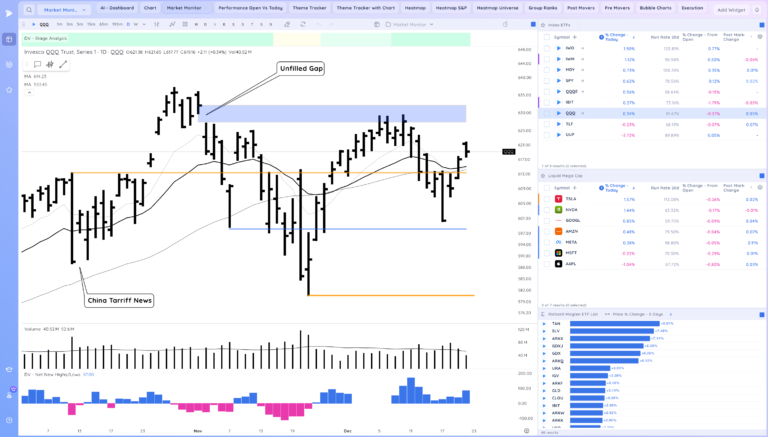
Reclaim of the Level to End the Week. Space Theme in Focus
December 19, 202514 min read -