The EMA Reversal Short Trade Setup – Trade Lab Educational Article

Richard Moglen
Stock Trader & Student of the Markets. I help traders improve their systems & performance at TraderLion & Deepvue
March 9, 2025


During this correction I have been focusing on studying a repeatable short setup that I can use to take advantage of quick swings.
Currently my trading system focuses on the long side. This is largely because:
- The longer term trends favor uptrends
- The Market is more often in an uptrend than downtrend
- Down cycles are faster, more volatile up and down
- Longer term trends have more potential upside
That being said, down-cycles can produce quick swings that are perfect for selling (covering) into strength.
The EMA Reversal Short Trade Setup
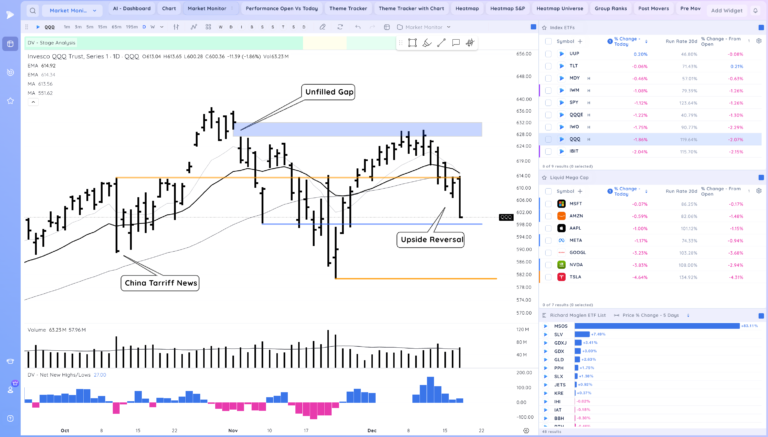
The setup I am studying is the EMA reversal (ER) short trade setup. This occurs when a stock has started a sharp downtrend with an initial break lower, rallies up into declining MAs/ key levels and then reverses lower, setting up a logical and tight stop loss at the high of the reversal day.
With this setup, I am looking for quick 2-3 day moves, then taking profits. (only holding more than one day if there is cushion)
Here is an example with RDDT recently:

RDDT ER Example 1
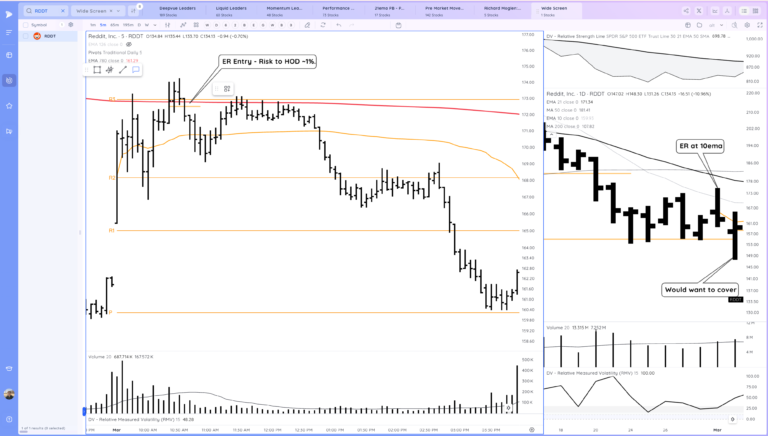
Let’s focus on the first 10ema ER.
Here we have a 5 min chart on the left with a daily on the right. The Red MA is the daily 10ema on the 5 min timeframe.
Never miss a post from Richard Moglen!
Stay in the loop by subscribing.
I would only be looking to enter as it rallied up into the 10 ema, the market and growth names weakened, and it started to reverse down off of the 10ema.
The stop would be the high of the day and depending on how the stock closes I would consider holding for potential follow through down

The entry would be as RDDT rolled over below the 10 ema after wicking into that area as well as the confluence of R3. The stop would be the high of day ~1% risk. This would allow for a 20% position risking very little.
RDDT followed through but did rally back into R3 testing the short entry, however there was never much heat and RDDT fully rolled over with the market and closed near lows with the short position up about 5% at the close.
The close is decision time. This would be enough to hold through, especially since that day the QQQ closed very poorly and looked to follow through down.
Here is the next day which would be when you would want to cover on this trade:

The market and RDDT did follow through lower and RDDT broke below the key level it had been basing off of. At this point you would be watching for acceleration down or a potential rally.
RDDT pushed through S2 and then rallied sharply, reclaiming it. Short sellers would want to be covering some into the break through S2 into weakness then cover the rest as RDDT started to rally strongly off S2.
Overall this short trade would have been about 10% profit depending on the entry and exit.
Notice how for this short setup the profit taking rules are faster – this is required for shorting since rallies can be incredibly fast.
RDDT ER Example 2
Now let’s cover example 2.
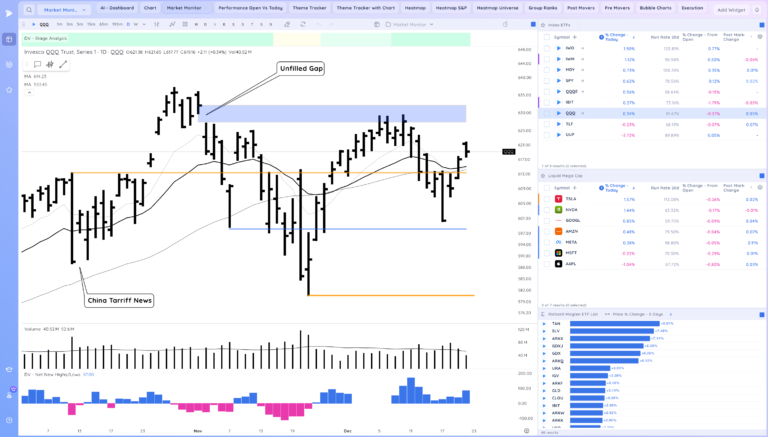
RDDT had actually been showing good strength but we get a gap down with the market and RDDT sets up another short opportunity as we roll over after an initial rally.
During a correction, rallies into potential resistance are always suspect.

Here RDDT rallied into the confluence of the daily 10ema area (on the 5 minute chart it looks far away but on the daily it’s right there) the standard pivot point, and the key higher low from the prior day.
It “stuttered” at this level with wicks before rolling over at which point risk could be managed versus the HOD for around 1% risk again.
RDDT trended down the rest of the day, never retesting the short entry and closed down about 8% from the entry. RDDT also broke the key range lows it had been building
At the close again it was decision time. With the cushion and the shape of the daily chart, it was warranted to hold at least some of the short through. Here is what RDDT looked like on a daily from my Thursday report:

The next day, RDDT gapped down and you would be on guard for a rally and potentially ready to cover if we broke above the prior day’s close
However RDDT rolled over shortly and then it would be more about locking in profits around S2, as RDDT based and rallied, or any remaining near the close.
These trades would have yielded about 15% profit.

Drawbacks of Shorting
These two examples obviously worked out, and I used them to better show the decision making process.
Shorting is more difficult, for the reasons I outlined at the start of the article.
I would only be using this setup for a handful of trades when the market is correcting sharply, I’m largely in cash, and ideal spots present themselves with confluences of levels.
During a sharp correction, there is always the opportunity for significant gap volatility in either direction. That is why sell rules are usually much faster, and selling into strength is used much more frequently
Key Points
The biggest concept I want you to take away from this article is that for shorting, you want to first and foremost risk very little and be ready to cover quickly – In volatile markets especially, protecting yourself and your capital is job #1.
Second, the ER is an example of a short entry where you are looking for a key level to be tested/broken in a stock and market that is already weak (gap downs, breaking MAs + levels…). We are looking ideally for not just one level but a confluence of levels such as pivot points, range highs/lows, prior day’s lows/closes etc…
We are also looking for the stock to actually be moving down before entering the short. We also don’t want to be shorting a market/stock that is too significantly oversold, ideally it is rallying up or forming a short range on a daily.
Third and lastly for shorting we use much faster sell rules to cover and would need a good cushion to hold through another day.
Homework
Here are some more recent examples of ERs
PLTR (Did not really follow through lower so a good example of the reality of trading)

BROS here the key level was not an EMA but the Earnings Gap low

BROS Also setup thursday after the gap down as it rallied into S1 and the prior day lows before rolling and undercutting another key level

HIMS setup for an ER with confluence between the 21ema and prior range high

Recent Trade Lab Reports
-
-
Reclaim of the Level to End the Week. Space Theme in Focus
December 19, 202514 min read -
-