Small Caps Break Out!

Richard Moglen
Stock Trader & Student of the Markets. I help traders improve their systems & performance at TraderLion & Deepvue
October 11, 2024


Market Action
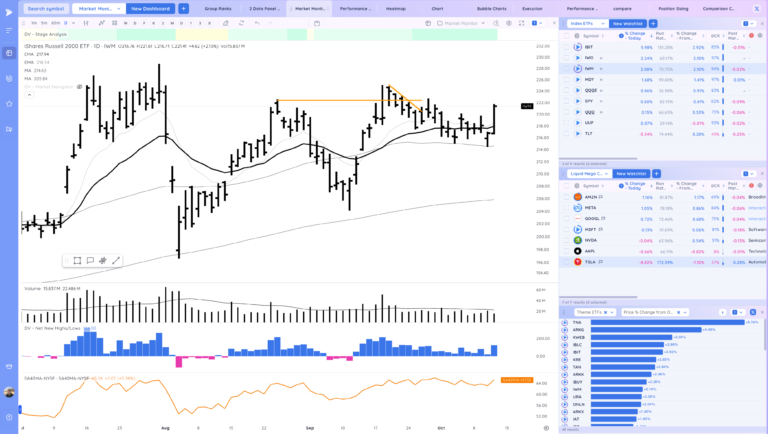
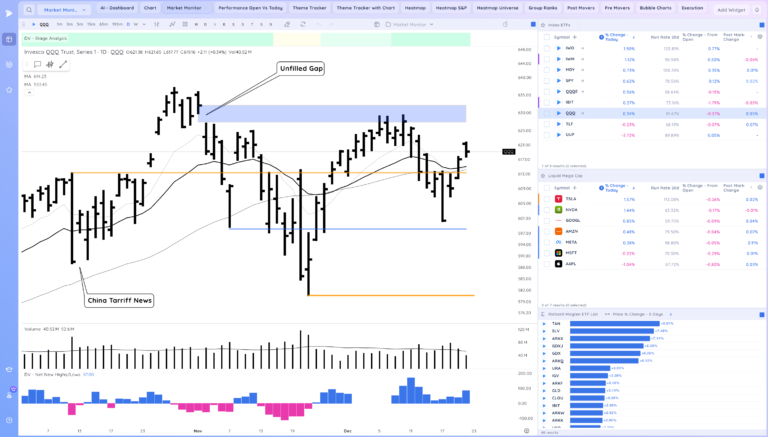
QQQ – very similar action to yesterday, closing the week tight
Short Term Expectation based on the close is consolidation or continuation higher
Bulls want to see continuation up towards highs
Bears want to see us reverse down and close the week negatively
With this type of coil can have a wide range monday

IWM statement day as we follow through

IBIT also strong action popping back through the 21ema. Looking to see if this finally starts a trend higher.

Trends (4/4 Up)
Shortest – 10 Day EMA – Above Rising
Short-term – 21 ema – Above Rising
Intermediate term – 50 sma – Above Flat
Longterm – 200 sma – Up – Above Rising
Never miss a post from Richard Moglen!
Stay in the loop by subscribing.
Powered by Deepvue – Special Offer
We just added a new key feature to the platform. You can now add Data panels to your dashboard to make a fully customizable layout based on the most important information for you. You can analyze technicals and fundamentals all together along with visualizing markets in a whole new way with real time bubble charts, heatmaps, and performance charts.
We are always working to add new features, seek feedback from users, and make Deepvue better.
Not a Deepvue subscriber yet? – Try 2 Months for only $39 here

Groups/Sectors – % Change
From yesterday’s close on the left, from today’s open on the right

Performance Charts from Deepvue
% Change Current Week and over 1 month

Group and Sector Ranks over the past day, week, month, and 3 months

S&P 500 % Change from Open vs Relative Volume

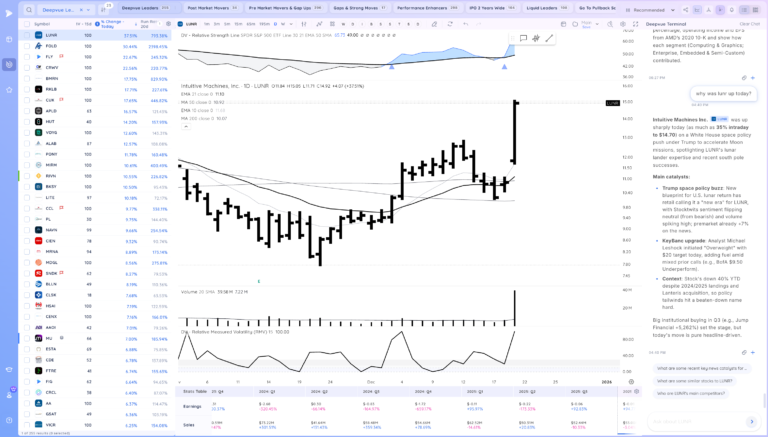
Deepvue Leaders Heatmap

Key Stocks in Deepvue
NVDA grinding higher and tightening. ideally get a short pullback/shelf before ATH attempt

TSLA gap down after robotaxi event. We’ll see if it holds close to today’s close or progresses lower

META good action off the 10ema

MSTR breakout to new highs. This has been leading

AFRM great action from the RMV5 tight range near the key level, reconfirming today

UBER breakout to new highs

SYM now +25% from RMV tight area in 2 days. This is a great swing trading indicator

UPST base breakout. RMV 0 yesterday

TEM push higher, still forming a base low. Watching for pop above the 21ema

RDDT strong action off the 10ema

BEKE supported at key level

SE push from the tight shelf

Z reclaim of the 21ema

CORT swing trade idea for next week

DUOL tight in this shelf

CPNG tight range

CEG powerful off the 21ema today, watch for follow through

VST very similar

ONON tight on the 21ema, you do have a recent slight gap down

RKLB forming a shelf, move from inside day

ASTS reclaiming the level

Market Thoughts
Still seeing widespread good action. Names surfing the 21 and 10 emas
Day by Day – Managing risk along the way
Recent Trade Lab Reports
-
-
-
Reclaim of the Level to End the Week. Space Theme in Focus
December 19, 202514 min read -