NVDA and APP Break Out! – Mega Caps Diverge

Richard Moglen
Stock Trader & Student of the Markets. I help traders improve their systems & performance at TraderLion & Deepvue
October 22, 2024


Market Action
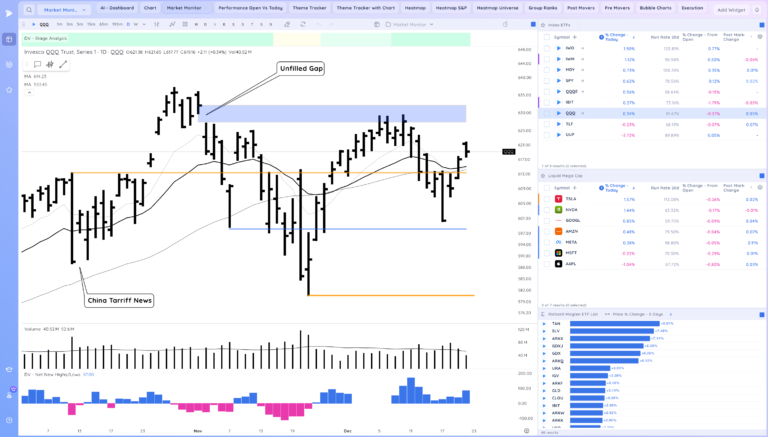
QQQ – Nice outside day, if this was a stock I would be expecting a breakout on high volume. with that as the expectation we can determine was is healthy and normal action going forward
Short Term Expectation based on the close is consolidation or push higher
Bulls want to see us breakout through the reversal down day high
Bears want to see us attempt a breakout and fail or simply undercut today’s low

IWM – negative action as we break the recent lows. Not great seeing a divergence like this from the QQQ and IWM, expectation is a 21ema test

Trends (4/4 Up)
Shortest – 10 Day EMA – Above Rising
Short-term – 21 ema – Above Rising
Intermediate term – 50 sma – Above Flat
Longterm – 200 sma – Up – Above Rising
Never miss a post from Richard Moglen!
Stay in the loop by subscribing.
Don’t miss the High Tight Flag Masterclass with Leif Soreide!
We are hosting a High Tight Flag Masterclass with Leif on Nov 2 and Nov 9. Leif will be sharing his full process for Identifying, entering, and exiting these high potential setups, which can dramatically improve your performance.
- Learn advanced alternate entries to manage risk while trading high momentum growth stocks
- Learn Leif’s sell rules to maximize returns
- Learn Leif’s personal screening and trading routines

You can join hundreds of traders and register using the button below. Live spots are limited!
Groups/Sectors – % Change
From yesterday’s close on the left, from today’s open on the right

Performance Charts from Deepvue

Deepvue Leaders Heatmap

Heatmap from Deepvue
Group Ranks: 1 Day, 1 Week, 1 Month, 3 Month

Key Stocks in Deepvue
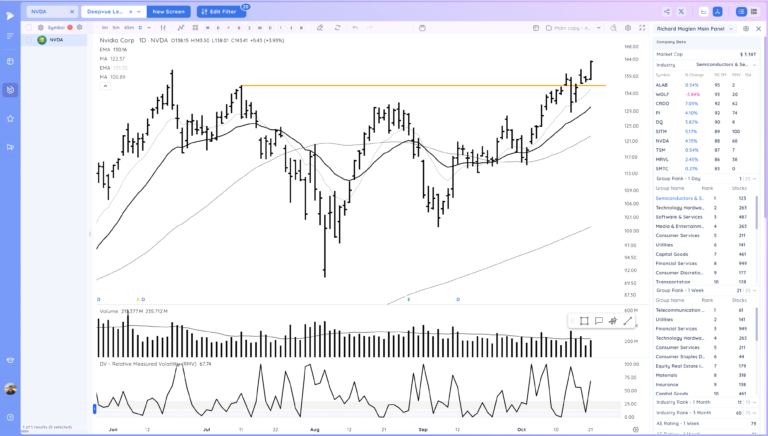
NVDA breakout! No big volume here though

IBIT upside reversal and forming a range here

APP reconfirmation. note how RMV5 when to 0 friday. RMV can really help you spot coiled stocks

ZIM follow thorugh up. Expansion from the tight range against the 21ema

CRDO push from a subtle tight area. Strong estimates

HUT follow through

PI strong upside reversal off first pullback to the 21

HIMS has been strong up the right side

LLY can watch for a 21ema reclaim

CEG tight 2 days

CVNA tight range

HOOD upside reversal off the 10ema and back in range

SHAK VCP

SHOP tight

SMTC tight at the 21ema

UPST flagging

ALAB nice upside reversal

WVE tight flag

TEM still in the bottom of this base

TSM can watch for a u turn

DUOL likely tries again tomorrow. I would ideally like an upside reversal off the 21ema

VST tightening

GDS in this flag

COIN inside day at a level

SE upside reversal off prior RMV pivot

SMR tight after the recent push on nuclear theme

META upside reversal off 21ema

TSLA tight before earnings

Market Thoughts
Mixed action between megacaps and small caps. See if NVDA holds up
Day by Day – Managing risk along the way
Recent Trade Lab Reports
-
-
-
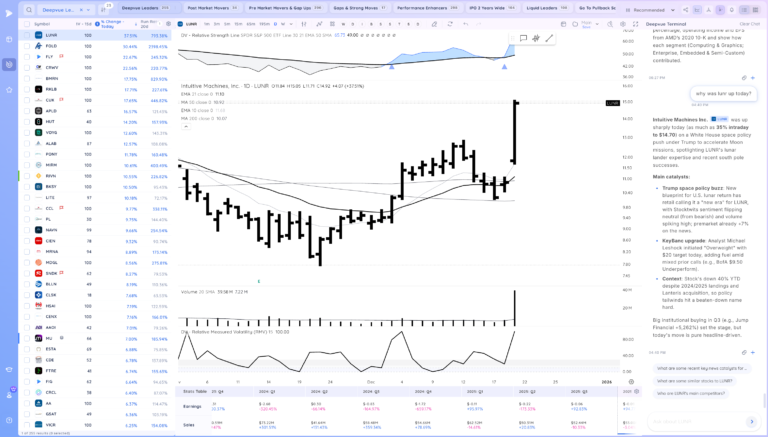
Reclaim of the Level to End the Week. Space Theme in Focus
December 19, 202514 min read -