Model Stock Case Study – TSLA 2019 – 2021 – Dec 2024

Richard Moglen
Stock Trader & Student of the Markets. I help traders improve their systems & performance at TraderLion & Deepvue
December 21, 2024
[kt_reading_time]


Model Stock Case Studies
The purpose of this monthly article is to study fantastic market leaders from the past to build a blueprint of what to look for in the future.
Each Article will cover
- The context, story, fundamentals of the company
- The Model Book Move
- Key Setups
- Important Takeaways and Lessons
This month in Dec 2024 we are analyzing perhaps the stock traders can learn the most from: TSLA.
We will be focusing on the move that started in 2019 with an earnings gap and ended in 2021 with a climax run.
The overall 1900% Rise can be split into 3 distinct moves:

We’ll analyze each of these moves and the setups within them.
Case Study Video
Move 1: 180% in 15 Weeks from the Earnings Gap Setup
Weekly Chart:

The first major move was from an earnings gap. It occurred up the right side of a 2 year base that was part of an even larger consolidation.
Here is the daily chart:

The earnings gap occurred on the largest daily volume in over a year – the HV1 edge. Not only that, the follow through on Day 2 also occurred on even higher volume.
This suggested a key character change in TSLA and overwhelming demand for the stock.
What drove this demand? TSLA had reported a surprise profit and that execution of it’s expansion of new factories and new vehicle models was ahead of schedule. The key question with tesla up to this point was if it could become consistently profitable. This earnings report indicated a key turning point and answer to this question.
Here are the earnings quarters from Deepvue and analysis from CNBC.

The Earnings gap and day 2 were the first potential entry points into what would become a historic model book move.
Remember, as we have discussed in previous weekly case studies, in order to trade Day 1 or 2, you need to have routines where strong gap ups on great catalysts will get on your radar.
In Deepvue you can screen for strong moves after hours, For instance, AVGO was a recent Earnings gap that then rose 16% from the open on Day 1. It showed up the night before on my Post Market Movers Dashboard:

Back to TSLA, which would have also shown up in that screen. It could now have been on your radar
Let’s take a look at the 5 minute chart in Deepvue to analyze potential entry points where we could manage risk.

Day 1 pulled back initially, before u turning and forming an intraday base.
The best opportunity would have been an entry early on Day 2 after TSLA initially pulled in and then rallied strongly, through this intraday base pivot.
You would have been able to establish a core position (15-30+% of portfolio) while only risking around 1.2% on the position or less than 0.5% of total equity.
Here is the action on a 65min timeframe, by the end of the day you have a gain many multiples of your initial risk.
This chart starts on the left with the earnings gap up

Coming back to the daily chart, after the day 2 opportunity, TSLA presented multiple spots to enter before it really took off.
You had a range breakout after the first pullback. Then after a nice push higher, TSLA did gap down on the cybertruck announcement.
Depending on your stop, you may have been stopped out from the range breakout for a small gain.
No worries as there was no follow through lower and in early december TSLA set up again for a range breakout against the 21ema, my bread and butter setup.

From the range breakout TSLA pushed up towards the mini base pivot and tightened one last time, giving you another chance to enter on the breakout.
TSLA then pushed through the ATH (green line) and trended above the 10ema until the climax top, not really providing any additional entry points really outside of maybe an add on the oops reversal, but also being relatively easy to let work.
Here it is versus the QQQ to show how the best market leader moves happen as the market is emerging from a correction

The climax top would have been the point to sell into strength and the last on weakness at the break of prior day gap up lows. After the climax top, TSLA did try to rally before rolling over with the market in the 2020 correction

Move 2: 700% in 45 Weeks – Key Setup: VCP Breakout
The next move we will cover was the longest in duration and biggest in magnitude. It spanned from April 2020 to February of 2021.
Here is the move on a weekly chart:

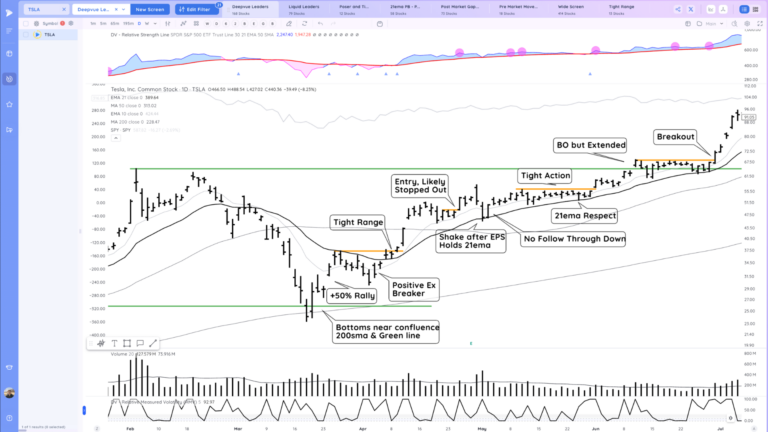
After the 2020 correction, TSLA was one of the key names popping up on RS scans. It had bottomed right on the confluence of the 200 day SMA and prior all time high and set up a higher low by the time the market was getting ready for the follow through day

Lets zoom in on the bottoming action:

TSLA had a 50% pop off lows before pulling back after hitting the 21ema. It looked like it was going to rollover but instead put in a positive expectation breaker with a gap up and then another one where it formed a tight day.
The next day it popped through the 21 ema, tightened for one more day and then starting pushing higher. This tight range is likely the earliest quality entry point you could have gotten.
From there it moved strongly, giving you immediate cushion before shaking after earnings but never breaking the 21ema on a closing basis. After this pullback was another expectation breaker which set up a series of tight areas that you can see below

These were very tight and on declining volume, textbook accumulation.
The best entries were from the inside day and up setup from the may tight area above, and then on the outside day which reclaimed the ATH
Inside days, upside reversals, and outside days “prime” larger setups help you time and manage risk more effectively.
In the chart above you can see the 3 criteria I like to look for on these ranges.
From the last breakout on the right TSLA immediately pushed higher, as the best breakouts do, giving you a nice cushion.
As I have mentioned before, there are 4 main ways to trade ranges
- Accumulation versus lows
- Anticipation of a breakout
- Undercut and rally
- Standard breakout


These can be used in combination to build a core position which managing risk tightly.
After the strong move from the VCP setup TSLA put in a reversal bar and short base

TSLA leaked below the 21ema before puttin in another positive expectation breaker on the catalyst of the stock split. This lead to a 60% move before TSLA pulled back shortly, broke below the 10 and 21ema and formed a longer base
During this base there were several headfakes before ultimately TSLA found the reason to push higher in the S&P 500 inclusion announcement.

The inital gap higher faded but like the original earnings gap in move 1, the best opportunity came on day 2 as TSLA pushed through the resistance level.
The the other moves TSLA trended well above the 10 and 21ema, before putting in a tight but extended base
From here we tried to break higher but could not hold, gapped down, and ultimately leaked below the 10 and 21ema, leading to a major base and the end of move 2.
In the moment this looked like a high tight flag, but it’s important to remember the overall context, how far TSLA had already come and respect risk and weakening signs even if trying it.

Move 3: 60% in 6 Weeks from VCP
Move 3 took a longer correction to setup. TSLA pulled back all the way to the 40 week moving average before grinding along it until it setup a new VCP setup.

On the daily you can see the respect for the 200 day, and then again the 21ema as TSLA from the base

This VCP base was not nearly as clean as the one in move 2, but it did set up very tight ranges, some even within 5%
The best entry was an outside day just below the higher timeframe pivot. TSLA then tightening again before starting to push higher

This lead to the climax run. You woudl want to be out of your last bit that you didn’t sell into strength as it took out the low of the gap down day and broke belwo the 10ema in close proximity. This would have been kept you within 10% of highs.
If you thing about that unfilled gap, the pscuhology of the two tight days beofre it, you would expect a gap up, then it does the opposite, gapping down and being unable to fill that gap.

That gap was only filled recently in 2024 on the recent move. Here is a weekly showing the basing period for another 3 years and the drawdown of 75%

TSLA in the current move setup multiple bases, and most recently was actionable in a tight base after the earnings and then election related gaps

before that last ideal entry it setup a very nice tight range and “primed” itself with an outside day.

Currently it is pulling back with the market and we’ll see if it can push off the prior all time high and setup for another move higher
Growth estimates are favorable as it looks to again expand it’s operations into robotics and new vehicles.

Key Takeaways and Lessons from TSLA
This is a good example to go over since it would have led to an initial stop out and required a re-entry.
It’s worth considering for yourself wether it would have been worth it to trade it, given that it was a biotech. The max size I would go with would be 10%. For me probably more worth it to focus names I have more confidence and can understand the catalysts/theme better
What were your key takeaways from this case study? Let me know in the comments
Additional Homework
To keep studying – analyze the IPO move from TSLA back in 2013. Both in terms of technicals and fundamental catalysts

Model Book Case Study Feedback
Since this was the first model book case study, please let me know your feedback and suggestions on what to add/change in the future.
Also drop below any stops/model book moves that you would like me to analyze.
NVDA in 2023/2024 was my plan for the next one.
In future ones we will also tackle specific aspects of trading such as sell rules to keep you in a big winner, let me know any ideas you have below
Have a great weekend!
Warm regards,
Richard