Model Stock Case Study – NVDA 2022 – 2025

Richard Moglen
Stock Trader & Student of the Markets. I help traders improve their systems & performance at TraderLion & Deepvue
March 3, 2025
[kt_reading_time]


NVDA Model Book Stock Case Study Webinar
Model Stock Case Studies
The purpose of this monthly article is to study fantastic market leaders from the past to build a blueprint of what to look for in the future.
Each Article will cover
- The context, story, fundamentals of the company
- The Model Book Move
- Key Setups
- Important Takeaways and Lessons
This month we are analyzing the strongest stock of the past few years: NVDA
We will be focusing on the move that started in early 2023 with a new momentum zone all the way to the current price action with a potential topping phase.
The overall ~1000% Rise can be split into 5 distinct Parts. We will cover each in detail:
- Uptrend 1
- Key Base
- Uptrend 2
- Choppy Base Stage 3 Action

We’ll analyze each of these moves and the setups within them.
Uptrend 1: 200% in 31 Weeks
Weekly Chart:

The first major move after the 2022 Bear Market. NVDA rose 50% after the bear market low in October, rallied into the declining 40 week MA before setting up a mini base. From there it reclaimed the 10week MA and 40 Week MA and started a New Momentum Zone, rising 200% in 30 weeks.
A New Momentum Zone is when a stock rises above a rising 10 week MA and flattening to rising 40 week MA for the first time after a Stage 4 Decline.
When a promising stock begins this zone, you can then look for entry setups and tactics.
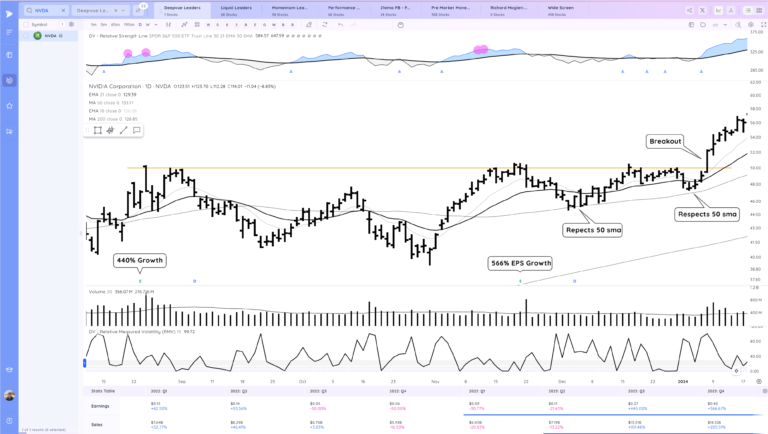
Looking at this first move I want to highlight how it occurred before the Earnings Growth started with NVDA. EPS and Sales Surprises started with the Feb 2023 report but the 440% growth number was from August 2023, actually right when it ended this first move and began setting up a base.
Technicals lead reported fundamentals. I do want to note, however, that AI news started in Nov of 2022 when they announced their H100 chips and some partnerships with Azure.
Here is the daily chart:

The ideal entry area during this first uptrend was Jan 6- Jan 20 of 2023.
NVDA had formed a tight range at the bottom of its base and rallied higher above the 21ema. It set up a great short tight range with RMV going to 0 right above the 21ema and then broke out around 16 (post split).
Then, it broke out of the mini base and set up a nice re-breakout entry point on Jan 20 around 17.30 (post split)
From there the next best entry I see is on the flag breakout Feb 1 after a retest of the big weekly level. It rallied higher before pulling back before earnings and gapped up.
I love the tight range it formed after earnings (see below)

From the earnings gap NVDA went tight, setting up around an 8% deep post gap range.
That Earnings Range undercut on Mar 13 with a good close was a tell/ very aggressive early entry. Then NVDA gapped, went tight for 2 days and set up a great range breakout Mar 16.
Great follow through from this buy point before again forming a right 6% deep flat base for about 5 weeks. There were potential entries in here but you may have gotten chopped up.

The move higher from this flat base started with a positive Expectation Breaker on April 26 after the very negative close on April 25. Then you had the breakout, flag back into the pivot and 21ema and then a follow on tight flag back into the 21ema area again.
After a nice move higher NVDA then gapped on earnings, setting up a few range breakouts before started to build the key base of the longer term move as the market began correcting.

Key Base
The phase of NVDA’s historic move is the key base that it formed from August 2023 to early 2024
Here is the base on a Daily Chart. Notice how NVDA’s Earnings and Sales were accelerating over the past few quarters and it was still beating expectations with each report.
The entire base was only about 21% deep, very constructive after the prior 200% rise off the bear market lows. Notice how NVDA starts respecting the 50sma before it breaks out, a key characteristic to look for when analyzing larger bases.

On a weekly chart you can see a textbook base with volume contracting along with VCP characteristics. NVDA also had a 3 weeks tight to end the base. Notice how while the base began as the market corrected, NVDA actually lagged the market for a while before breaking out in early 2024

Let’s zoom in on the breakout. The last pullback just below the 21ema was about 5% and you had nice tight action before popping back up above the 21ema before the true breakout. The breakout was strong and on a increase in volume, closing near highs.
After the breakout NVDA trended linearly, never wanting to close in the bottom half of the bar.

On a 65min timeframe I want to highlight how NVDA was showing RS versus the SPY by forming higher lows as the market kept pulling in. Then it set up an early pivot before the gap and go and strong breakout through the pivot and 500 pre split. Everything lined up for a strong breakout with good risk/reward.

Here is the breakout on a 5 minute chart in Deepvue. the 5 minute ORB lined up nicely with the pivot and you had only about a 1% risk to the low of the day.
A 30% position with a 1% stop would only be a 0.3% portfolio drawdown, so this was an A+ setup you could size.

From the breakout NVDA trended beautifully above the 10ema and 21ema until it started the next base, gaining 90% before the key reversal bar.

A key reversal bar is a sign of significant profit taking after a stock has been trending for quite some time. Pay attention when a stock is already mature in its move and the gaps up before reversing sharply down on an increase in volume.
A key reversal bar often signals the start of the end of the intermediate move, if not being the actual top of a new base.
MSTR is another good recent example, although it’s reversal bar was more severe and it featured more climatic type action.

Uptrend 2:
The second uptrend started up the right side of about a 21% deep short base. The tightening up the right side with ranges set up many entry tactics on pullback, anticipation, or range breakouts.
NVDA made about a 60% move before another key reversal bar which ended the trend.

Choppy Base & Stage 3 Action
After this rise NVDA did set back up in a base but changed character. The base was wider and looser and the price action slower.
For the first time we can start to see the 200 sma start catching up to price.
We can also see how after the base breakout NVDA stuttered and could not make progress. Then it featured another key reversal bar/ wide range bar and fell back below the 21ema

Looking at recent price action things have only gotten sloppier. Gap ups and downs with relative strength weakening. Many downside reversals suggesting distribution and finally now it has really broken below the 200 sma.
This is classic Stage 3 action and in danger of transitioning into Stage 4

Meanwhile, although earnings and sales are still growing, the growth is decelerating in recent quarters

Thoughts on the Future
NVDA and semiconductors as a whole are weak and laggards currently. Until there is a significant change in character, price tightens, it shows relative strength, it gaps up, regains moving averages etc… NVDA is best kept on a watchlist.
At some point it will begin a new uptrend but right now it is in a daily downtrend below a declining 21ema and in a Stage 3 Topping Phase
A break below 110 would stage a Stage 4 decline, at which point bulls would need to wait for a new momentum zone to form

NVDA has been a great stock! However all stocks have their day and we want to focus to the long side on new fresh leaders with high potential to double and triple in rapid time. NVDA may be a great liquid trender from now on, but may become more of a microsoft or amazon than a fast momentum mover.
Key Takeaways and Lessons from NVDA
NVDA is the perfect example of a company who saw rapid appreciation due to become right at the heart of a significant theme: AI.
AI and NVDA’s position as the chip leader, led it to grow tremendously fast in terms of earnings and sales. This growth led more and more institutions to fight for shares, creating powerful, linear moves, clean trends, constructive and relatively tight bases, and strong breakouts.
However, we have to be aware of price action as leaders change character and currently NVDA is trading wide and loose and in danger of starting a longer term downtrend.
The best lesson to take away from studying NVDA is to focus on the strongest liquid leader in the strongest theme of the market. These stocks can double and triple easily and will be relatively easy holds as they do so.
Also, keep an eye out for signs of a weakening trend such as key reversal bars, of which, NVDA had numerous.
Additional Homework
To keep studying – Take a look at NVDA’s prior model book move starting back in 2015. I’ve included the weekly chart and dailies below


Model Book Case Study Feedback
Please let me know your feedback and suggestions on what to add/change in the future.
Also drop below any stops/model book moves that you would like me to analyze.
PLTR in 2022/2025 was my plan for the next one.
I hope it was helpful!
Warm regards,
Richard