Mixed End to the Week

Richard Moglen
Stock Trader & Student of the Markets. I help traders improve their systems & performance at TraderLion & Deepvue
September 27, 2024


Market Action
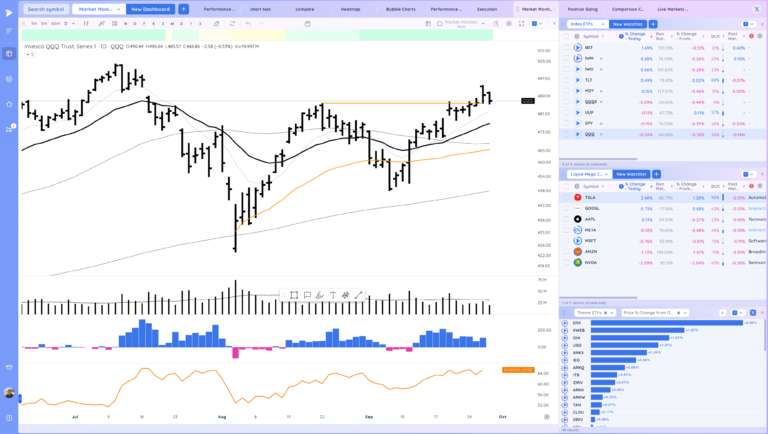
QQQ – slight gap up then close lower near the key pivot
Short Term Expectation based on the close is consolidation or down. See if we find supprt here
Bulls want to see strong continuation up
Bears want to see us break lower and undercut recent daily lows

IWM – was acting stronger, but weak close

Trends (4/4 Up)
Shortest – 10 Day EMA – Above Rising
Short-term – 21 ema – Above Rising
Intermediate term – 50 sma – Above Declining
Longterm – 200 sma – Up – Above Rising
Never miss a post from Richard Moglen!
Stay in the loop by subscribing.
Powered by the Leif Soreide Hight Tight Flag Masterclass
We are hosting a High Tight Flag Masterclass with Leif next month. Leif will be sharing his full process for Identifying, entering, and exiting these high potential setups, which can dramatically improve your performance.

You can register for the Interest list using the button below. Live spots are limited, and members of the list will get first priority, access to discounts, previews of content and more.
Groups/Sectors – % Change from Open

Performance Charts from Deepvue

Deepvue Leaders Heatmap

Key Stocks in Deepvue
NVDA some follow through down but found support at the 10 day

HOOD nice move from tight area. RMV for the win

COIN follow through up. up against 50 day

TEM back above the 21ema, see if it tightens next week

VST starting to flag, big volume

SG forming a base

LNTH inside day at the 21ema

OSCR sharp handle back into the 21ema

TOST gap up but negative close

YOU pulling into 10ema

GGAL 21ema pullback after breakout

MELI at 21ema, see if it can build here

CART pulling back to the base pivot

GLBE still stage 1

DOCS has that frozen rope feel and negative close today. See INTA

RDDT inside day looks constructive

ORCL still tight

PRCT tight at the 21ema

CEG focus for next week, tightening

SCCO inside day, same FCX

ONON mini base, inside day

PLTR tight against the 10ema

CAVA move lower from tight spot

Z orderly flag into the 10ema

UPST hesitation but still near the pivot

RH range

HIMS still great growth numbers, starting to move off the bottom

Market Thoughts
Not super enthused by all the charts i’ve gone through. ideally we see a pause and let charts tighten.
IDay by Day – Managing risk along the way
Recent Trade Lab Reports
-
-
-
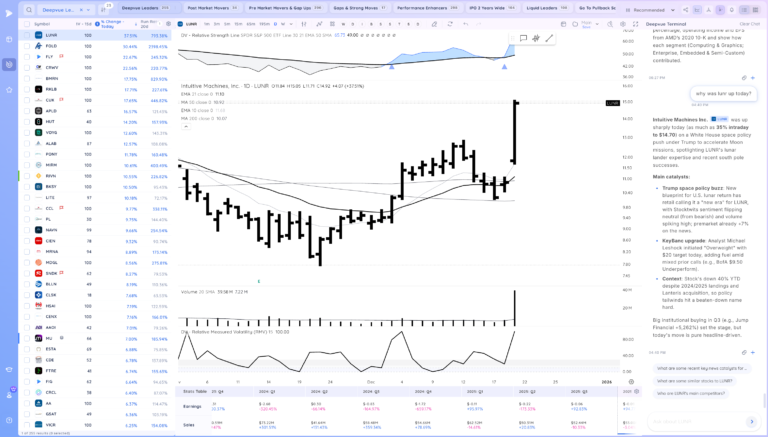
Reclaim of the Level to End the Week. Space Theme in Focus
December 19, 202514 min read -