Is the Market Bottom in? Stock Market Analysis

Richard Moglen
Stock Trader & Student of the Markets. I help traders improve their systems & performance at TraderLion & Deepvue
August 7, 2024


Market Action
QQQ – attempted to follow through up but not the best close. Yesterday’s low is the key low currently. See if we can build higher lows or more downside is in store.

IWM – similar type action after the failed breakout and following downside momentum

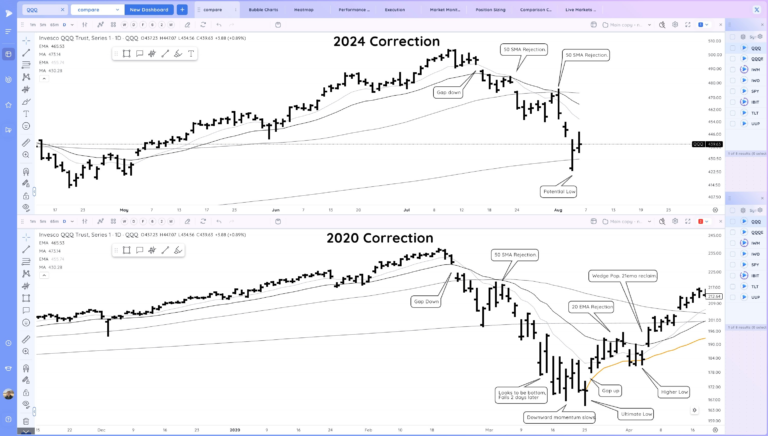
I’ve been taking a look at recent sharp corrections. Here is the 2024 Correction so far compared to the 2020 Correction. Patience (while still prepping for the uptrend) until test/reclaim moving averages from below + form a higher low. If active, tight leashes on trades
Never miss a post from Richard Moglen!
Stay in the loop by subscribing.
QQQ 2024 versus 2020 Case Study – All corrections exhibit similar type action.

Here is the current 2024 Correction versus the 2018 Correction. Notice in that one there were similar points where it looked to be over, only for the rally to fail at key MAs. We’ll see how this current one ultimately resolves. The low could be in, one day at a time.
QQQ 2024 versus 2018 Case Study – Patience is required during corrections, taking it day by until the market proves itself.

Also key is how potential leaders are acting. As the correction ends they will be all setting up and breaking out through pivots.
Look for group action, big gap ups, volume surges, Higher lows as the market makes lower ones, reclaims of moving averages
Avoiding the chop and frustration is key during corrections. Experienced traders can look to pick spots, daytrade or see if levels holds during the day to hold through the close but less is more until the wind is back at our back.
With all that said you should be getting excited. We’ve had some great opportunities in 2023 and 2024 and this correction is setting up another one. The longer this goes on and the deeper the correction, the greater the potential for another uptrend that could change your year and life. You just have to do your homework and be ready mentally when that happens.
Trends (1/4 Up)
Shortest – 10 Day EMA – Down – Below Declining
Short-term – 21 ema – Down – Below Declining
Intermediate term – 50 sma – Down – Below Declining
Longterm – 200 sma – Up – Above Rising
Groups/Sectors % Change from Open

Performance Charts from Deepvue

Key Stocks in Deepvue
NVDA below the 21ema. still looks like the left side of a base although that could have been the base lows yesterday

TSLA weaker with the gaps, key levels just above with the 200 sma and prior base pivot

PLTR strong action after earnings, gap up and near base highs

NOW decent action in comparison to the market.

TMDX holding up well

MELI strong RS

Other names on my current RS list: CRS EXAS IOT MELI NOW PLTR RKT TGTX TMDX ZETA ASTS. SMCI will be interesting to watch as a semi/ai to watch tomorrow to see how it acts with earnings
Market Thoughts
Is the low in? Maybe. Take it day by day and let setups and the action of the market force you to take pilot positions and test the waters. HIgher lows, moving averages reclaims.
This could be a V shaped rally, or we could need quite a bit more time. Do your homework and keep watching for setups and RS on a daily basis. You will notice when conditions are changing back to the positive
Recent Trade Lab Reports
-
-
-
Reclaim of the Level to End the Week. Space Theme in Focus
December 19, 202514 min read -