How to Identify and Trade Choppy Markets

Richard Moglen
Stock Trader & Student of the Markets. I help traders improve their systems & performance at TraderLion & Deepvue
February 22, 2025
[kt_reading_time]


How to Trade Choppy Markets
Choppy markets are one of the most dangerous environments for traders. They often lead to larger drawdowns and frustration compared to clear downtrends, which can be easier to manage and avoid
Choppy markets often occur after a strong period in the market, where the index may be basing or even still marking progress, but under the hood stocks are not following through or are even being distributed by institutions.
In this Trade Lab Educations article we will discuss 4 key ways to identify choppy markets in real time and 4 adjustments to make during these periods.
What we are really talking about here is identifying signs of subtle distribution and much of what we will discuss is helpful for managing individual stocks as well and knowing when to sell.
Large Gaps and Reversals – Wider Ranges
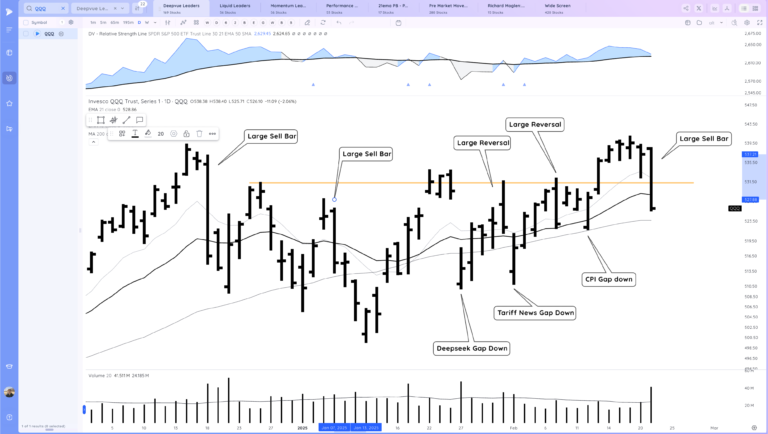
The first sign to look out for is a change in character in the market indexes – I use the QQQ primarily as it is a good representation of more tech focused stocks.
What you are looking out for is
- Large Sell Bars
- Large Reversals
- Gap Downs
- Wider Ranges
- Lack of follow through

These characteristics are relatively easy to spot in real time and when they start showing up in clusters, its a clear sign that the environment may be changing.
Large Sell Bars
This is pretty self-explanatory but what you want to look out for is a significant bar down on increased volume that likely closes near lows. This can occur when a market has already been trending for quite some time or at key levels such as base pivots.
These sell bars will stand out on a chart and often will be more than 1-2% down with a poor closing range
In a strong market weakness is bought up – when that does not happen it’s worth keying in on and being on guard and looking to gather more evidence that the environment may be shifting.
Large Reversals
This goes hand in hand with large sell bars. Large reversals down shows that after a short move up, institutions are using this momentum to distribute stock. This often occurs near key pivot levels such as the highs of bases or from tight ranges.
These can often occur after a gap up in the market, be on guard for a reversal down when these occur and the market is choppy.
Gap Downs
Choppy markets in general will feature more gaps both to the upside and downside. Gap downs in particular are dangerous as it makes managing risk with tight stops difficult. These gaps may also reveal the key fundamental catalysts behind a change in market conditions.
Whether inflation, war, policy changes, tariffs, liquidity, unemployment or another catalyst is the key driver, track what is being considered relevant and look to identify when it is considered resolved – this can signal the start of the end of the chop.
Wider Ranges
In general during choppy and also corrective markets daily ranges will be higher. This is due to a decline in liquidity during these periods.
You can use a simple plot of ATR to look for trends in the ranges.

Lack of Follow Through
This is a more subtle sign of a choppy market. Lack of follow through means that upside momentum disappears more quickly and trends last days more often than weeks. Progress made the first 4 days of the week can disappear quickly with one bad bar. Breakouts quickly reverse and fall back below pivots.
The Leadership Tell
In addition to watching the indexes, you want to always keep a close eye on what the top ~15 or so growth stocks in the market are doing as well as the large liquid mega caps. This is why I have a section in the report dedicated to their performance day to day.
This list of leaders should include the high relative strength, liquid names that are part of the driving themes in the market. For the last 2 years or so this has meant AI/semiconductor related names.
These leaders will often break down or start chopping before the indexes as well as firm up and break out before the market turns. A quick check up on them can provide a lot of useful information. Are they above or below moving averages. Are Gap ups following through? Are they breaking below recent ranges.
These price and volume signatures gives us insight about the risk appetite of institutions.
For choppy markets, you want to look out for leaders breaking down or suddenly changing character. This includes large gaps below moving averages, a change in momentum, large reversals, not respecting moving averages they had previously.
For instance NVDA, the key leader of the AI/Semi theme, over the past few months has shown more signs of Stage 3 – reversals, breakouts not follow through, gap downs.
When key leadership changes character the market will likely shortly follow.

On a shorter term basis both RDDT and PLTR stood out to me over the past few weeks.
RDDT broke below the 21 ema significantly for the first time in months and also did not hold the base pivot or 50 sma

PLTR which was maybe the strongest leader featured a large reversal down breaking many lows.

These leaders may ultimately be fine, reset, and continue trending, but you want to be closely in tune with how the strongest stocks in the market are acting. When they start weakening, it can be a clear tell that the market is changing.
The Earnings Gap Tell
Earnings Gaps are another great way to assess the current market environment. I first learned this from Jim Roppel. When there are many gaps up and they are following through and trending, likely we are starting a strong trend. However when there are more gap downs than gap ups, or gap ups sell off or make little progress more often than not, that could be a sign that institutions are using earnings moves for liquidity to lower position sizes.
Roku is a recent gap that has sold off since the gap up

MNDY was a strong HVE gap up, in a strong market this would have taken off. Instead it has stuttered and failed to U-Turn after the post gap range

The Trade Feedback Tell
This is likely the most important tell that the market is becoming choppy or simply not working right for your style.
What you should do is track the success rate of your last 5-10 trades. This can be simply based on wether they were profitable or not, but more advanced traders can use slightly more subjective measures like if those trades followed through, what was the average risk multiple etc…
The key point here is that you should listen carefully to the trade feedback you are receiving. In a strong market 6-8 out of your last trades may work well. In a choppy market that number will drop to maybe 2-4 trades.
When this happens you want to take appropriate action as we will discuss in the next section so that you don’t chop yourself up and give back too much of your hard won profits from the previous uptrend.
You also want to consider your overall watchlist and how it is performing. Your watchlist should be composed of the best setups in the market. If, like your trading, those setups at large are not acting right, that is additional feedback that you may need to adjust your expectations and trading.
For instance DKNG was one of the most promising recent setups. Instead of following through it broke lower

In short, track your recent trades and have a measure of your batting average and watchlist success rate that you know is typical during an uptrend, downtrend, and chop.
One other thing to consider is your overall drawdown off highs. Choppy markets are nefarious because they are not as simple to detect as corrections. They suck you in and try to bleed you to death with paper cuts. Track how far off highs you are and consider implementing more aggressively the rules below when you fall 7.5-10% off highs
Adjustments for Choppy Markets
Once you are starting to notice that the market environment is changing, there are 4 key things that you should adjust to protect yourself.
- Position Sizing Through Progressive Exposure
- Selectivity of Trades
- Focusing on Pullbacks
- Tightening Up Risk and Sell Rules
Position Sizing and Progressive Exposure
This ties in closely with tracking your recent X number of trades.
I typically like to start with 15-20% position in a strong markets. When I notice that my recent trades are showing a significant change in my batting average. I start adjusting lower shifting gears lower to 10-12.5%. If things still aren’t working well I may go down to 7.5% to 10%.
What is very important however with progressive exposure that once you start seeing your batting average improve you quickly want to size back up if all other factors such as market leadership looks to be shaping up.
I think people try to complicate progressive exposure and are looking for explicit mathematical equations for how much to size down or up. This is a part of trading that is impacted a lot by feel and experience. You’ll have to decide for yourself how aggressive you want to be sizing up and down and by how much, but I think the numbers I shared above are a good starting point.
Trade Selectivity
In addition to sizing down, when you notice your trading is not performing as well, you want to become more selective with the setups you choose. There is a common trading saying along the lines that if you can’t make money in the leaders, you can’t make money trading anything.
When things start getting choppier, focus on more liquid, higher quality names. Those are less likely to have very large down days that can occur in more high flying speculative stocks.
Also be stricter on your requirements for the setup. In choppy markets things will be wider and looser, pivots not as clear. Don’t succumb to opening up your parameters and what it takes to qualify for a setup. You want to be stricter in your selection in weaker markets.
Every trade must fight to earn your money and be worth the risk.
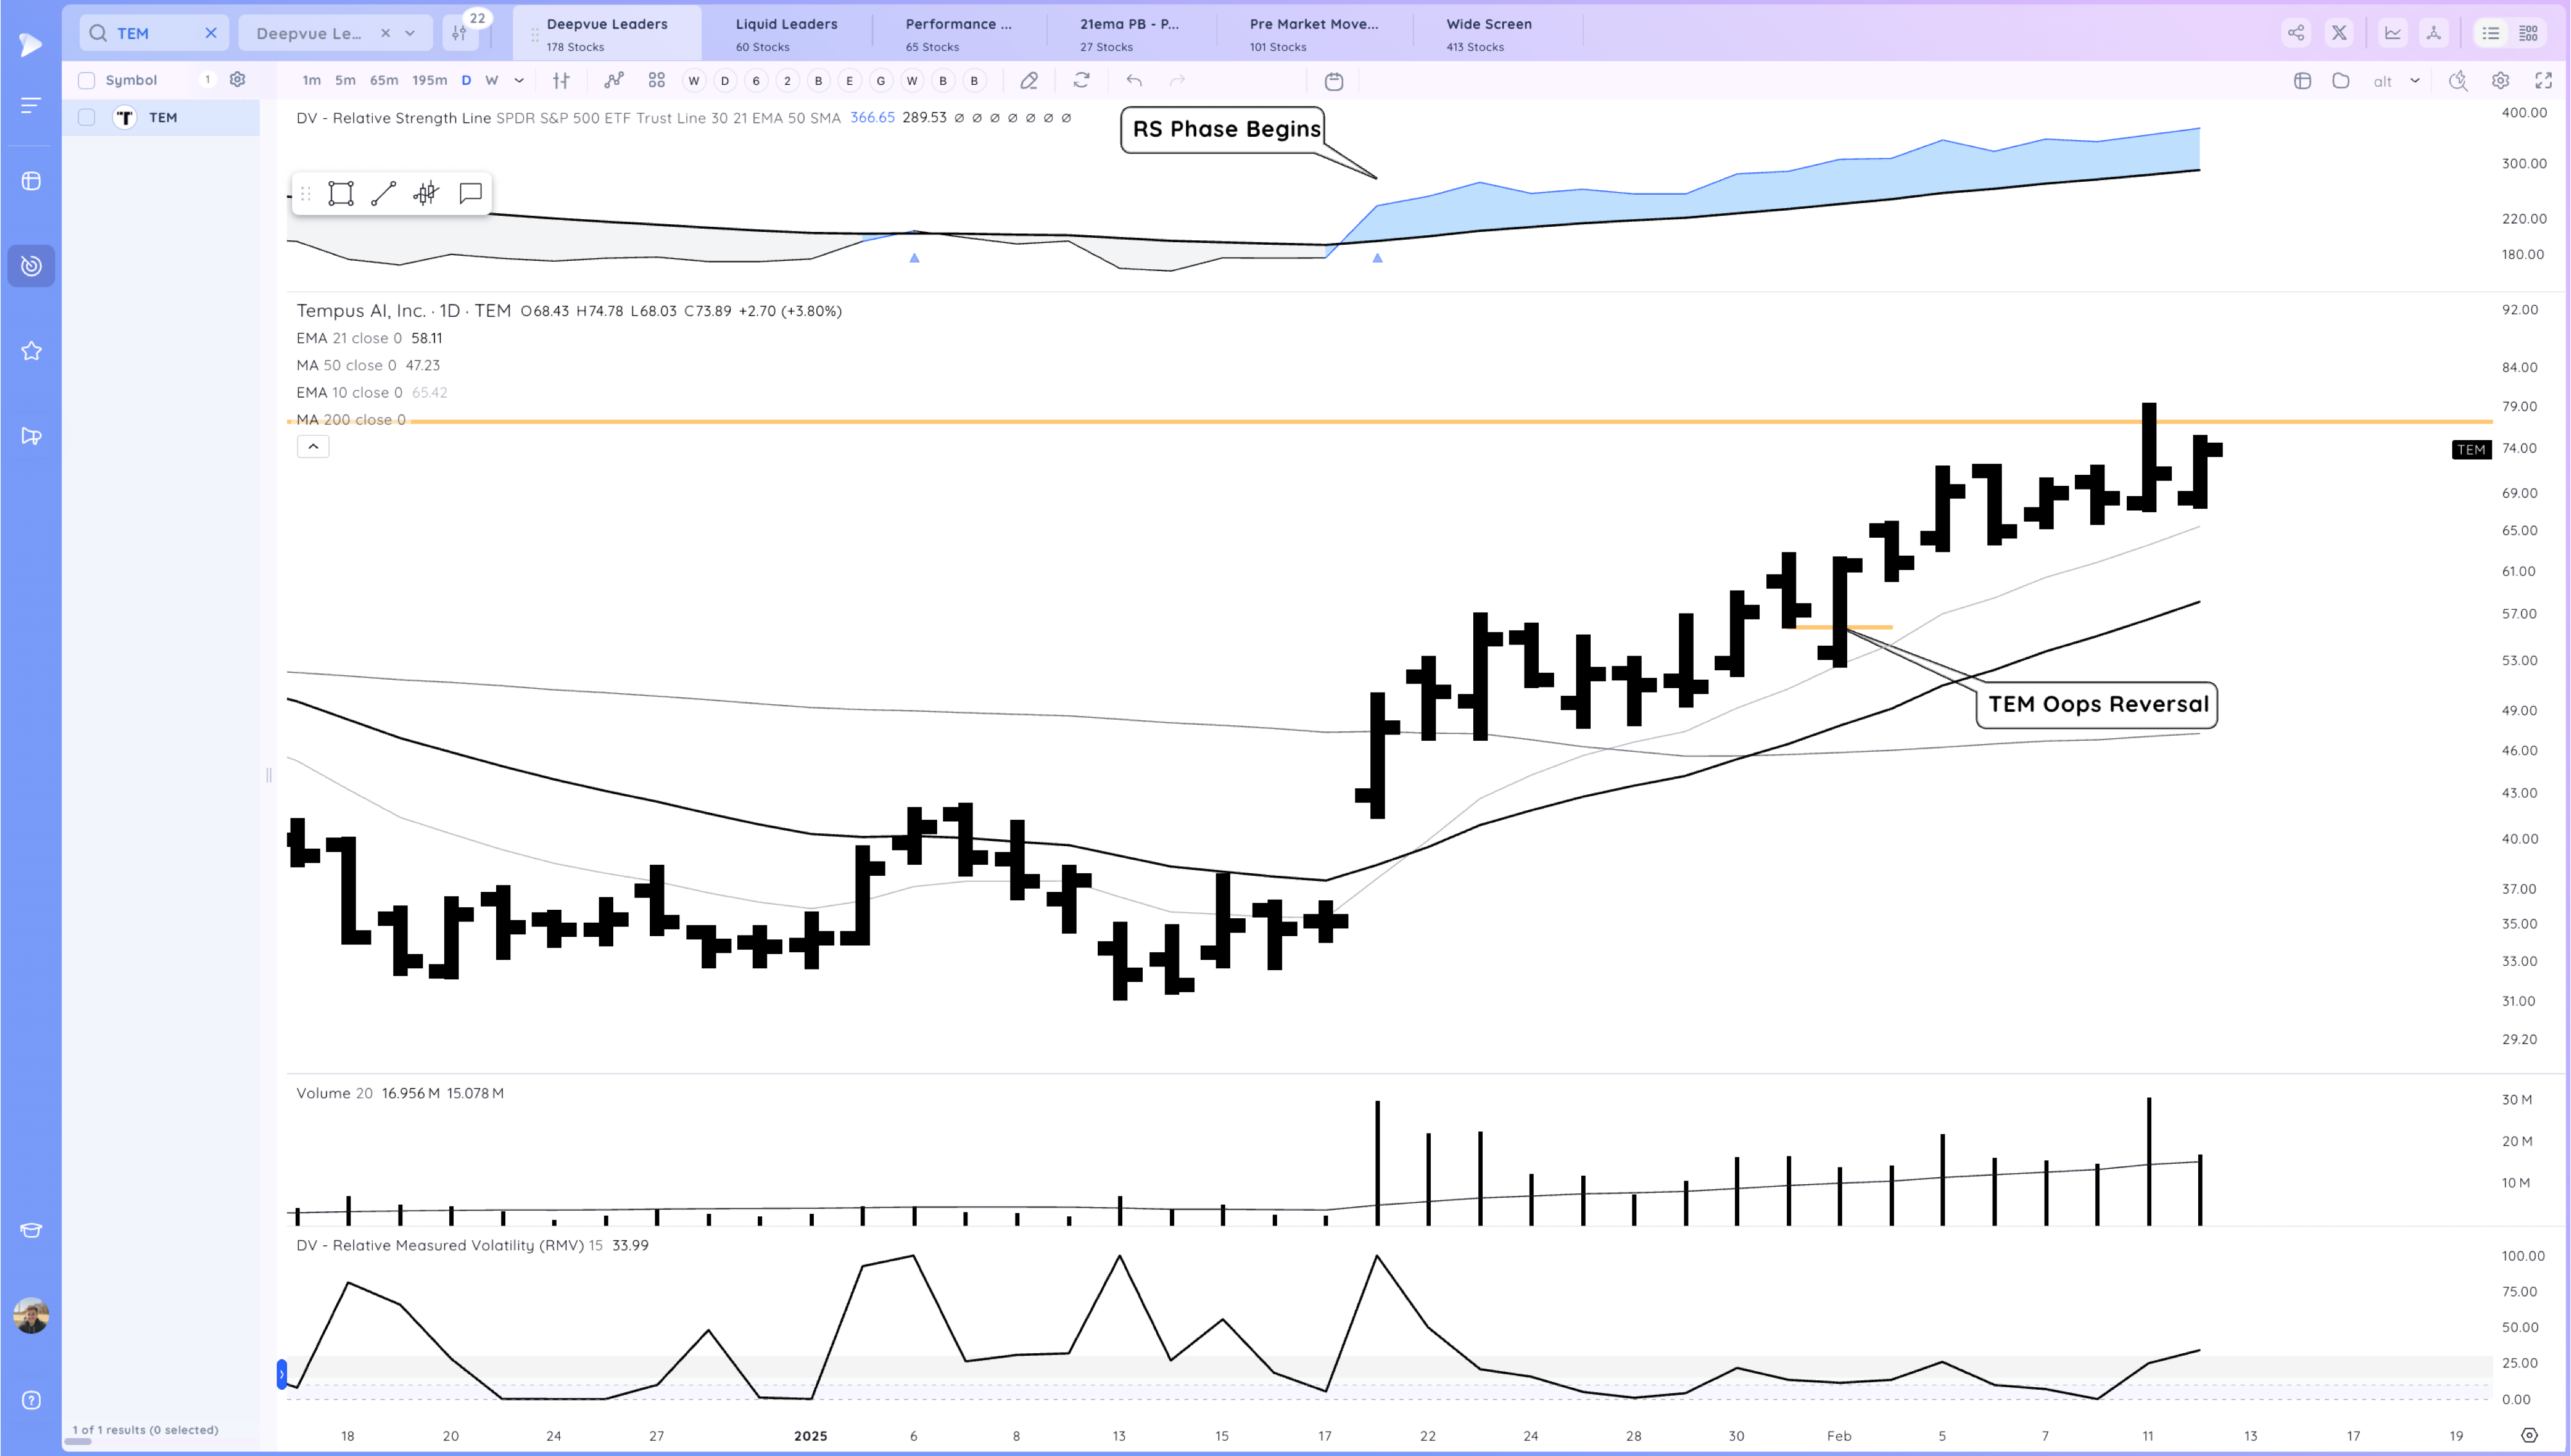
Focusing on Pullbacks
This goes hand in hand with selectivity. I’ve found greater success in focusing more on pullback type setups such as oops reversals or MA pullbacks during choppier periods. Buying on strength when there is little follow through is asking for a reversal to happen and with a pullback setup you can know more quickly if you were right or wrong.
Tightening up Risk and Sell Rules
Finally during choppier markets, in addition to lowering position sizing I will also focus on trades/entries where I can place my stop tighter and often be quicker to sell.
Oops Reversals again are great for this as you can often manage risk under 2%.
I’ll also be stricter in deciding if I’m going to hold a trade overnight. In a good trending market if a stock didn’t make much progress from an entry but still looks setup, I’ll try to give it the benefit of the doubt, hold it, and see if it can work the next day.
In choppy/corrective markets it’s the opposite, I need a clear cushion to consider holding a stock overnight. Stocks in choppy markets are guilty until proven innocent. You can always try again the next day if it is still acting well.
On the taking profit side as well in choppy markets I sell sooner. This is something I learned the hard way in 2021. Typically I look to hold my full position until 2 closes below the 21ema.
In choppy markets I am more likely to take 25% off at 1R, move my stop to breakeven, and then also be more aggressive in selling the rest on weakness or into strength
Key Points
- Choppy Markets are the most dangerous for traders, they erode your account and your confidence
- Watch for Reversals, Wide Ranges, Lack of follow through, and other signs of subtle distribution
- Adjust your trading and tighten things up during choppy markets. Trade Smaller, Trade Less, Manage Risk More Closely
Comment Below
What was your key takeaway from this article? What would you add? What trading topics would you like me to write about in the future?
Comment below your throughts!
Homework Assignment
2021 is the market this most reminds me of currently. I’d recommended watching my interview with Mark Minervini who won the US Investing Championship that year. He was still aggressive this year but sold more quickly into strength.