Follow Through Lower. TSLA Showing RS

Richard Moglen
Stock Trader & Student of the Markets. I help traders improve their systems & performance at TraderLion & Deepvue
July 18, 2024


Market Action
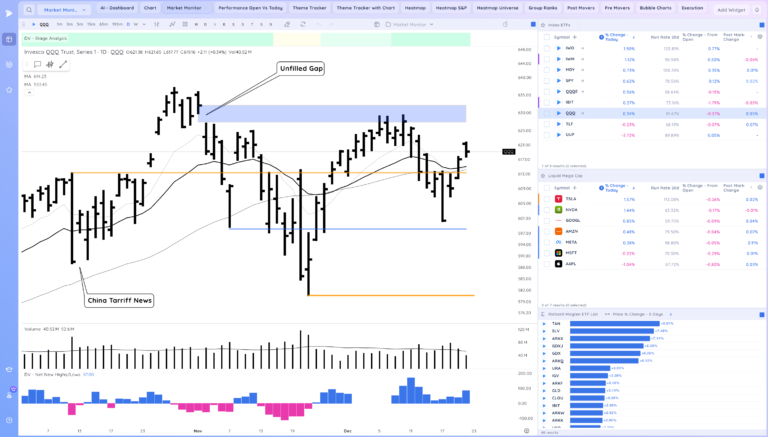
QQQ – Gap up but a close closer to the lows today. Feels like a meeting with the 50sma is in store either through price or time

IWM – reversal down, looks like a 10ema retest in store

Trends (2/4 Up)
Shortest – 10 Day EMA – Down – Below Declining
Short-term – 21 ema – Down – Below Declining
Intermediate term – 50 sma – Up – Above Rising
Longterm – 200 sma – Up – Above Rising
Never miss a post from Richard Moglen!
Stay in the loop by subscribing.
Groups/Sectors % Change from Open

Performance Charts from Deepvue

Most stocks and themes down from the open. Looks for standouts that are holding ranges, levels, KMAs as the market falls below those same relative spots. Sorting by daily closing range is a great way to do this
Key Stocks in Deepvue
NVDA looks to start forming a range just over the 50. Bear flag or support?

TMDX pulling back towards the 50, hold or fail?

LNTH watch how it builds a flag structure here

RDDT pulling back to the base pivot

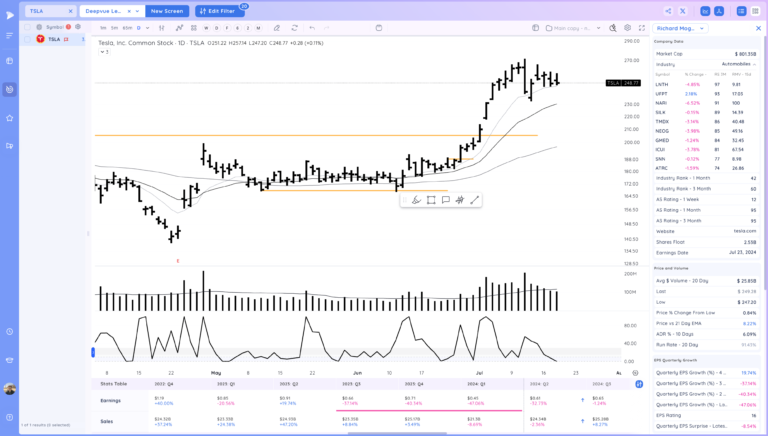
TSLA holding the 10ema and now double inside.

Market Thoughts
Mostly follow through down today. Less is more until stocks really start to show a big. This pullback is taking care of the overbought conditions. We will see how long it lasts.
Day by Day, monitor positions and for RS.
Recent Trade Lab Reports
-
-
-
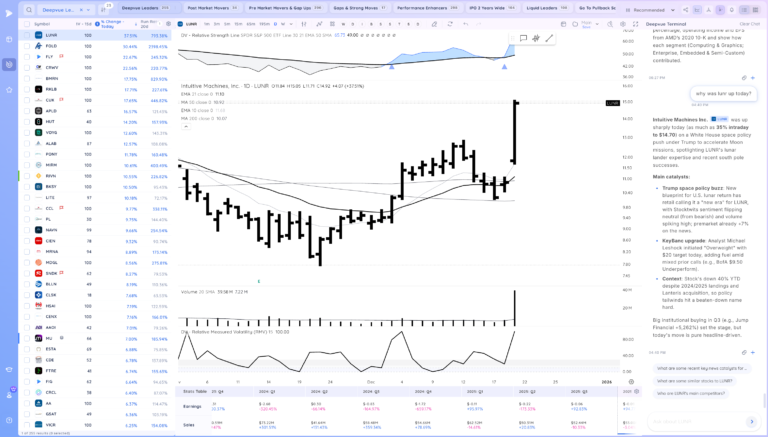
Reclaim of the Level to End the Week. Space Theme in Focus
December 19, 202514 min read -