Downside Reversals Ahead of the Fed – Semis take a hit

Richard Moglen
Stock Trader & Student of the Markets. I help traders improve their systems & performance at TraderLion & Deepvue
August 22, 2024


Market Action
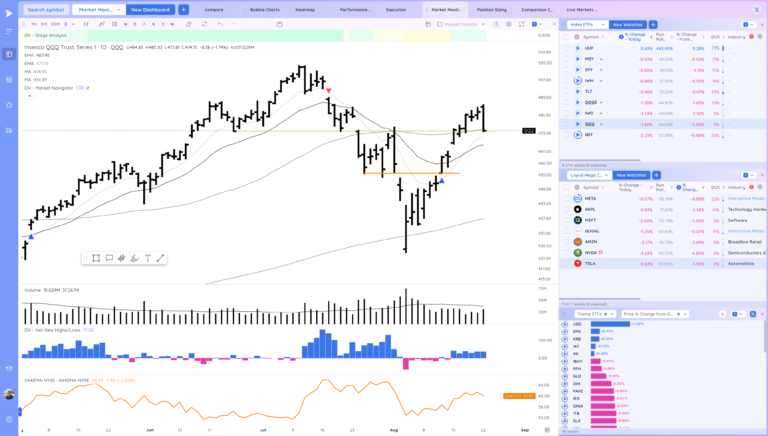
QQQ – Big downside reversal bar back into a potential area of support. News event tomorrow so anything can happen.
Individual stocks holding up alright given this action
We just added a market navigator indicator to Deepvue that allows you to plot buy and sell signals such as a cross above the 21ema. Notice the blue and red indicators below that help me define my market cycle.
Uptrend, close above the 21ema
Downtrend, Close below the 21ema

IWM – downside reversal but holding lows for now

Market Corrections Case Studies
Most of you have probably already read through these but I will include them daily until we resolve the correction
…
Here are the two case studies of 2018 and 2020 that provide examples of what you can expect form a correction just in case you haven’t seen them yet.
I’ve been taking a look at recent sharp corrections. Here is the 2024 Correction so far compared to the 2020 Correction. Patience (while still prepping for the uptrend) until test/reclaim moving averages from below + form a higher low. If active, tight leashes on trades
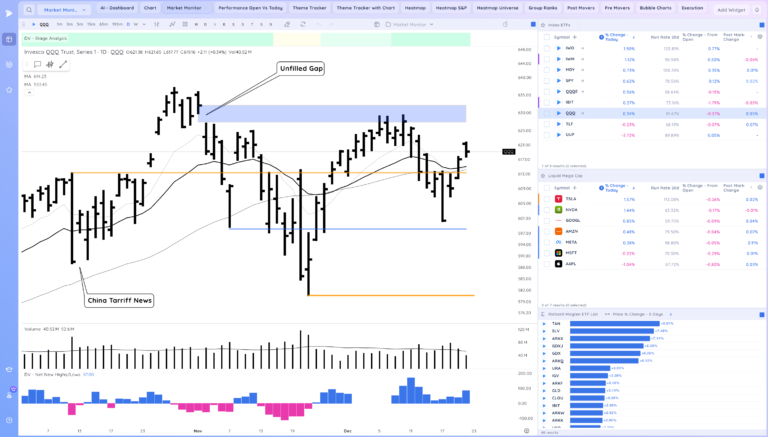
QQQ 2024 versus 2020 Case Study – All corrections exhibit similar type action.

Here is the current 2024 Correction versus the 2018 Correction. Notice in that one there were similar points where it looked to be over, only for the rally to fail at key MAs. We’ll see how this current one ultimately resolves. The low could be in, one day at a time.
QQQ 2024 versus 2018 Case Study – Patience is required during corrections, taking it day by until the market proves itself.

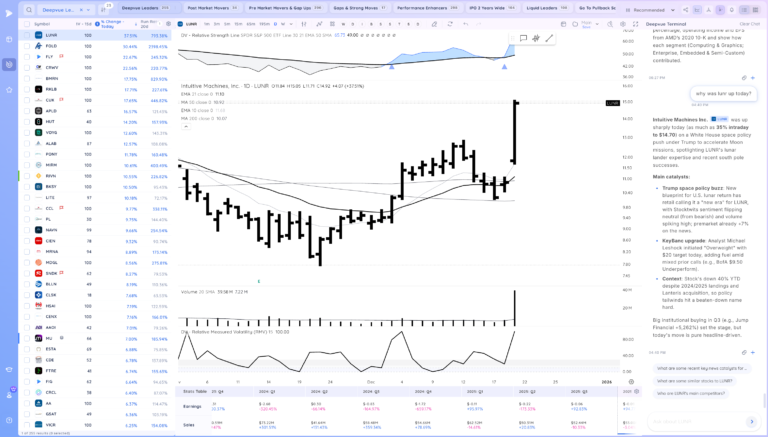
Also key is how potential leaders are acting. As the correction ends they will be all setting up and breaking out through pivots.
Look for group action, big gap ups, volume surges, Higher lows as the market makes lower ones, reclaims of moving averages
Avoiding the chop and frustration is key during corrections. Experienced traders can look to pick spots, daytrade or see if levels holds during the day to hold through the close but less is more until the wind is back at our back.
With all that said you should be getting excited. We’ve had some great opportunities in 2023 and 2024 and this correction is setting up another one. The longer this goes on and the deeper the correction, the greater the potential for another uptrend that could change your year and life. You just have to do your homework and be ready mentally when that happens.
Trends (#/4 Up)
Shortest – 10 Day EMA – Up – Above Rising
Short-term – 21 ema – Up – Above Rising
Intermediate term – 50 sma – Just below
Longterm – 200 sma – Up – Above Rising
Groups/Sectors – % Change from Open

Performance Charts from Deepvue

Key Stocks in Deepvue
NVDA downside reversal after the gap up. Many semis similar action

PRCT See if it can setup a flag now

EVH strong breakout. Use RMV to find these tight areas

PLTR downside reversal and back in the range. See if it follows through down or snaps back

DECK forming a tight range

SG tried to follow through but faded

DOCS holding up well, bit of a downside reversal

FOUR flagging

KVYO still tightening on declining volume

UBER tight at a key level

INSP tight near the high since gap down

AXON still tight

IBIT Gap down but tight day. See if it can build

CAVA gap up post market after earnings beat.

Market Thoughts
Semis took a hit today but most names help up pretty well. Still seem to just be forming ranges, We’ll see what happens tomorrow. Have a plan for whatever. Risk can come fast.
Day by Day – Managing risk along the way
Recent Trade Lab Reports
-
-
-
Reclaim of the Level to End the Week. Space Theme in Focus
December 19, 202514 min read -