Bitcoin Breakout – The Nasdaq approaches New Highs

Richard Moglen
Stock Trader & Student of the Markets. I help traders improve their systems & performance at TraderLion & Deepvue
October 14, 2024


Market Action
QQQ – Slight push from the tight area
Short Term Expectation based on the close is consolidation or lower
Bulls want to continued trend higher
Bears want to see us reverse sharply downward

IWM – bit more follow through

Trends (4/4 Up)
Shortest – 10 Day EMA – Above Rising
Short-term – 21 ema – Above Rising
Intermediate term – 50 sma – Above Flat
Longterm – 200 sma – Up – Above Rising
Never miss a post from Richard Moglen!
Stay in the loop by subscribing.
Powered by the Leif Soreide Hight Tight Flag Masterclass
We are hosting a High Tight Flag Masterclass with Leif next month. Leif will be sharing his full process for Identifying, entering, and exiting these high potential setups, which can dramatically improve your performance.

You can register using the button below. Live spots are limited!
Groups/Sectors – % Change
From yesterday’s close on the left, from today’s open on the right

Performance Charts from Deepvue

Deepvue Leaders Heatmap

Heatmap from Deepvue
Group Ranks: 1 Day, 1 Week, 1 Month, 3 Month

Key Stocks in Deepvue
NVDA slight push higher but bit of a fade.

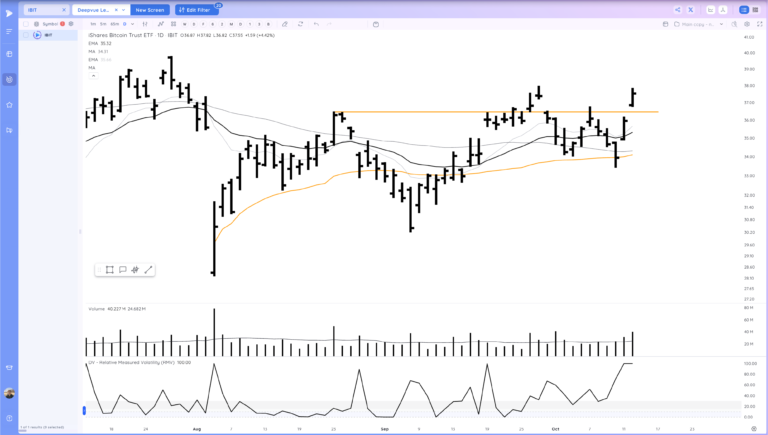
IBIT continuation up from positive expectation breaker friday

UPST follow through higher. RMV spotted low risk entry points

COIN push higher from the range.

HIMS gap up after upside reversal at level

VST follow through up

EAT reconfirmation up from another tight area

TEM back to the MAs, would like a tight day here. Watching for strong push up through

SG inside day

GDS push higher, strong trender

HOOD continue to trend

ACMR tight range, Semi group but laggard, can really push when it trends.

CART flagging into the 10ema

CPNG tight. China related so added gap risk

SCCO big upside reversal. watching for follow

BABA also tight. China names likely move soon

CCL poking its head above a big weekly level

CORT fade today back into the range

ONON upside reversal near the 21ema, watch for follow through up. Recent gap down suggest a bit of weakness

DUOL upside reversal within this shelf, watching for follow through

ALAB logical spot for some pause

CORZ typical action post breakout, want to see it reconfirm higher

RKLB tight range day near this current box highs

CLOV upside reversal action above the recent base level

ASTS still low in the base, needs to show itself

META fade from highs, watching to see if it holds

AAPL small breakout

TSLA starting to form a range

Market Thoughts
Many names trending well, watching for continuation higher
Day by Day – Managing risk along the wa
Recent Trade Lab Reports
-
-
-
Reclaim of the Level to End the Week. Space Theme in Focus
December 19, 202514 min read -