ASTS Case Study – High Tight Flag – 1100% in 3 months

Richard Moglen
Stock Trader & Student of the Markets. I help traders improve their systems & performance at TraderLion & Deepvue
September 28, 2024


ASTS’s Incredible 1000% Move
What does it take to identify and trade a stock that can move 100%, 200% or in this case over 1000% in just a few weeks?
That is exactly the question we will explore today using AST SpaceMobile Inc (ASTS) as a case study.

Remember the goal is not to suggest that you can catch the bottom tick and sell at the top, but to create a systematic process that identifies stocks with high potential and looks to execute at low risk entry points to catch the meat of a trend. This is an academic exercise to develop your skills and sharpen your trading system
Dr. Eric Wish, who first taught me how to trade at the University of Maryland, has a trading mantra:
“In an uptrending market, buy visionary rocket stocks that are bouncing off of support or that are oversold or that are breaking through resistance on above average volume”
the ASTS,, aside from literally being a “rocket stock” haha, exemplifies this statement perfectly. It offered many buy points along the way after already rocketing higher. In this article we will analyze the move and what caused it, and numerous setups you could use to profit from the move
Case Study Video
In this video I cover everything in the article
What is ASTS?
AST SpaceMobile are a company that is developing satellites to provide connectivity to cell phones. They have partnerships with many carriers including Verizon, AT&T, and Vodafone
They are not yet profitable, this is a story stock, but are slotted for strong revenue growth the next few quarters
From their website:
AST SpaceMobile is building the first and only global cellular broadband network in space to operate directly with standard, unmodified mobile devices based on our extensive IP and patent portfolio, and designed for both commercial and government applications. Our engineers and space scientists are on a mission to eliminate the connectivity gaps faced by today’s five billion mobile subscribers and finally bring broadband to the billions who remain unconnected. For more information, follow AST SpaceMobile on YouTube , X (Formerly Twitter) , LinkedIn and Facebook . Watch this video for an overview of the SpaceMobile mission.
The Move
Below is a clean daily chart of ASTS with the 10ema, 21ema, 50 sma, 200 sma, Volume, and Relative Measured Volatility (RMV)
On May 16, ASTS broke out at $3.07. From that day’s low it advanced 1,164% over the next 65 days to a current max peak of $38.99 on August 20th

News Catalysts

The Setups – Episodic Pivot, EP Range Breakout, High Tight Flag
A 1000% move is great and all, but how can you actually catch it?
Well you need a 4 step process and a system to repeat it.
- Discover the Stock – get the high potential stock on your radar through screens or processes
- Entry Setup – Examine the larger context and define the repeatable pattern
- Execute and Manage Risk – Enter the stock which ensuring if it fails, you exit with a small loss
- Position Management and Sell Rules – Manage the trade to achieve your style’s goals
First Setup – Episodic Pivot

Discover
To identify EPs you need to regularly track stock’s reactions to earnings reports and key news, after hours and in pre market. You are looking for stocks with large gap ups on very high volume compared to normal on a catalyst that has large potential to completely change the story of a stock.
ASTS appeared on our Deepvue Pre Market Movers Preset May 16.
Going through the results of that screen, you would see ASTS had reported the night before with significant announcements, notably the partnership with AT&T: https://finance.yahoo.com/news/ast-spacemobile-provides-business-first-203000229.html
Entry Setup
For EPs, discovering and identifying the setup happen either the same day or the morning after the prior day’s news event. You are looking to enter either on Day 1 of the EP, Day 2 on follow through, or after a tight range forms.
I would recommend watching Pradeep Bonde’s presentation on EPs
Execute and Manage Risk
Large gaps can be tricky to position on. With an EP you want immediate feedback that large players are positioning in the name, leading either to the stock immediately taking off or basing for a few minutes before taking off and trending.
On a succesful EP the stock will trend higher through the rest of the day, basing and re-breaking out and ideally closing near highs.
With ASTS you had a few spots:
- Shortly After Open, Risk at LOD 2-3% Stop – Profit Cushion at EOD around 27%
- Outside bar after tight range, Risk at LOD 5-6% or Range Lows 4-5% – Profit Cushion at EOD around 24%
- Intraday Base Breakout 1, Risk at AVWAP/Low of Structure 4-5% – Profit Cushion at EOD around 15%
- Intraday Base Breakout 2, Risk at Higher Low of Structure 3-4% – Profit Cushion at EOD around 6%
5 Minute Chart Highlighting potential Entry Areas

Position Management
With each of the different entry points you get different profit cushions at the end of the day, all more than one R. With this cushion you would look to hold and sell into strength to suit your style.
For swing traders you would look to sell pieces progressively as the stock moves higher, and meets profit targets or R multiple targets. Trimming and trailing your stop
2nd Setup – EP Range Breakout
Discover
For EP range Breakouts, you want to track EPs and monitor them for tight ranges that form afterwards. Often EPs and Earnings Gaps will pull back slightly, then U turn and resume an upward trend
Entry Setup
The setup occurs when an EP forms a tight range or consolidation and the overall chart still represents high potential.
In the case of ASTS, it formed a tight RMV area against the AVWAP from the EP day. I’ve blocked the right side of the chart to show what it looked like

Execute and Manage Risk
When a stock forms a range, there are 4 main ways to trade it.
- Accumulate versus range lows
- Buy Tightness (Anticipation)
- Undercut and Rally of the Range
- Breakout from the range

In the case of ASTS you had an undercut and rally and range breakout
The undercut and rally of the range low would have been a stop at the low of the day (3-4%) – Profit cushion EOD = ~14%
The AVWAP reclaim shorly after, stop at the low of the bar where it reclaimed (2-3% Risk) – Profit Cushion EOD = ~12%
The Range Breakout stop low of the higher low tight area (2-3% risk) – Profit Cushion EOD = ~3%

Position Management
The next day the stock pulled it shortly in the morning before following through nicely, allowing you to adjust stops up to cost or at that next day’s low.
Then the day after on May 29 you get the gift of the verizon news catalyst allowing you to either being in a great position to hold for a momentum trend if you are a position trader, or sell progressively into strength if you are a swing trader.
3rd Setup – The High Tight Flag
Discover
To find high tight flags you want to monitor for very high RS stocks over the past 1 month up to 3months. basically tracking for stocks forming their poles. Then you want to build a watchlist of potential candidates and regularly monitor them to see if they build flags.
You can also use Leif Soreide’s Hight Tight Flag Preset screen in Deepvue. He is a specialist for high tight flags and has traded ASTS specifically very well.
We are hosting a High Tight Flag Masterclass with Leif next month. Leif will be sharing his full process for Identifying, entering, and exiting these high potential setups, which can dramatically improve your performance.
You can register for the Interest list using the button below. Live spots are limited, and members of the list will get first priority, access to discounts, previews of content and more.
Entry Setup
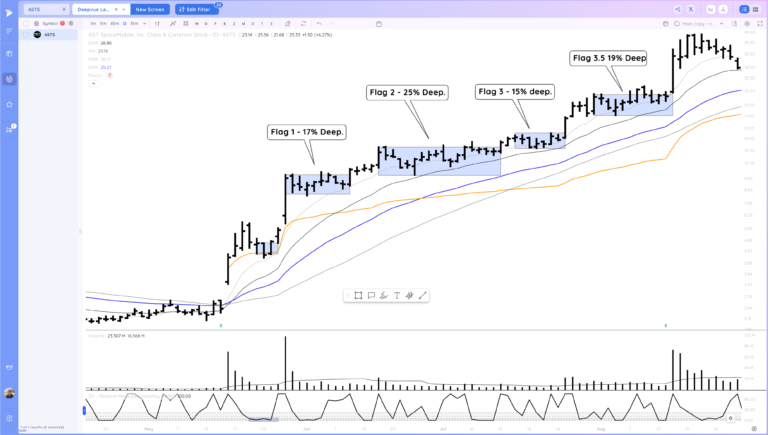
The High tight flag setup is looking for a tight range to trade against within a flag of a high tight flag. The strongest high tight flags will breakout, form another flag then re-breakout. ASTS during it’s move formed 3- 3.5 flags

Execute and Manage Risk
Flag 1, Buy point through the high and break of short DTL. Stop low of the breakout day ~4%. Cushion EOD = ~13%
Daily Chart on left, 65min on the right

Flag 2, buy point through highs of tight range. Stop LOD ~4-5%. Pofit cushion EOD = ~6%
Daily Chart on left, 65min on the right. You may get raised stops hit on this a few days later

Flag 3 has 2 potential buy points through short DTLs
Buy 1 through range high, Stop low of the range ~2.5%, Cushion EOD= ~7%
Buy though inside day high. Stop LOD Risk 2% cushion EOD= ~18%

Position Management
For the high tight flag entries, you can look to sell some into strength at multiples or trim and trail using the 10ema, 21ema.
Contractions and Expansions with Relative Measured Volatility
You may have noticed that with all of these setups, the ideal entry point is from a tight area. This is where RMV can help
RMV is an objective way to measure volatility. It oscillates up towards 100 on price expansions and down below 15 and close to 0 during tight ranges/VCPs. To calculate the current RMV, it uses a lookback period to determine what normal price volatility looks like and then compares the recent price action to that on a percentile scale.
It’s an element of market structure that stocks oscillate between periods of expansions and contractions. When RMV gets very low, it signals a period of contraction and when you want to be looking at the stock for a potential burst in volatility that we can profit from while managing risk low because of tight and logical stop loss under the low of the range.
A lookback period of 15 days is standard, but a lookback period of 5 days is suggested for very high momentum names, during IPO bases, and shortly after large expansions in volatility like earnings gaps.
A stock like ASTS certainly fits the bill for a “high momentum name” and we will use RMV 5 for our analysis. Below you can see both RMV 15 and RMV 5 plotted. RMV 5 is more sensitive with more RMV tight “signals”

Here I’ve plotted a dot below anytime RMV 5 is less than 8. suggesting a very tight area. Notice how these signals often appear the day before or shortly before a large price expansion up or down. In Deepvue you can screen for these to look for stocks shortly ready to break out.

Current Price Action
ASTS is currently forming a base and is coiling below the moving averages
This Friday it put in an upside reversal and potential undercut & Rally of the 50 day and prior key swing low.

From this point constructive action would look like a breakout above the moving averages and further tightening and reconfirmations.
However, if ASTS continues low and breaks the base lows, that would suggest it needs more time to consolidate
This type of stock is highly reactionary to news events. If they schedule a new launch the stock could react positively or negatively. The next earnings date is estimated to be november 12th.
The Leif Soreide High Tight Flag Masterclass

Remember to register for the High tight flag masterclass with Leif! It will be a fantastic learning experience for those who want to catch the next ASTS
I hope you found this article helpful!
Cheers,
-Richard
Recent Trade Lab Reports
-
-
-
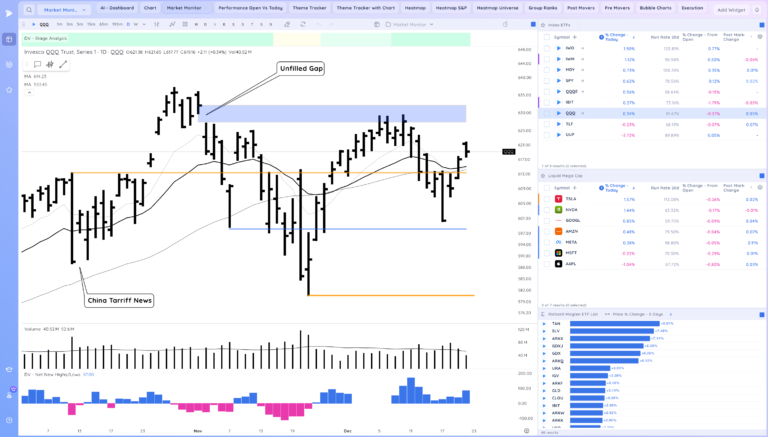
Reclaim of the Level to End the Week. Space Theme in Focus
December 19, 202514 min read -