Episodic Pivots: 5 Simple Steps to Profit and Find Them

Pradeep Bonde
Pradeep Bonde is a seasoned trader known for his expertise in momentum-based strategies and identifying Episodic Pivots, helping thousands of traders enhance their performance through his time-tested approach.
Published: April 11, 2025


Achieve Episodic Pivot Mastery 👇
Learn Pradeep’s method designed to capture rapid stock moves by significant catalysts.
What Are Episodic Pivots?
Earnings season offers two types of opportunities. Some stocks will make an immediate big move post-earnings and can be good short-term trades. The second type of stocks are those that start their rally on earnings day and continue it for months—or sometimes even 3-4 quarters. If a company announces a big earnings surprise and it is not currently priced into the stock, it will go up. This phenomenon is called PEAD, or Post Earnings Announcement Drift.
Ball and Brown, in 1968, first documented the PEAD anomaly. As its name suggests, PEAD is the tendency of stocks that beat earnings expectations to continue to drift upward after the announcement, or likewise for stocks that miss earnings to continue to drift downward. The study shows that if you form 10 portfolios of stocks ranked by their earnings surprise, then the portfolio of stocks in the top 10% by earnings surprise outperforms the other nine portfolios, and similarly, the bottom decile portfolio underperforms the other nine deciles. This is the most researched topic in the financial field; every year, at least 50 new papers are published on PEAD and its persistence.
Earnings are the most important factor affecting stock prices in both the short term and the long term. Investors want to invest in companies that are growing their earnings or are likely to grow their earnings in the future. Wall Street is obsessed with earnings—and rightfully so. Any earnings-related news has the potential to move stocks in either direction. Studies have shown that trading strategies based on post-earnings announcement drift have consistently generated abnormal returns.
When a company announces earnings and the results are “surprisingly” good or bad, it leads to a rally lasting 2 to 3 months. Earnings events are the easiest to understand and act on. The market reaction tells you whether these earnings were a “surprise” and “significant.” The stock will immediately go up following such an announcement, and the move will be supported by high volume.
How to Scan for Episodic Pivots
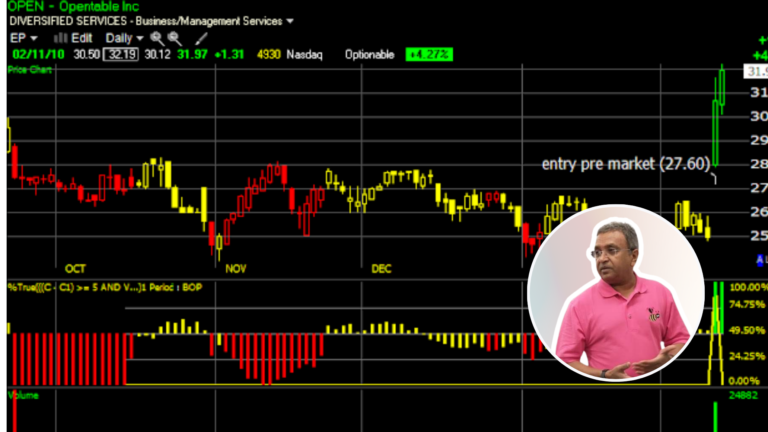
You can create a scan that captures such breakouts. It should basically look for an out-sized price move on high volume post-earnings. One of the simple ways to create a scan like this in Telechart (TC2000) is:
((C - C1) >= 5 AND V > 10000 AND C >= 62.50 AND V > V1) OR (((100 * (C - C1) / C1) >= 8 AND V > 3000 AND (100 * V / AVGV100) >= 300) AND C > 1)A stock appearing in such a scan shows both a volume surge and a price surge. We then investigate what caused this price and volume surge—what was “the surprise” that triggered such a big move, and what is the nature of that surprise. Is this information likely to lead to a significant move?
For that, we look at:
- The context of the earnings: Is this the first major earnings acceleration?
- What caused this acceleration: Is it a one-time event or likely to persist?
- Whether this earnings trend represent a structural change in the industry or the position of the company?
- Whether this surprise is reflected in the current price level?
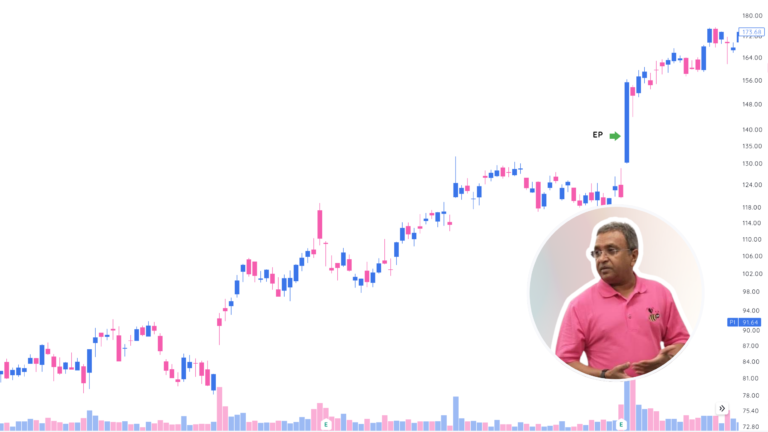
Market reaction tells you a lot about the likelihood of the future prospects of that stock. If the volume is very high, you can assume the move has legs. You will see that most earnings breakouts that go on to make really big moves (like 100% or more) in the next 1 to 2 months post-earnings have a huge volume surge—typically 10 times or more compared to average volume.
In many cases, the volume on earnings day might be the highest volume in the history of the stock or a multi-year high. more compared to the average volume. In many cases, the volume on earnings day might be the highest volume in the history of the stock or a multi-year high volume.
2 Types of Earnings Breakouts in Episodic Pivots
In earnings breakouts there are two kinds of situations:
Stock with no analyst coverage:
Stocks with no analyst coverage are typically smaller companies or companies that are out of favor. On such stocks, a significant earnings acceleration compared to last year’s same quarter as well as quarter over quarter is what to look for. I like to look for companies that have earnings acceleration of 100% plus in such cases.
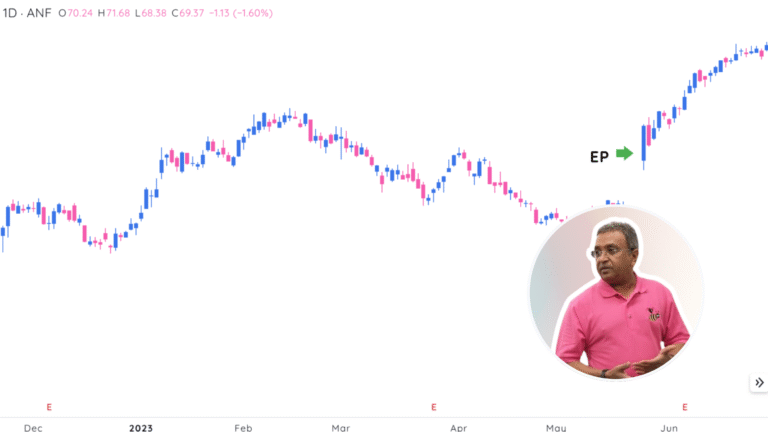
Stock with analyst coverage:
Stocks with analyst earnings coverage are widely followed stocks on the street. Such companies, in most cases, are well-established companies. They have predictable earnings most of the time and analysts keep a very close eye on such companies and constantly adjust their earnings targets.
But once in a while such companies manage to significantly surprise the market and that results in an earnings breakout. Earnings breakouts on companies with significant analyst coverage do not do as well as the first kind. Genuine analyst surprises are rare and in many cases, companies pre-announce and manage earnings expectations to avoid significant surprises. Established companies also often time secondaries and other capital raising events to time with such surprises and so often you find the EP on such stocks tend to have a pullback.
Earnings Breakouts and Low Float
This is an ideal combination. In such situations, you can have a really explosive move. A float below 25 million is ideal for this, with the best moves happening on stocks with a float below 10 million. Earnings breakouts on companies with a float of over 100 million tend to have pullbacks. Earnings breakouts on stocks with a float of 500 million or more are not very appealing unless they are trading near their historic lows or are in single digits.
Every day, we monitor earnings before and after the market closes and look for trades. Earnings are not the only catalyst that can move a stock significantly; many other catalysts can lead to big moves. Such episodic catalysts can help you find many profitable trades. On a daily basis, I monitor around 20 types of episodic catalysts.
Symbol: OPEN
Company: Opentable Inc
Year: 2010

Click on the chart above to make it bigger.
Different Types of Episodic Pivots
- Earnings Growth 100% Plus
- Earnings 40% Plus
- Earnings Beats by Wide Margin
- Earnings Other
- Sales 100% Plus but No Earnings
- IPO Breakout
- Retail
- Top Sector
- New Order or Contract / New Order Rumor
- Buyout/Buyout Rumor/Mergers/Tie-Ups/Division Sale
- New Product Launch/News
- Regulatory Changes
- Drug Approval
- Drug/Marketing Tie Up
- Natural Disaster/War/Disease
- Shortages
- Rate Increase
- Media Mention
- Analyst Upgrade/Downgrade
- Declares Dividend
- Financial Engineering
- Junk of the Bottom Rally
Finding Episodic Pivots in Practice
The process involves:
- Monitoring earnings releases for unexpected results.
- Scanning for significant volume surges, typically 10 times or more compared to the average.
- Verifying if the price surge is supported by high volume and if the move aligns with the expected PEAD pattern.
- Evaluating the context: checking if the earnings surprise is a first major acceleration, if it’s likely to persist, and whether it signals a structural change in the company or industry.
- Determining if the surprise is already reflected in the current price level.
Final Thoughts on Episodic Pivots
Earnings breakouts and subsequent Episodic Pivots are among the most researched and reliable phenomena in finance. When a company posts an earnings surprise, it can lead to a rally lasting 2 to 3 months. This provides a window for traders to capture significant moves if they can correctly identify the setup using a scan or manual analysis.
In summary, the key to finding episodic pivots is to look for stocks with:
- An outsized price and volume move post-earnings.
- A context that supports a sustained rally (e.g., first major acceleration, structural changes).
- Low float (ideally below 25 million) to maximize explosive moves.
By combining these elements with robust scanning criteria and analysis, you can effectively capture these trading opportunities.
Frequently asked questions
Related articles
-
3 Sectors for Big Moves in Episodic Pivot Trading
April 18, 20254 min read -
6 Key Factors That Make an Episodic Pivot Explosive
April 10, 20254 min read -