Why the RS phase helps you spot winning stocks
If you want to find the strongest stocks in the market, relative strength (RS) is a great place to start. It’s not just about whether a stock is going up – it’s about how it’s performing compared to the overall market or other stocks.
For example, if the market is falling but a stock is barely moving, or even rising, that stock has strong relative strength. It’s standing out when others are struggling.
That kind of strength usually isn’t random. More often than not, it’s a sign that the stock is in a Relative Strength Phase (RS phase).
Large Institutions tend to build positions slowly and strategically, especially during market corrections or sideways action. You might not notice it right away, but their steady buying leaves a trail. Traders pick up on these subtle signals through the RS phase.
What makes the RS phase so useful is that it puts price action into context. It doesn’t just tell you what a stock is doing – it shows you how it’s doing compared to everything else. And that’s a powerful way to find potential leaders before they break out.
This is especially helpful when the market’s going through a rough patch. Most stocks will pull back, but the ones with strong RS either hold their ground or drop less. That’s a major clue. These are often the stocks that bounce back first when the market turns around.
Bottom line? Relative strength cuts through the noise and helps you zero in on the stocks that are already showing real demand. And in a choppy market, that edge can make all the difference.
How traders use the RS phase to gain an edge
One of the biggest challenges in trading is knowing which stocks to focus on. That’s where the Relative Strength Phase (RS phase) comes in – it helps you filter out the noise and zero in on stocks that are already proving themselves.
With tools like the Relative Strength Line (RS line) paired with a moving average, you can quickly find these strong performers and focus your attention where it matters most. That’s where the Relative Strength Phase will come in – when the RS line is above the moving average.
Stocks in the RS phase are consistently outperforming the market. Focus on stocks in the RS Phase to get in early on emerging trends and confirm breakouts are backed by strength while staying in sync with the leaders in the market.
Instead of chasing every breakout or guessing which stock might turn around, the RS phase points you toward the ones already outperforming the market. These stocks tend to hold up better during pullbacks, and sometimes they even rise while everything else is falling.
Trading isn’t just about finding what’s moving – it’s about finding what’s leading. And by focusing on the RS phase, you’re putting yourself in a better position to ride trends, manage risk, and stay one step ahead.
What is the RS phase, and why does it matter?
The Relative Strength Phase is a powerful signal that helps traders find stocks likely to outperform the market, especially at market turns and new uptrends.
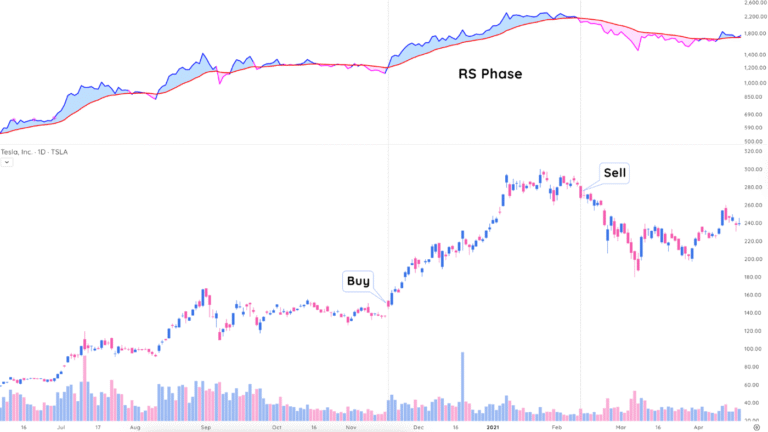
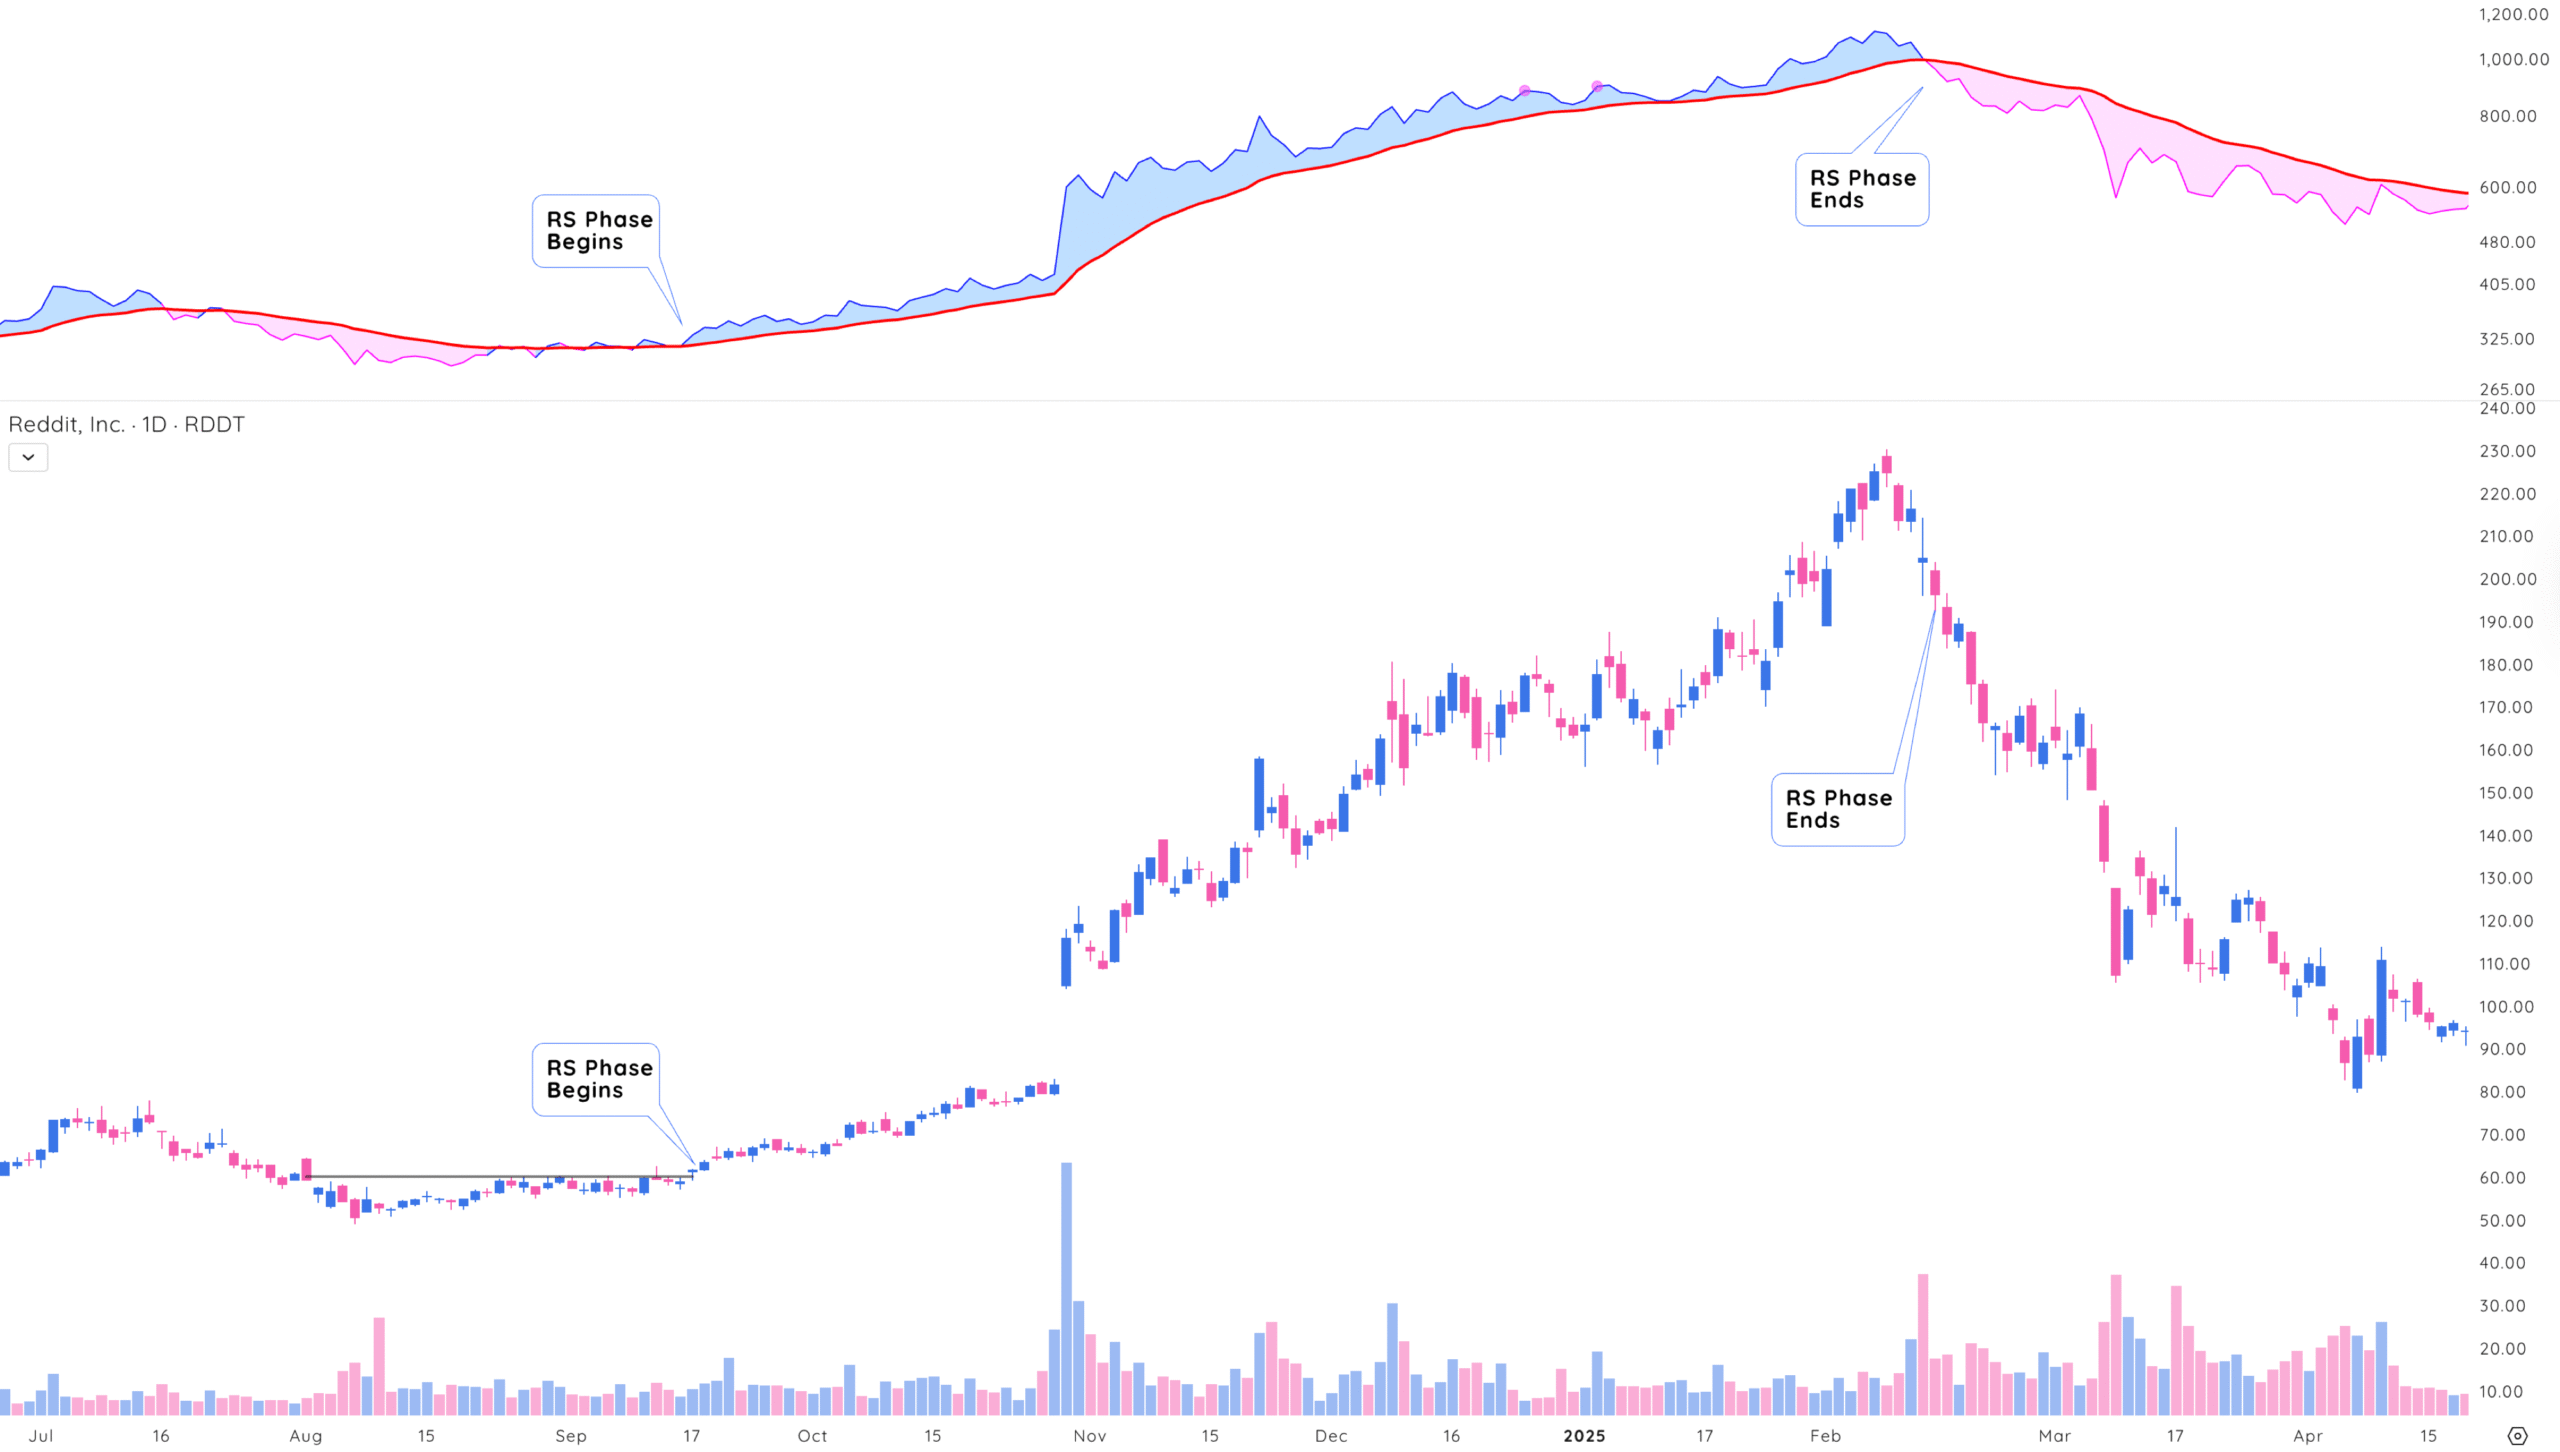
It happens when a stock’s Relative Strength Line moves above its 21-day Exponential Moving Average (EMA). This signals that the stock is gaining strength compared to a major index like the S&P 500 or Nasdaq.
In simple terms, the RS Phase means the stock is quietly leading, often before its price breaks out.
What the RS line tells you about market leadership
The RS Line shows how a stock is performing relative to the market. It’s calculated by dividing the stock’s price by the index’s price.
- If the RS line is rising, the stock is outperforming the market.
- If it’s falling, the stock is lagging.
When the RS line stays above the 21-day EMA, it means that strength is sustained, not just a one-day pop. That’s what defines the RS Phase.
This is often a sign of institutional accumulation, where big investors like funds and hedge funds are slowly buying in.
Why the RS phase is a key indicator of strength
The RS Phase helps you find resilient stocks showing continued strength. While most names are falling, RS Phase stocks:
- Hold up better
- Show consistent strength
- Bounce when the market recovers
These are the stocks that can become future leaders.
What to look for in an RS phase setup
- RS line above the 21-day EMA
This shows steady outperformance – not just a temporary move. - RS line making new highs
When large funds are building positions, it shows up when the RS line makes new highs. - Leads price action
The RS line often moves before the price breaks out, giving you an early warning.
How to find RS Phase stocks
You can spot RS Phase stocks using tools like Deepvue’s RS Line
- Plot the RS Line and its 21-day EMA
- Look for when the RS Line crosses above and stays above the EMA
- Pay attention to new RS highs, even when the stock’s price hasn’t moved yet
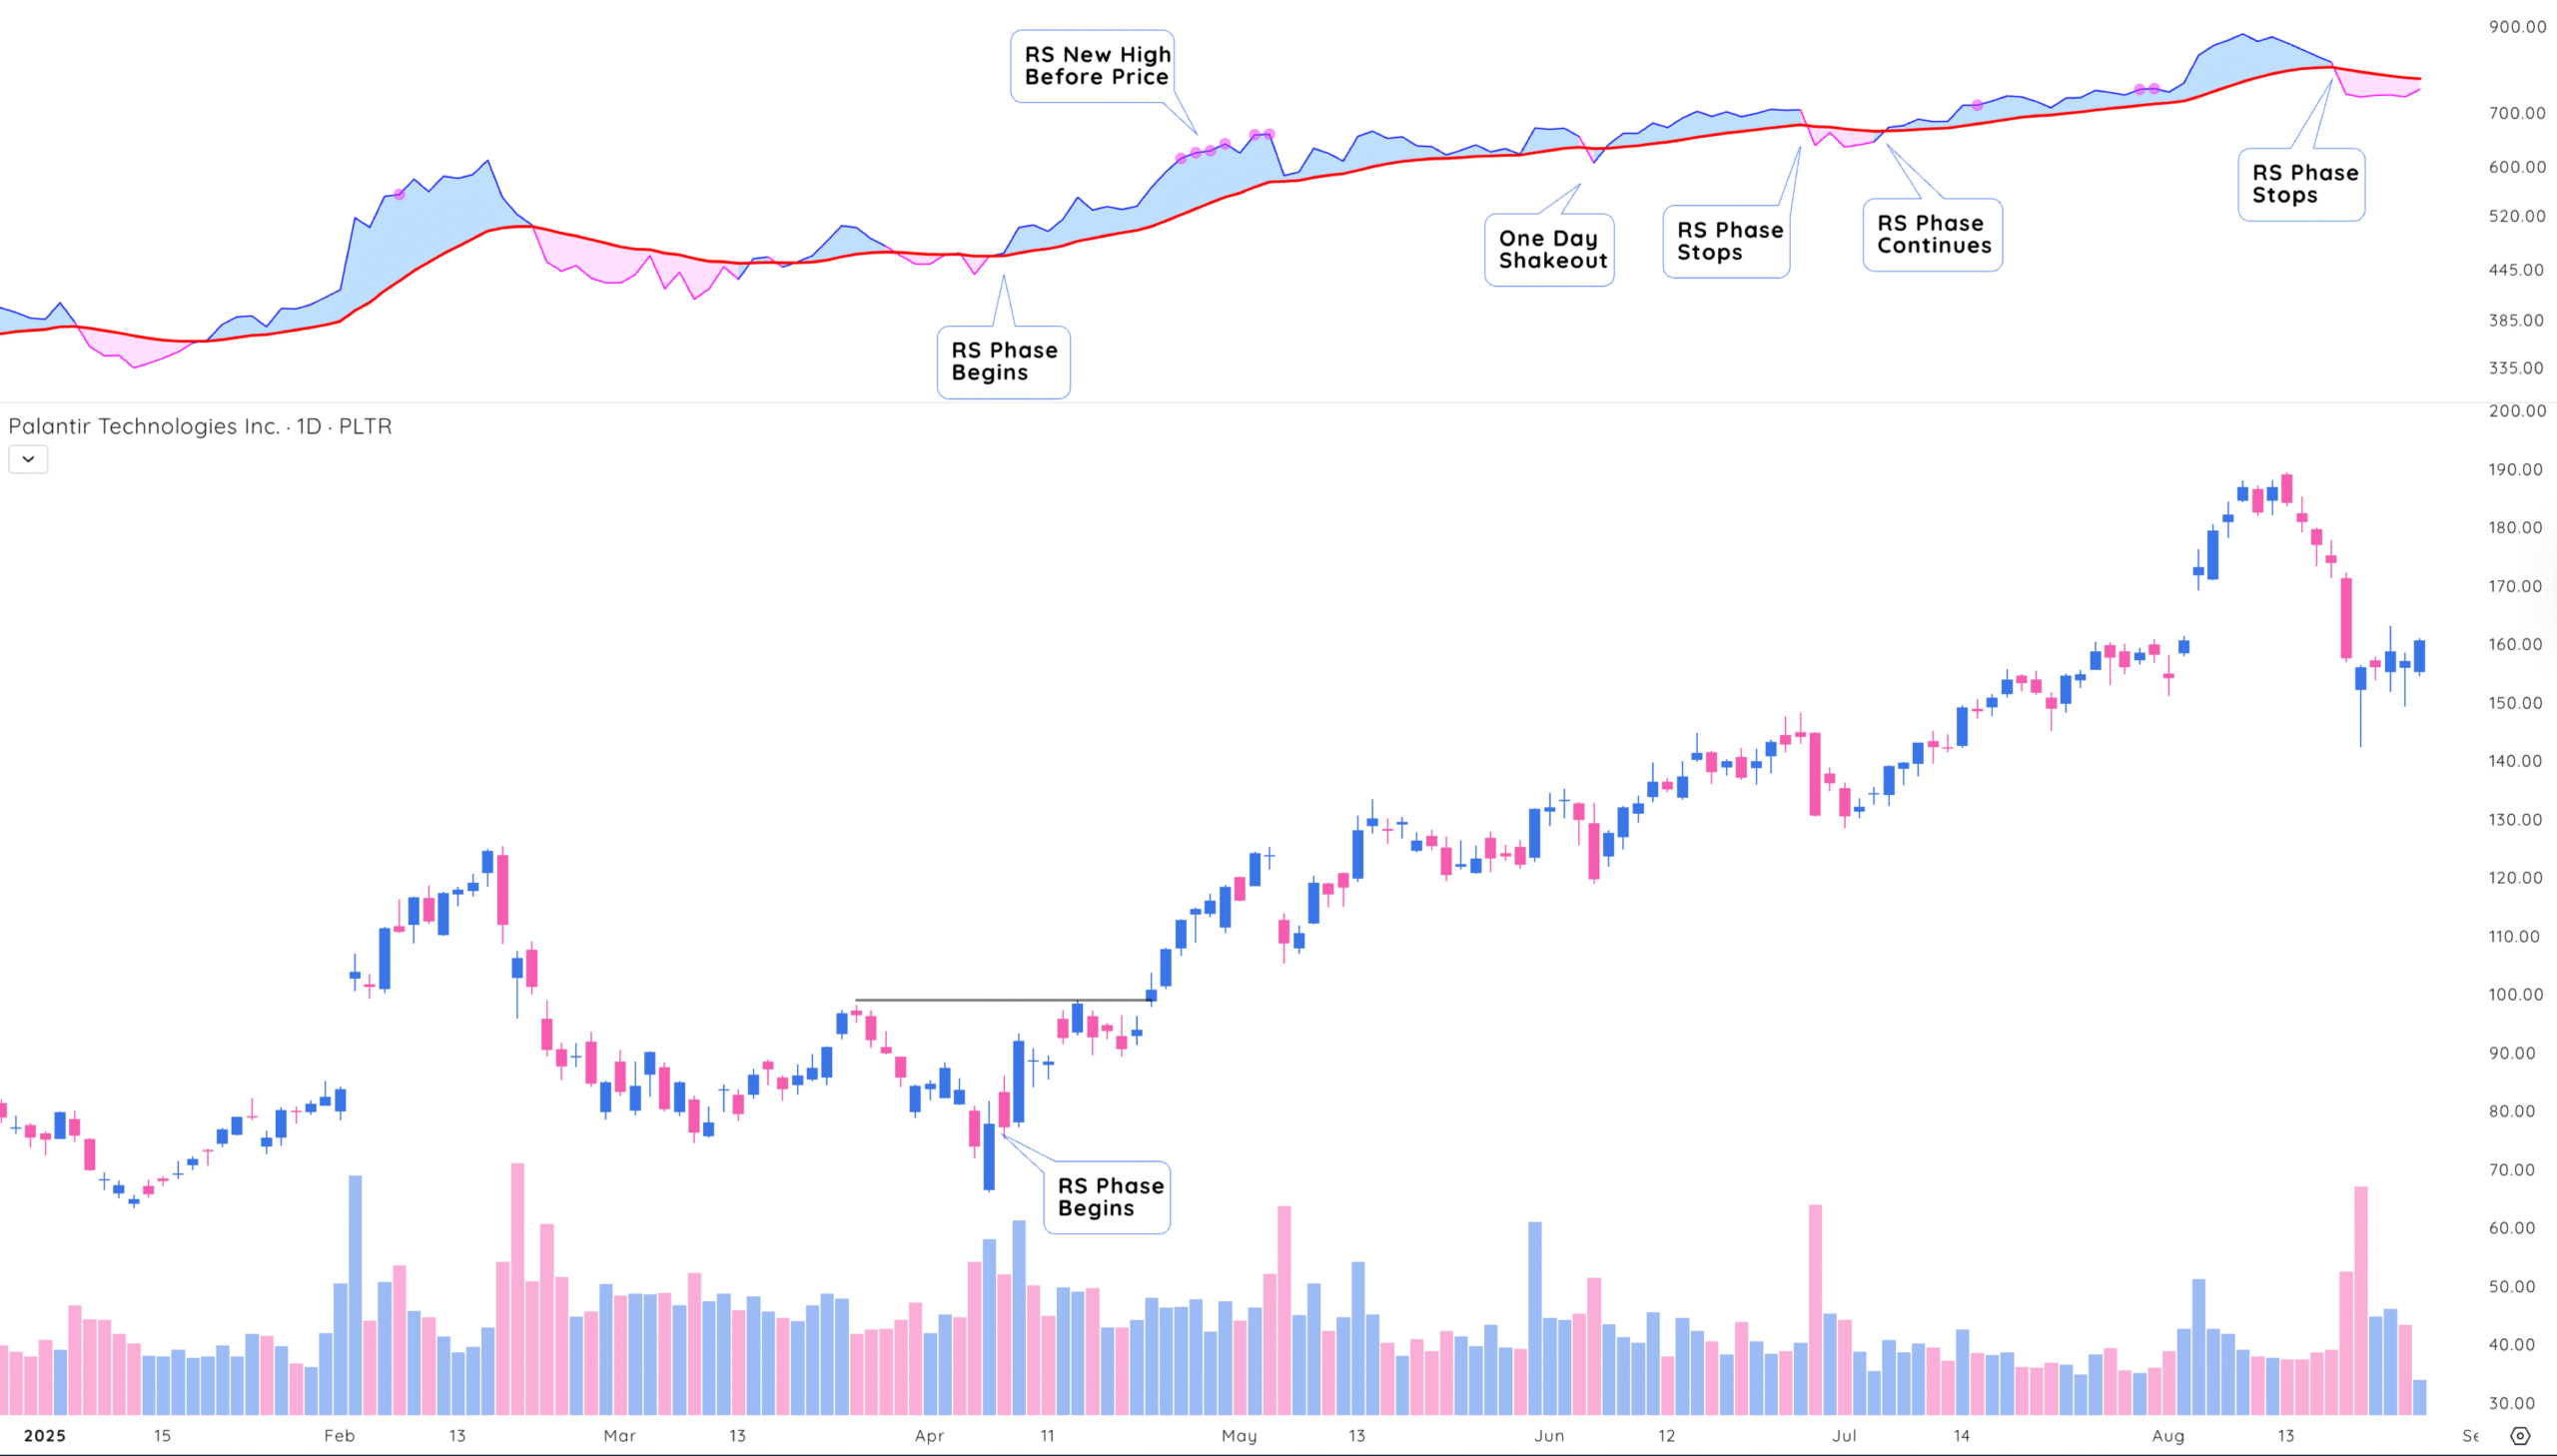
- Use visual cues like Deepvue’s pink dots that flag RS line highs before price highs
Real-world RS phase examples to study
The RS Phase is one of the most reliable ways to find strong stocks before they break out. It’s simple but powerful:
- Focus on RS lines above the 21-day EMA
- Watch for new RS highs before price highs
The RS phase becomes extremely powerful in showing opportunities before the traditional base breakout. Notice how when PLTR was basing in April of 2020, the RS line moved above the 21-day EMA.
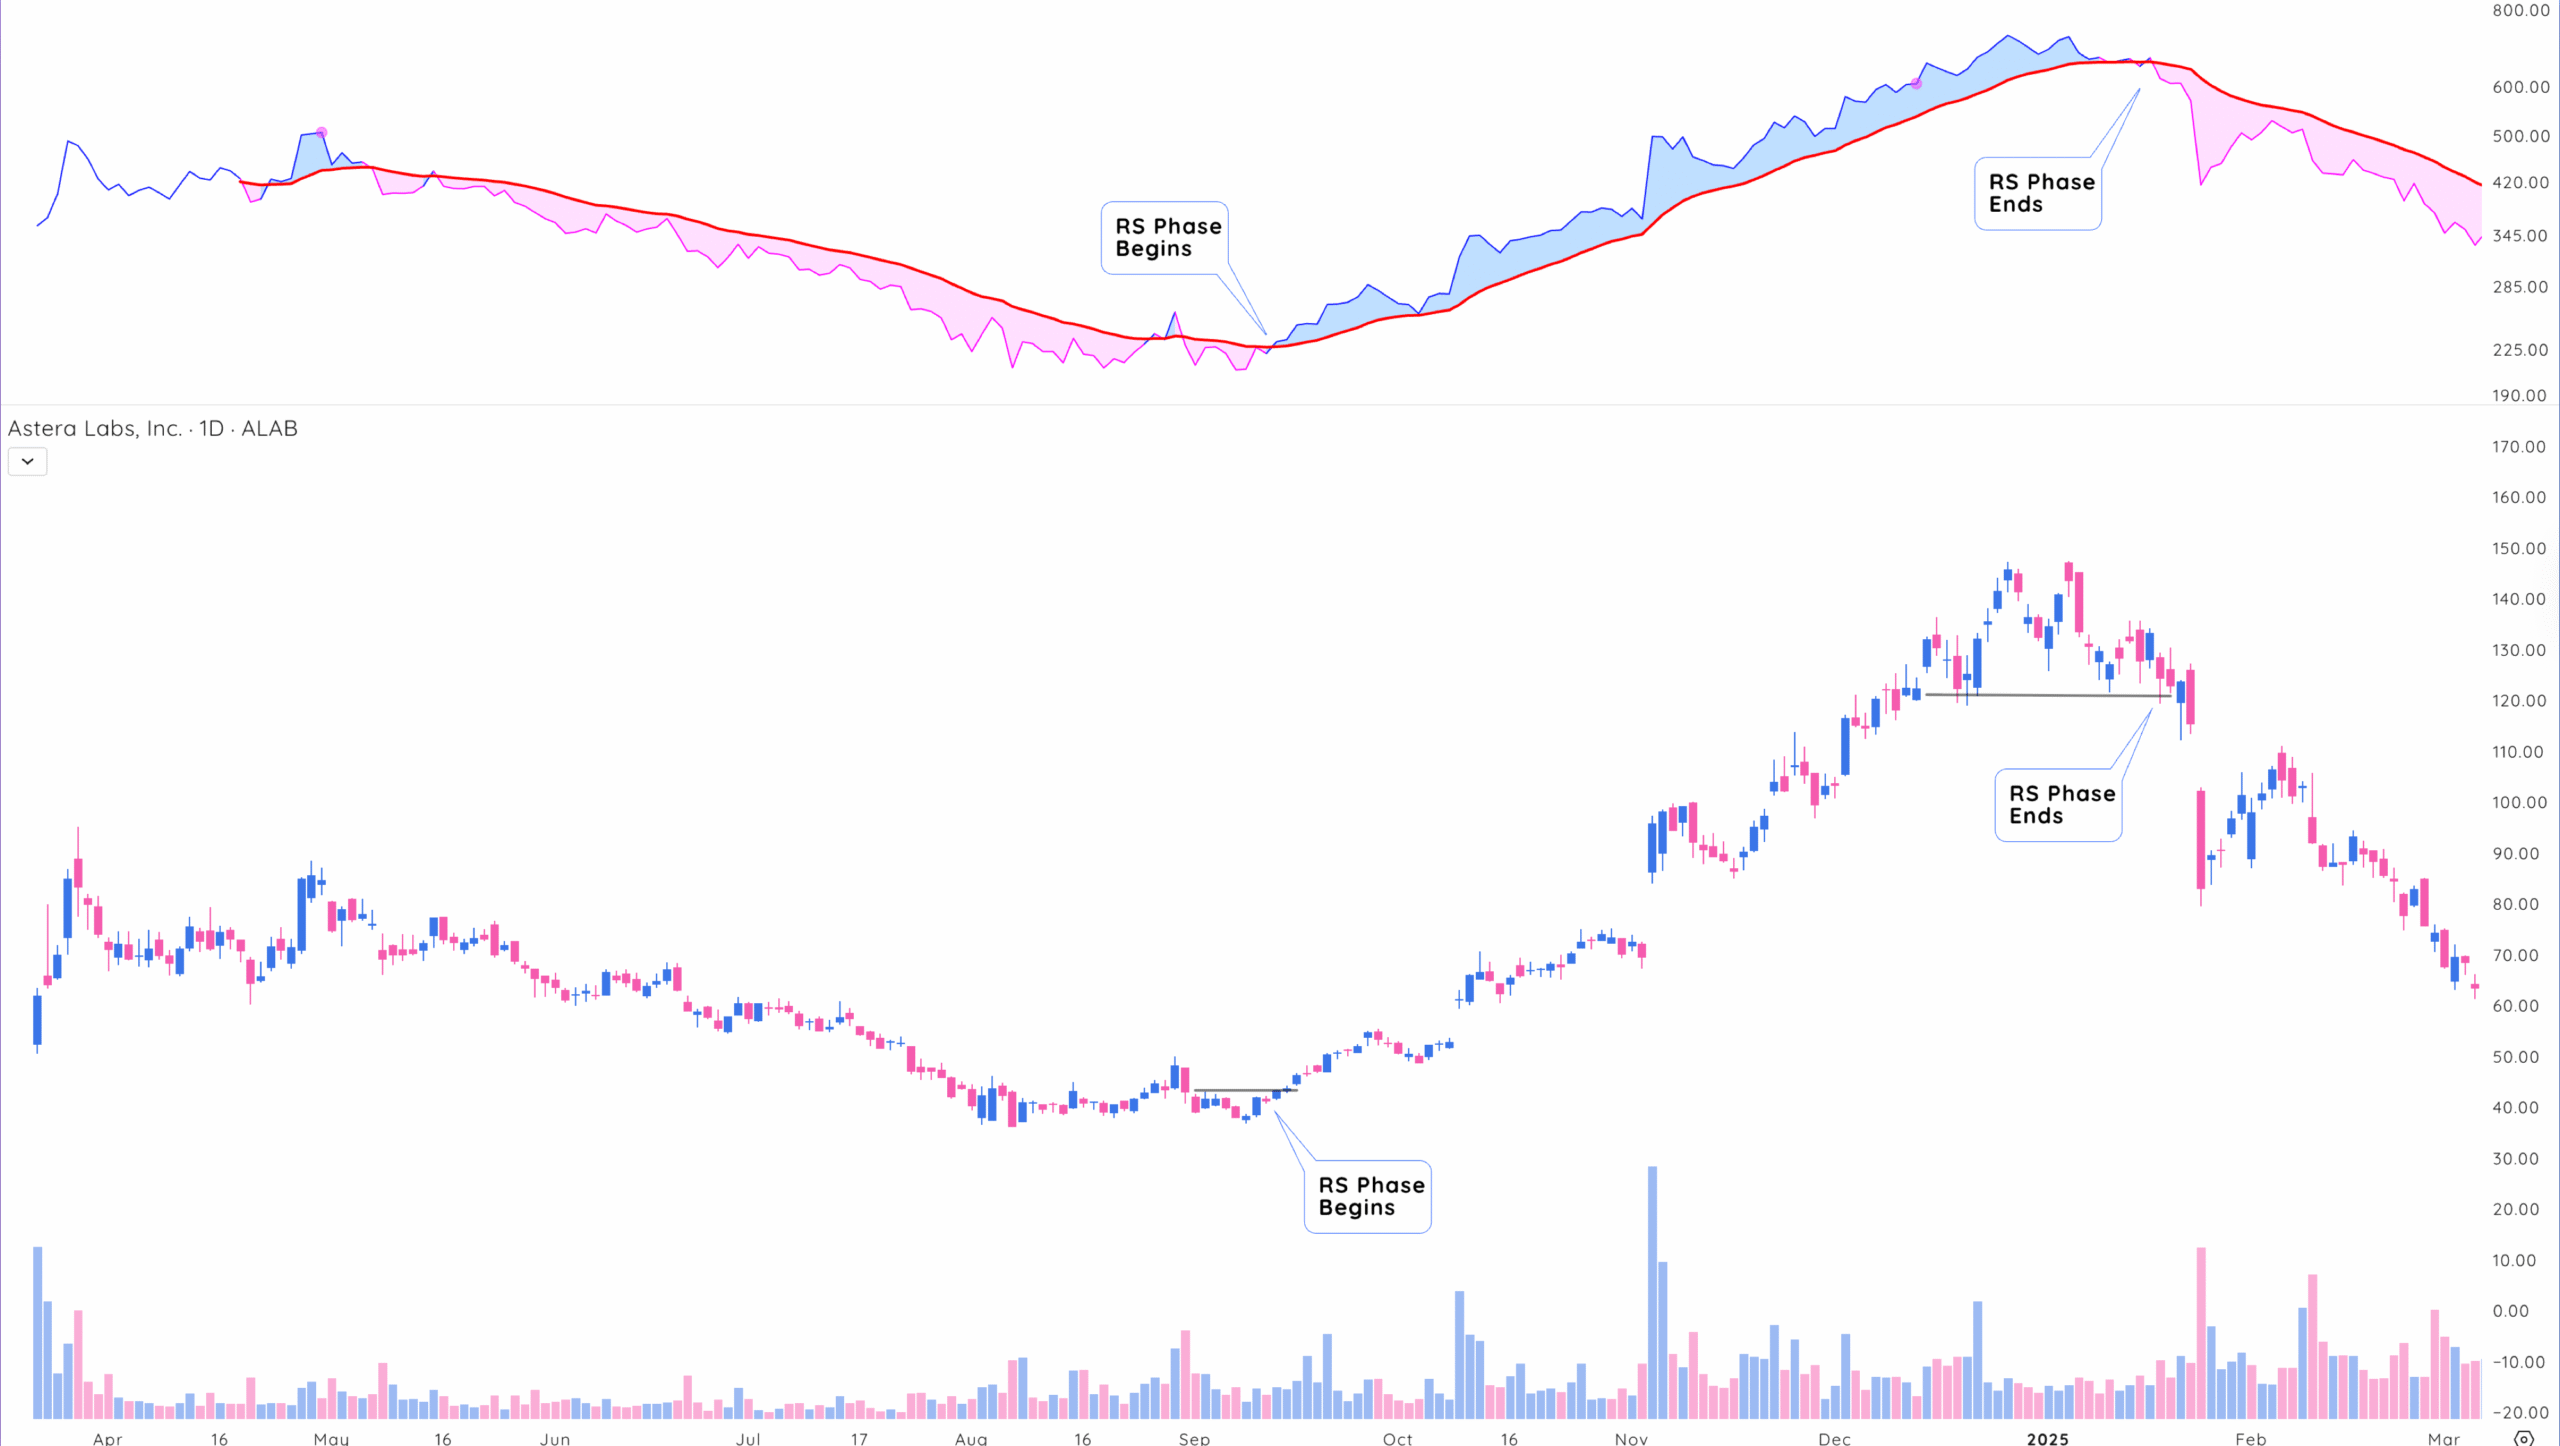
As you continue studying various technical patterns, you will see that the RS phase gives early signals. The RS phase began low in ALAB’s first base and ended before a clear head-and-shoulders topping pattern confirmed lower.
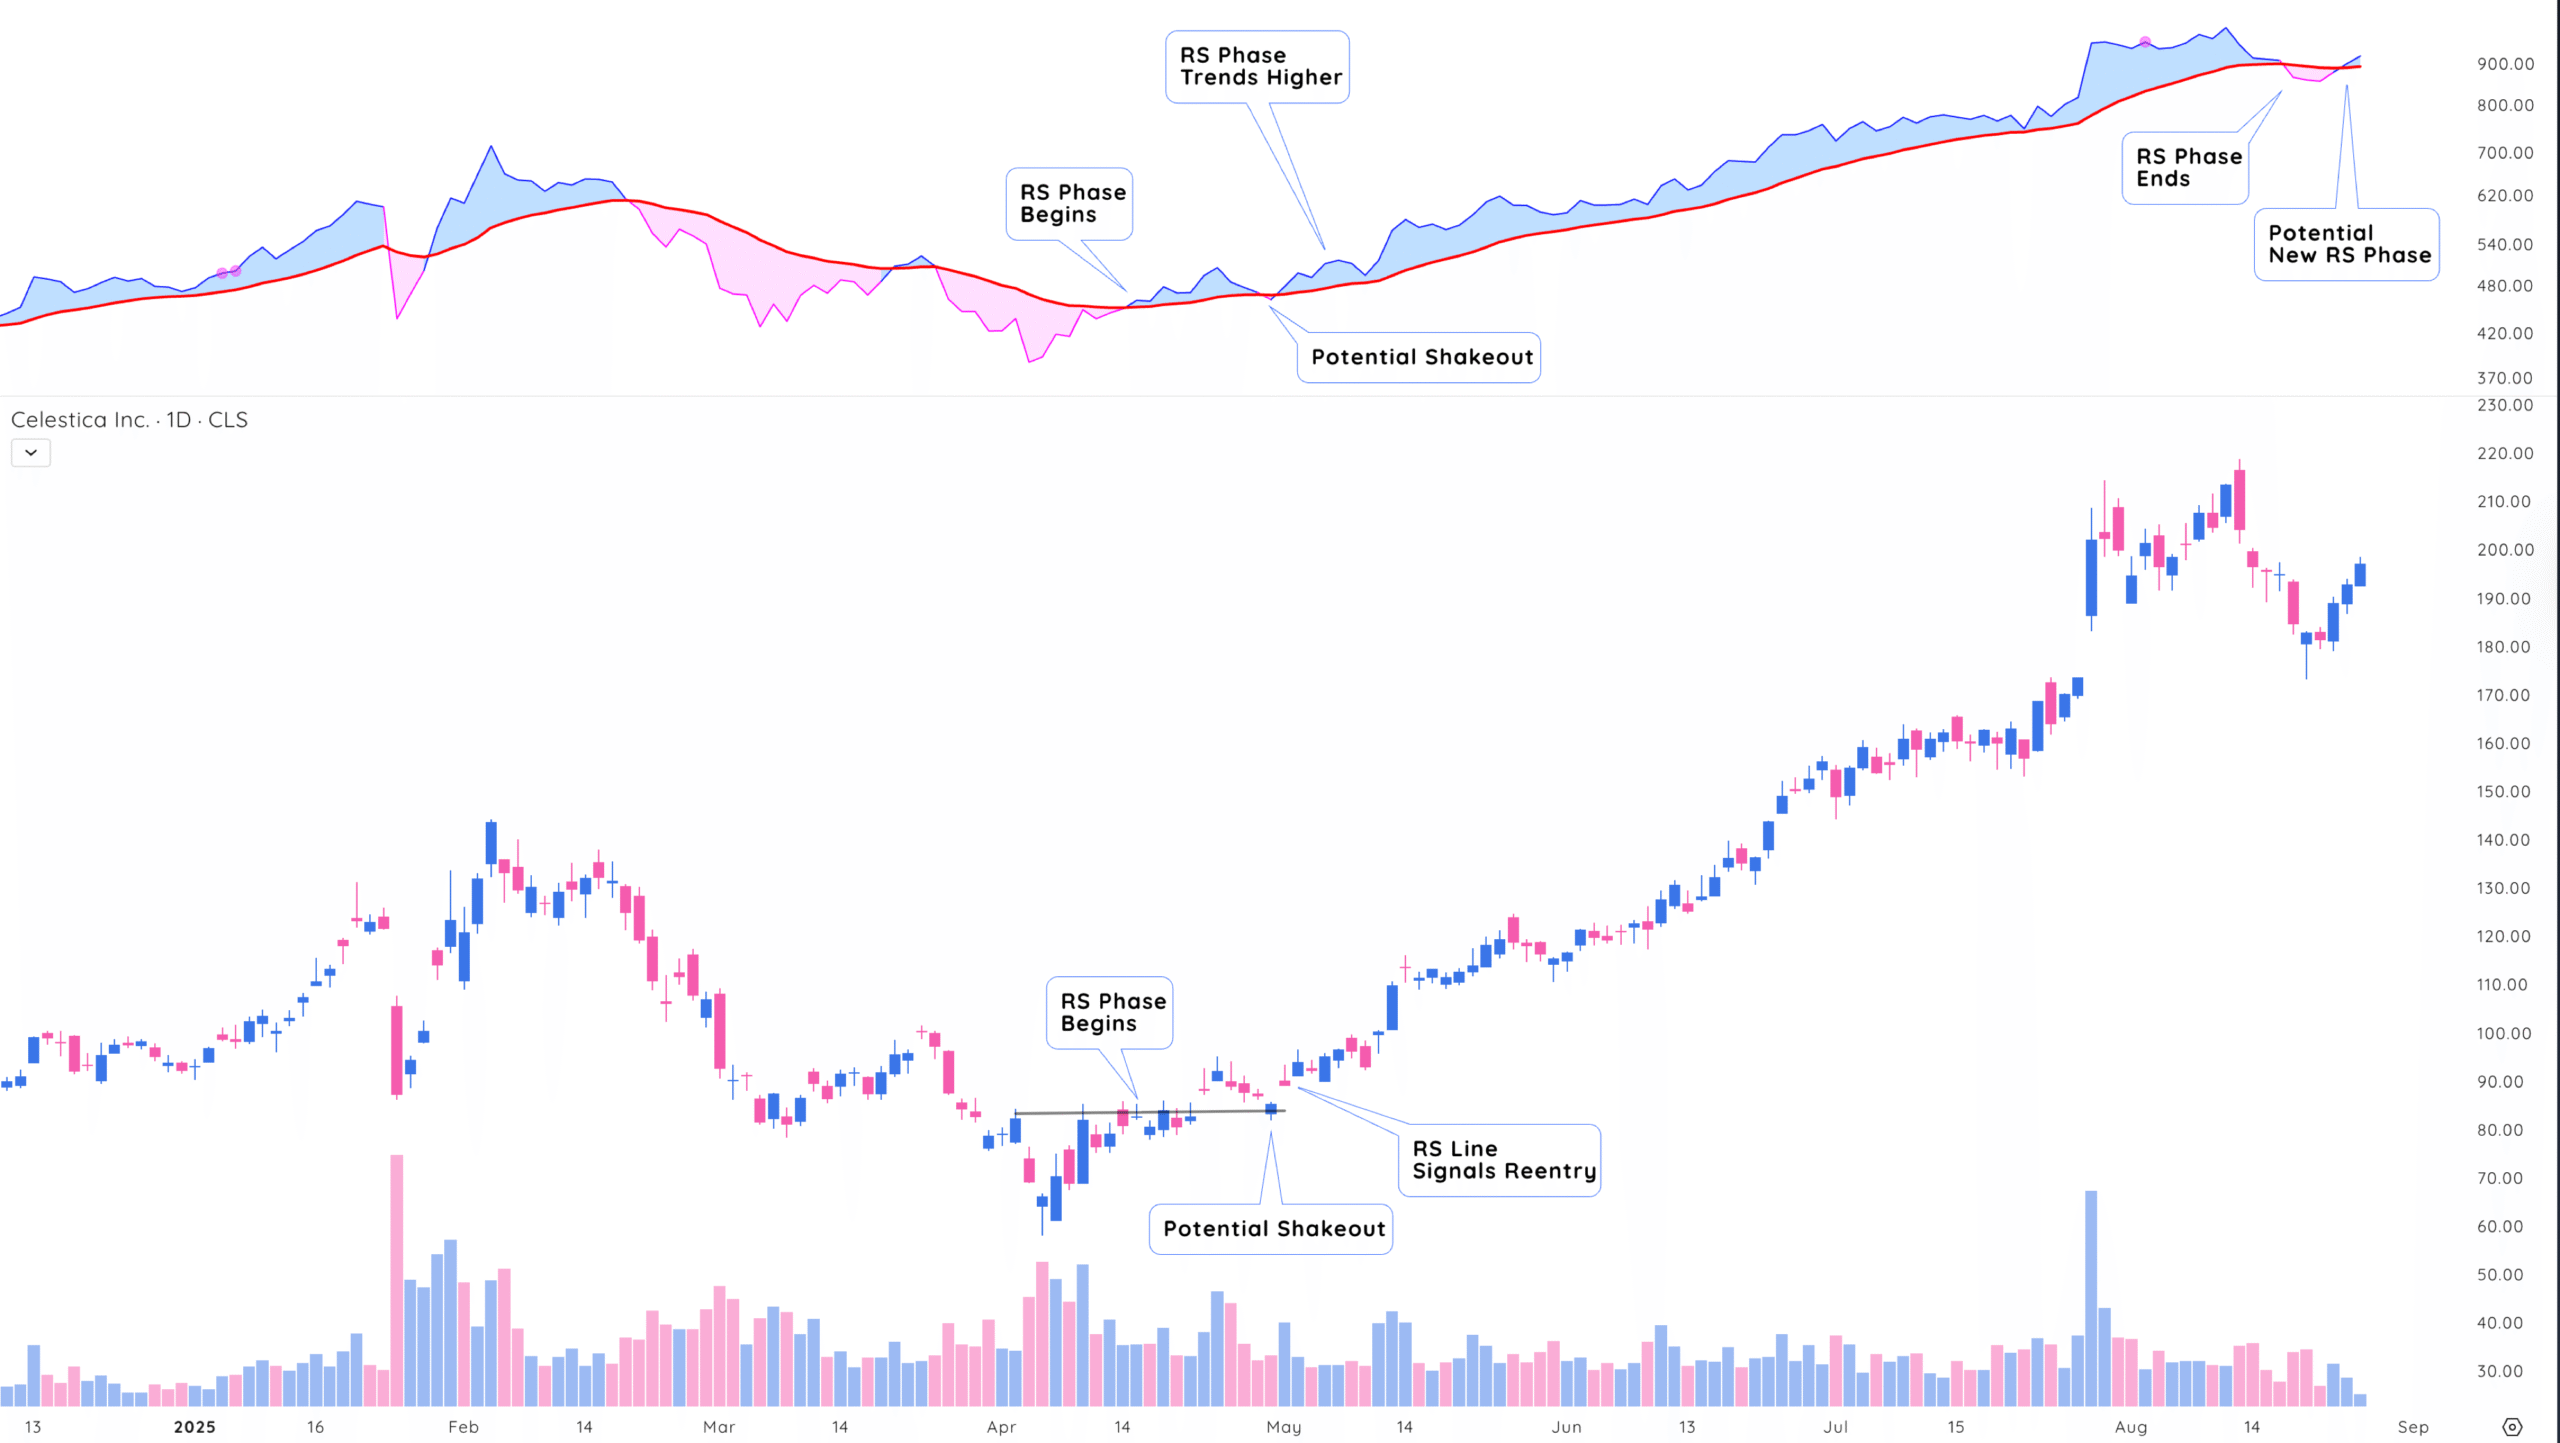
The RS phase helps gain conviction with your stocks. There may be a quick shakeout when the RS line dips below the 21-day EMA, but be quick to reenter the position if the RS line turns back higher and confirms the trend.
The RS phase is more than just a buy signal – It also warns when to sell. After a prolonged uptrend, get defensive when the RS phase ends.
How to find stocks showing continued relative strength
If you want to trade the best stocks, focus on stocks in the RS phase that continue showing relative strength while it advances. Continued relative strength confirms which stocks are outperforming the market.
1. Look for RS line making new highs:
The RS line tracks how a stock is performing compared to the market. When the RS line hits a new high, it means that stock is outperforming.
Even if the stock price isn’t at new highs, the RS line tells you strength is building under the surface. This is often a clue that big institutions are buying in quietly.
2. Watch for RS line new highs before price:
Sometimes, a stock’s RS line will break out to new highs while the price is still going sideways. This is one of the most bullish early signals you can get.
It shows the stock is outperforming while everything else is weak or flat. That kind of quiet strength usually leads to powerful price breakouts once momentum kicks in.
3. Count RS days during market pullbacks
An RS day is when a stock closes stronger than the overall market. Instead of just looking at one big up day, count how often a stock outperforms day by day.
The more RS days you see, especially during market pullbacks, the stronger the stock is.
Final Thoughts: Trading Stocks in the Relative Strength Phase
The Relative Strength Phase isn’t just a fancy technical concept – it’s a real-world tool that gives you an edge. It helps you cut through the noise, focus on what’s actually working, and stay aligned with the strongest names in the market.
By watching the RS line and its 21-day EMA, you can spot early signs of institutional buying and get ahead of breakouts. You’ll know which stocks are quietly leading and which ones are likely to bounce back first when the market turns.
Whether you’re new to trading or looking to sharpen your strategy, the RS phase gives you a reliable, repeatable way to find high-potential setups without the guesswork.
So next time the market gets choppy, don’t just react – look for RS phase stocks and let relative strength guide your next move.

