
6 Ways to Use Relative Strength to Spot Market Leaders
Published: August 12, 2025


What is relative strength?
When you’re looking to trade top-performing stocks, relative strength (RS) is one of the most important tools you can use. In simple terms, it compares how a stock is performing relative to a major index, like the S&P 500 or Nasdaq, or to other stocks.
If a stock is going up more than the market, or dropping less when the market is down, it’s showing strong relative strength.
This strength often signals that large institutional investors are quietly buying shares, even during market corrections or sideways action. They slowly build positions in their highest-conviction ideas while prices are low.
That steady accumulation might not cause big price spikes right away, but it does leave behind subtle signs that traders call relative strength.
What makes this powerful is that RS isn’t just about price – it’s about price performance in context. This type of behavior often points to underlying demand, which can be a major clue for future breakouts.
RS is especially helpful during market corrections. While most stocks are pulling back, the ones with strong relative strength either fall less or stay flat, signaling resilience and potential leadership when the market turns around.
In short, relative strength helps you cut through the noise and zero in on stocks that are showing strength
Why is relative strength important for traders
As a trader, your goal is to find the ones that are outperforming. That’s where relative strength becomes one of the most valuable tools in your toolkit.
Strong RS tells you that a stock is leading the market, especially during tough conditions. When most stocks are falling, those with high relative strength often hold up better, or even rise.
That’s a key sign institutions are still buying (or not selling). These are the stocks that tend to be the next market leaders.
Using tools like the RS Rating and RS line on platforms like Deepvue makes it easier to spot these outperformers. Whether you’re building a watchlist or timing a breakout, RS helps you:
- Identify market leaders
- Catch trends early
- Avoid weak stocks
- Confirm breakout strength
- Stay aligned with market momentum
At the end of the day, trading is about stacking the odds in your favor. And by focusing on stocks with strong relative strength, you’re staying in sync with the best-performing names in the market. Let’s dive deeper into how to find these stocks and use RS to your advantage.
Clues that reveal relative strength in stocks
Spotting relative strength (RS) isn’t just about comparing performance charts. There are subtle clues in a stock’s day-to-day price action that help confirm whether it’s truly standing out from the rest of the market.
These clues often show up before a stock breaks out, giving traders an early edge.
By learning to recognize these patterns, you’ll be able to find stocks that are quietly being accumulated, even when the broader market is weak or choppy.
Recognizing these clues can give you a serious edge. When you combine multiple signs, you’ve likely found a stock with true relative strength.
Keep these patterns on your radar and you’ll stay one step ahead in spotting emerging leaders.
Stock up on market down days
One of the most obvious signs of relative strength is when a stock moves higher on a day the market moves lower. While most stocks are dragged down with the major indexes, a stock that finishes green, or even flat, on a red market day is showing demand.
This can also apply to more subtle moves:
- If the market makes a new low, but the stock doesn’t break its previous low, that’s RS.
- If the market is trading inside the prior day’s range, but the stock breaks out to a new high, that’s also RS.
These are signs that the stock is resisting selling pressure and possibly being supported by institutional buyers. In many cases, this early strength hints at future leadership once the market turns back up.
Highest volume edge
Another major clue of relative strength is a huge volume spike with bullish price action, especially when it is the highest volume ever. Historically, 60–70% of top-performing stocks show this volume signature before major breakouts.
What to look for:
- Highest volume ever – Strongest signal, often marks the start of a big trend
- Highest volume since IPO – Shows fresh institutional interest
- Highest volume in a year – Indicates a potential turnaround or re-accumulation
These spikes often signal institutional buying, a major catalyst, or a shift in trend. When you see unusually high volume paired with strong price action, it’s a strong clue that a big move could be starting.
Stronger candles compared to the market
Price bars or candlesticks offer more clues than you might think. When the overall market closes near its lows, but a stock closes near its daily high, that’s a clear signal of RS.
Here are a few specific patterns to watch:
- High daily closing range (DCR): When a stock finishes in the upper portion of its daily range, even while the market closes near its lows.
- Higher lows vs. the market: If the broader market keeps making lower lows, but the stock holds a higher low, it’s resisting the downtrend.
- Inside action vs. breakout behavior: If the market is trading inside the prior day’s range and a stock breaks out, or vice versa – if the market breaks lower but the stock stays tight inside – those are RS moments.
These stronger candles show the stock is not only holding up, but actually behaving better than the market. It tells you buyers are stepping in consistently, while sellers are staying out of the way.
Tools to uncover relative strength in stocks
Spotting relative strength is about using the right tools to identify subtle but powerful clues that show which stocks are leading the market. Thankfully, traders have several indicators at their disposal that make it easier to uncover strong names before they break out.
Here are three of the most effective tools for identifying relative strength: the Relative Strength Line, the Relative Strength Rating, and RS Days.
Relative strength line
What is the relative strength line?
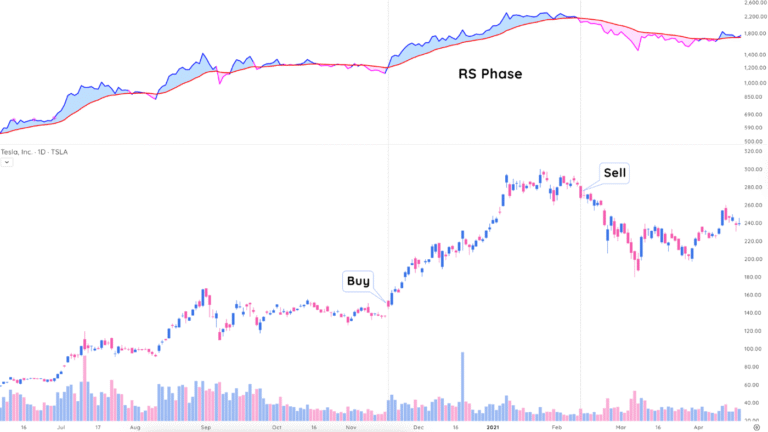
Just like you’d study price and volume on a chart, you can also track relative strength visually through the Relative Strength Line. This line compares a stock’s price performance to a benchmark index, usually the S&P 500, over time.
How it works:
- RS Line = Price of Stock / Price of Benchmark Index
- This ratio forms a line that moves up, down, or sideways depending on how the stock performs relative to the index.
The trend of the RS line is what matters most. An upward-sloping RS line means the stock is outperforming the market. If it trends lower, the stock is lagging. Even if the stock’s price stays flat, a rising RS line suggests strength under the surface, usually from institutional accumulation.
Symbol: DOCU
Company: DocuSign, Inc.
Year: 2020

During the 2020 COVID correction, DOCU’s RS line kept rising while its price was flat. After the market rebounded, DOCU exploded 350%—the RS line gave early clues.
How to interpret the relative strength line
What makes the RS line so powerful is that it acts as a leading indicator. Unlike lagging indicators (like MACD or Bollinger Bands), the RS line often moves before the price does, signaling where the strength is building.
Key signals:
- RS line rising while the stock is flat = early accumulation
- RS line breaks to a new high before the stock does = leading indicator of a potential breakout
- RS line holds or climbs during a market correction = institutional support
RS rating
What is the RS rating?
While the RS line gives you a visual, the Relative Strength Rating (RS Rating) gives you a clear numerical score that ranks a stock’s performance against all other stocks.
The RS Rating can be a weighted average of a stock’s performance across 1-month, 3-month, 6-month, and 12-month periods, to cater to various trading styles. This lets traders see how a stock is behaving in both short- and long-term contexts.
What the numbers mean:
- RS Rating = 1 to 99
- A 90 rating = better than 90% of stocks
- A 50 rating = middle of the pack
- A 15 rating = underperforming 85% of the market
How to interpret the RS rating
Top-performing stocks typically have an RS Rating above 80. Before major price moves, strong stocks often show rising RS Ratings
Focus on stocks with RS Ratings above 80 that are also building tight bases or showing bullish price patterns.
Combining RS Ratings with earnings and sales growth adds even more conviction. A stock with a high RS Rating and accelerating fundamentals is a strong candidate for leadership.
Relative strength days
What are Relative Strength days?
Relative Strength (RS) Days are individual trading days when a stock outperforms the market, especially important during corrections or downtrends.
When the market is weak, the best stocks don’t just avoid falling – they often trade sideways or even rise. Tracking how often a stock outperforms on red market days can reveal which stocks institutions are quietly supporting.
Examples of RS Day behavior:
- Stock closes higher when the market closes down
- Stock makes a higher low while the index makes a new low
- Stock closes in the upper range while the market finishes near the lows
- Stock breaks to a new high while the market trades inside or down
By counting RS Days during a market correction, you can identify which stocks are refusing to break down. Stocks with 60% of their trading days as RS days are usually the first to break out when the market turns.
Symbol: CRWD
Company: CrowdStrike Holdings
Year: 2023

How to count RS days
- Switch from RS Line to candlestick view
- Mark each day a stock closes higher than the previous day, while the index is flat or lower
- Tally the total RS Days over the correction period
💡 Pro Tip: When multiple stocks from the same industry are racking up RS Days, that’s a potential new leadership group to watch closely.
Key points about using relative strength to find leading stocks
Relative strength is a window into what the strongest stocks are doing under the surface. By learning how to spot RS using tools like the RS line, RS rating, and RS days, you can stay focused on true market leaders, even when conditions get tough.
Key points to remember:
- Relative strength compares performance: It shows how a stock is performing relative to an index or other stocks – highlighting names with true momentum.
- Strong RS often signals institutional demand: When a stock holds up or rises during a market correction, that’s usually not random. Institutions are likely accumulating.
- RS tools help you act early: The RS line shows trend strength visually, the RS rating quantifies performance vs. peers, and RS days track consistent outperformance during pressure.
- Volume spikes confirm RS: High-volume moves paired with strength are often a sign that a big move is just starting.
- Price action offers subtle RS clues: Look for higher lows, strong closes, or breakouts on weak market days. These signals show real buying interest.
- Leading stocks often show RS before breaking out: Stocks with the most RS during corrections are usually the first to hit new highs when the market recovers.
- Group RS matters too: If several stocks in the same industry show RS at the same time, that group is likely becoming a new leadership area.
By focusing on relative strength, you’re positioning yourself ahead of the next big move. Combine RS tools with your chart analysis and fundamentals, and you’ll consistently find the stocks that truly lead.
Frequently asked questions
Related articles
-
-
Analyze Stock Market Sentiment to See What Others Are Thinking With These 3 Tools
August 5, 20259 min read -

How to Use the S.N.I.P.E. Framework to Improve Your Trading Edge
June 24, 20254 min read -
