Analyze Stock Market Sentiment to See What Others Are Thinking With These 3 Tools
Published: August 5, 2025


What stock market sentiment really tells you
Stock market sentiment reflects how investors feel about the market’s direction. Unlike fundamental analysis (which focuses on valuation, earnings, and macro factors) or technical analysis (which studies price and volume patterns), sentiment analysis seeks to understand emotional positioning.
What reading stock market sentiment can tell you is: are investors greedy, fearful, cautious, euphoric, or indifferent?
Understanding market sentiment can provide a contrarian edge, especially at emotional extremes when market participants tend to make poor decisions.
How to use the AAII Investor Sentiment Survey
What is the AAII Investor Sentiment Survey?
The American Association of Individual Investors (AAII) Investor Sentiment Survey measures the outlook of U.S. retail (non-professional) investors on the direction of the stock market over the next six months.
Never miss a post.
Sign up to get instant notifications when we publish a new post.
Each week, thousands of self-directed individual investors respond to the following question: Do you feel the stock market will be higher, lower, or the same six months from now?
Participants can select one of three options:
- Bullish: Expecting stock prices to rise.
- Neutral: Expecting little to no change.
- Bearish: Expecting stock prices to decline.
This market sentiment survey is a pure sentiment gauge, uninfluenced by price action or news flow, and reflects investor expectations rather than behavior (i.e., not whether they are actually buying or selling).
How does the AAII Survey Work?
The survey is conducted online from Thursday at 12:01 AM to Wednesday at 11:59 PM each week and results are published every Thursday morning at 9:30 AM ET on the AAII website.
The data includes both the weekly percentage breakdown of responses and historical averages, providing context on current sentiment vs. long-term norms.
When looking at the historical average, market sentiment breakdown looks like this:
- Bullish: 37.5%
- Neutral: 31.5%
- Bearish: 31.0%
Keep in mind that market sentiment is usually bullish-biased when analyzing the displayed values.

How to read and apply AAII market sentiment data
The AAII survey is widely used by professional traders and analysts as a contrarian indicator. The logic:
- When retail investors are overwhelmingly bullish, much of the “buying power” may already be exhausted, increasing the risk of a pullback or correction.
- When sentiment becomes excessively bearish, retail investors may have already sold, and the market may be primed for a rebound.
Extreme readings often correlate with inflection points and can signal when the market will bottom or top:
- Bullish sentiment above 50–55% for multiple weeks has often preceded short-term peaks.
- Bearish sentiment above 50% has historically occurred near market bottoms, particularly when paired with rising volatility and declining price breadth.
The AAII Investor Sentiment Survey can also be used as an emotional bias measurement.
- Retail investors tend to be more emotionally reactive, buying when markets are rising and selling during fear-driven drops.
- This lagging behavior means the AAII survey can act as a delayed sentiment signal, helping astute traders position against the herd.
How the CNN Fear & Greed Index measures emotion
What is the CNN Fear & Greed Index?
The CNN Fear & Greed Index is a composite sentiment indicator designed to track the emotional state of the broader U.S. stock market. It analyzes seven distinct market-based inputs spanning technical, volatility, and behavioral dimensions to assess whether investors are feeling greedy (risk-on) or fearful (risk-off).
Rather than relying on opinion polls, the index captures real-time data from the market itself, reflecting how investors are behaving, not just what they say they feel.
- Market Momentum: The S&P 500’s position relative to its 125-day moving average – A market trading well above its long-term average reflects optimism and upward momentum; below it, fear and selling pressure dominate.
- Stock Price Strength: The number of stocks hitting 52-week highs vs. 52-week lows across major exchanges – Broad participation in new highs shows widespread bullishness; a surge in new lows despite stable indexes may warn of hidden weakness.
- Stock Price Breadth: The volume of advancing stocks vs. declining stocks on the NYSE – Healthy markets see strong breadth with most stocks participating; weak breadth signals narrow leadership, often seen before pullbacks.
- Put/Call Options Ratio: The volume of put options (bearish) relative to call options (bullish) – A high put/call ratio shows fear (hedging or speculation on declines); a low ratio shows speculative greed and complacency.
- Junk Bond Demand: The spread between junk bond yields and investment-grade yields – A high put/call ratio shows fear (hedging or speculation on declines); a low ratio shows speculative greed and complacency.
- Market Volatility (VIX): The CBOE Volatility Index, or VIX, which measures implied volatility in S&P 500 options – High VIX readings = panic and uncertainty; low VIX = investor calm or complacency. Often, very low VIX signals a potential top.
- Safe Haven Demand: Performance comparison of stocks vs. Treasury bonds over 20 days – If Treasuries are outperforming equities, investors are fleeing to safety (fear); outperformance of stocks indicates risk appetite and greed.
Each metric independently captures a different dimension of market psychology, helping investors gauge whether the broader environment is rational, emotional, or extreme.
How does the CNN Fear & Greed Index Work?
Each of the seven indicators is scored on a 0–100 scale, where:
- 0 = Extreme Fear
- 100 = Extreme Greed
The final index value is the equally weighted average of all seven components, updated daily on CNN’s website.
The final score range is given in an easy to read signal:
- Extreme Fear: 0-25
- Fear: 26-49
- Greed: 50-74
- Extreme Greed: 75-100

When to use the CNN Fear & Greed Index
The CNN Fear & Greed index is a multi-factor sentiment gauge. It combines both technical data (momentum, breadth), behavioral positioning (put/call ratio, junk bond spreads), and volatility (VIX).
Unlike singular indicators, it delivers a well-rounded and nuanced picture of market emotion.
Use this market sentiment index as a short-term timing tool. The CNN Fear & Greed Index is particularly useful for short- to medium-term traders looking to identify emotionally driven extremes that may precede reversals and corrections
- Extreme Fear (<25): Often corresponds with market bottoms, as panic selling peaks and valuations become more attractive.
- Extreme Greed (>75): Signals complacency or excessive optimism, which often precedes profit-taking or pullbacks.
Imagine the following scenario: The S&P 500 is up 8% in 3 weeks, and the CNN Fear & Greed Index is at 91. The market is overextended, optimism is peaking, and risk may be underpriced – A pullback or consolidation is increasingly likely.
What the NAAIM Exposure Index reveals about professional investors
What is the NAAIM Exposure Index?
The NAAIM Exposure Index is a weekly sentiment and positioning indicator published by the National Association of Active Investment Managers. It quantifies how professional money managers are positioning their portfolios in terms of net equity exposure to the U.S. stock market.
Unlike market sentiment tools such as the AAII Survey, which measure expectations or opinions, the NAAIM Exposure Index measures actual portfolio allocation decisions, making it one of the few sentiment indicators grounded in real-world capital deployment.
It acts as a real-time proxy for institutional risk appetite:
- How quickly are they rotating in or out of equities?
- Are managers risk-on (bullish) or risk-off (bearish)?
- Are they fully invested, hedging, or using leverage?
How does the NAAIM Exposure Index Work?
Each week, NAAIM members (professional managers overseeing client funds) report their net long or short exposure to U.S. equities as of market close on Wednesday.
Exposure values can range from:
- +200% → Fully invested + leveraged long (extremely bullish, aggressive use of margin)
- +100% → Fully long with no hedge (baseline long position)
- 0% → Market-neutral or fully hedged (no directional bias)
- -100% → Fully short the market (bearish stance)
- -200% → Leveraged short (high conviction bearish, rare)
The NAAIM Exposure Index is calculated as the average of all responses, with a 2-week moving average applied to reduce volatility and highlight meaningful trends.

How to use the NAAIM Exposure Index
Unlike surveys based on opinions, the NAAIM index reflects actual capital allocation by fund managers who are often seen as more informed and disciplined than retail investors. It becomes very powerful when used in conjunction with other sentiment and technical indicators, especially when it reaches extreme levels.
- High readings (>100%) can reflect institutional euphoria, particularly if managers are deploying leverage.
- Low readings (<30%) suggest risk aversion or fear, often observed during market declines or macro stress events.
Contrarian Indicator (at extremes)
- When NAAIM exposure rises above 100%, particularly alongside a high CNN Fear & Greed Index, it may reflect overheated bullish sentiment.
- When the index drops below 30%, especially during market declines, it may suggest maximum pessimism, offering a potential buy-the-dip signal.
Trend Confirmation
- Rising NAAIM exposure confirms increasing manager confidence in ongoing trends.
- Falling exposure may validate institutional risk-off rotation.
Volatility Filtering
- A sudden drop in NAAIM exposure may act as a canary in the coal mine, especially if not yet reflected in price.
- Inversely, rising exposure during a market pullback may signal that smart money is buying weakness.
Final thoughts on analyzing stock market sentiment
Market sentiment is like the mood of the crowd – it doesn’t drive fundamentals, but it can heavily influence short-term price action, volatility, and positioning risks.
Measure retail investor psychology over a 6-month time horizon with the AAII Investor Sentiment Survey.
Use the CNN Fear & Greed Index as a behavioral composite gauge of market emotion based on 7 technical/volatility metrics.
Interperet how professional money managers are positioned with the NAAIM Exposure Index.
Each sentiment tool offers unique insights, capturing different segments of the market ecosystem. The smartest traders and investors build a composite view by blending multiple sentiment indicators.
If NAAIM is >120%, CNN Fear & Greed >80, and AAII bullish sentiment exceeds 45%, this signals extreme optimism. The market may be overheating, and a contrarian might reduce exposure, hedge, or even consider tactical short positions.
Stock market sentiment analysis is not a standalone strategy, but when layered into a disciplined process, it helps you:
- Avoid traps: like chasing rallies driven by just a few names.
- Spot opportunity: when everyone else is panicking.
- Time entries/exits: more tactically and confidently.
- Manage risk: by gauging crowd behavior and institutional flows.
Whether you’re swing trading, position investing, or building long-term entries, these sentiment tools give you the context behind the chart.
Frequently asked questions
Related articles
Explore related educational content from the Lion’s Den.
-
-

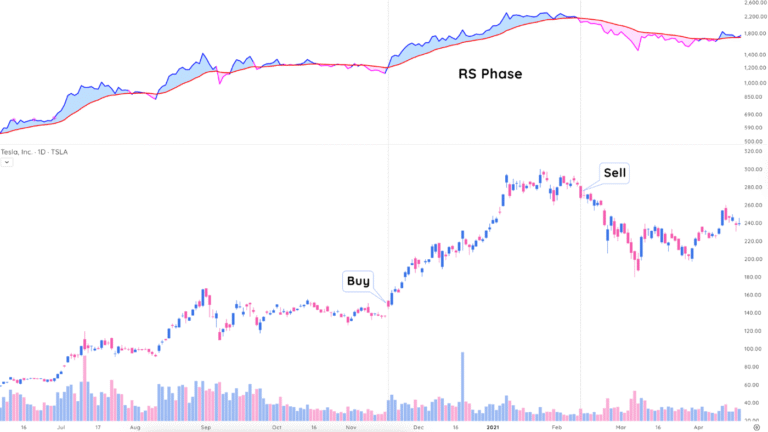
6 Ways to Use Relative Strength to Spot Market Leaders
August 12, 202510 min read -
How to Use the S.N.I.P.E. Framework to Improve Your Trading Edge
June 24, 20254 min read -
