How Top Traders Use the Equity Curve to Build Wealth and Avoid Blowups
Published: October 6, 2025
What is an Equity Curve and why does it Matter?
An equity curve (EC) is a visual graph that tracks the performance of your trading account over time. It plots your cumulative profit or loss, giving you a clear, honest view of how well (or poorly) you’re doing.
Think of it like a stock chart, but instead of tracking a company, it tracks you as the trader.
It cuts through the noise of day-to-day wins and losses. You might feel like you’re doing great because of one big win, but if your equity curve is flat or dipping, that win didn’t move the needle much. That’s why it’s such a powerful tool.
Here’s why it matters:
- It tells the truth. The equity curve doesn’t lie. It reflects your actual results, not your feelings.
- It helps you time your aggression. When your curve is rising, it’s usually a sign you’ve got momentum, so you can size up your trades.
- It helps you recognize danger. If the curve is flat or falling, it may mean it’s time to pause, review your setups, and tighten your risk.
A healthy EC isn’t just upward – it moves in a stair-step pattern: rising during strong markets, flattening during pullbacks, and avoiding deep drawdowns. If your goal is long-term growth, your equity curve is your most honest feedback loop.
How To Use Your Equity Curve to Analyze Performance
We go deeper than most when it comes to equity curves. It’s not just a graph to check – it’s a visual for decision-making.
Success in trading is a mix of what you can control (like trade execution, stock selection, and position sizing) with what you can’t control (like market trends, volatility, and your win rate).
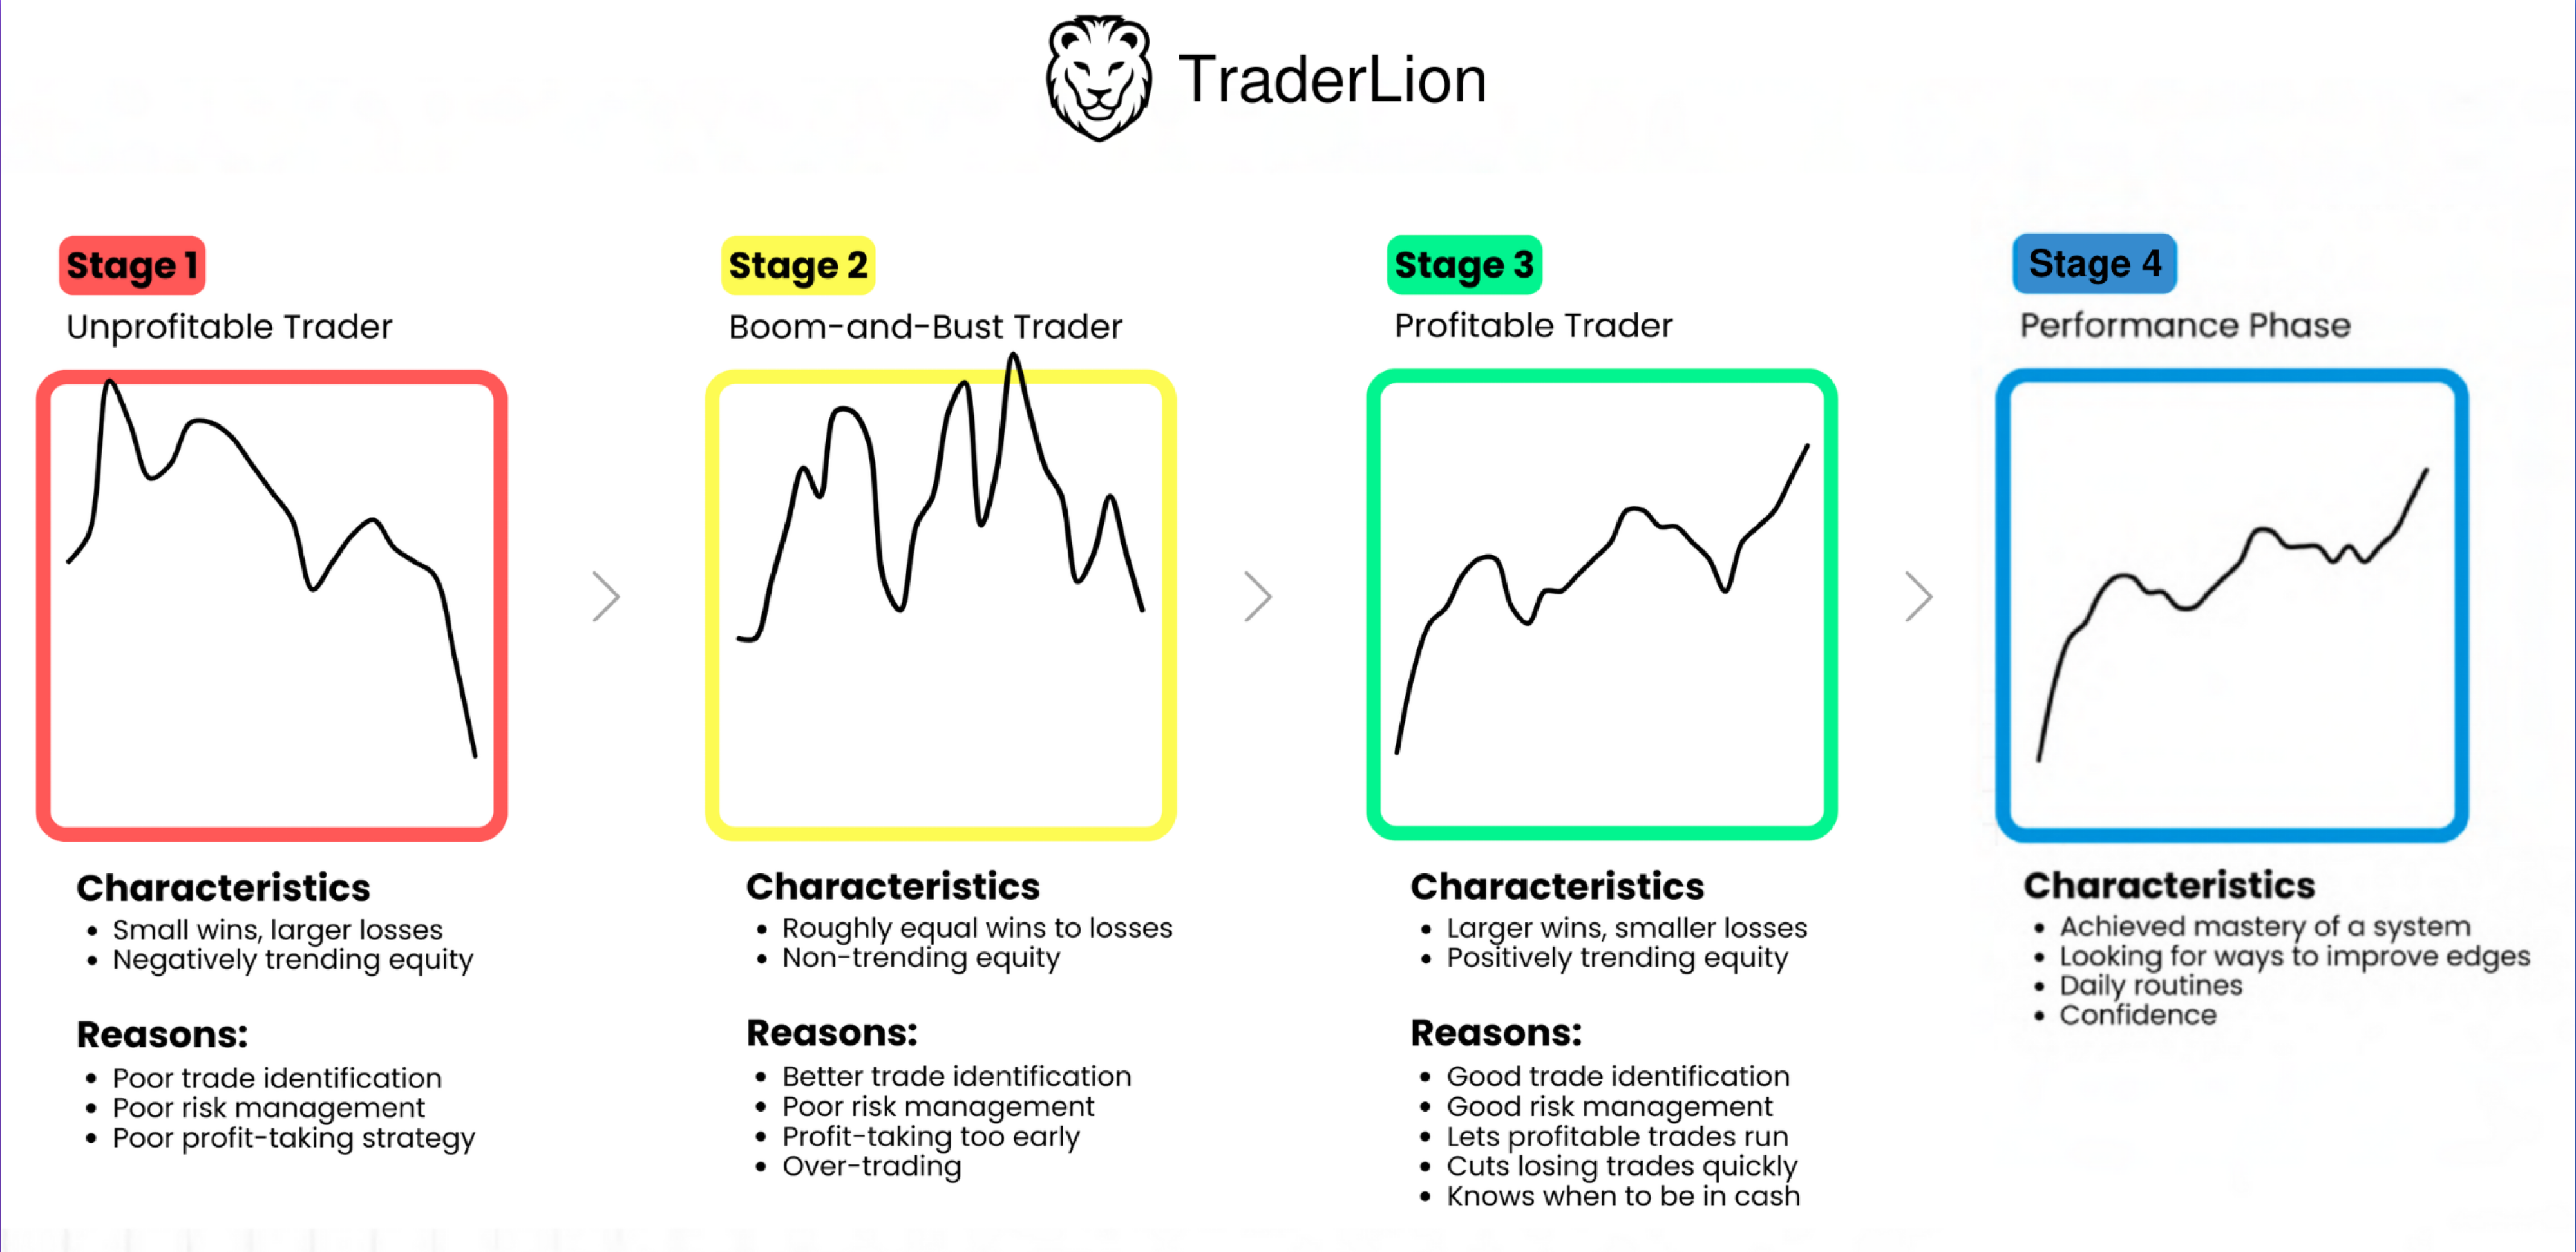
Use this guide to help determine where you are in your trading journey:
- Unprofitable Stage:
Most traders start here. The equity curve often trends downward as beginners make common mistakes like chasing trades, poor entries, and oversized positions. Losses stack up fast. - Boom & Bust Stage:
In this stage, the curve swings wildly. Traders hit some big wins, but give it all back and then some. The root cause? Inconsistent setups and weak risk management. This phase often feels like a rollercoaster. - Consistency Stage:
The curve starts to smooth out. Losses are smaller and wins are more frequent. Traders begin to follow a process and apply discipline. They stop chasing every setup and focus on quality over quantity. - Performance Stage:
This is where experienced traders live. The curve trends steadily upward. They know their setups, manage risk tightly, and adapt to market changes in real time. The account grows in a more predictable and sustainable way.
Your equity curve is your mirror. It reflects not just your trades but your habits, discipline, and ability to adapt.
What Your Equity Curve Reveals About Your Trading
Your equity curve is a window into your trading behavior and your system’s effectiveness. When you understand how to read it, you can catch problems early and double down when things are working.
Here’s what to look for:
Trending upward
A steadily rising curve means you’re aligned with the market and executing well. Your setups are working, your risk is under control, and you’re letting winners run.
This is when you can afford to be more aggressive – scaling up position sizes or taking more high-conviction trades.
Drawdowns
Drawdowns are normal, but they matter. A drawdown is the drop from your equity curve’s high point. If your drawdowns are sharp or frequent, it could be a sign of:
- Taking trades without clear setups
- Poor risk-to-reward ratios
- Overtrading during choppy market conditions
- Letting losers run without stops
Tracking the size and frequency of drawdowns helps you make smarter adjustments, like reducing size or taking fewer trades.
Flat periods
Flat curves aren’t always bad. If the market is weak or sideways and your curve is flat, that’s a win – you’re avoiding losses by staying selective.
But if the market is trending and your equity curve isn’t? That means you’re either too conservative or missing quality opportunities.
Market alignment
A strong trader’s equity curve tends to match the market. In uptrending markets, your curve should rise. In bear or choppy markets, it should flatten.
If your curve declines while the market is bullish, it’s a major red flag – something’s off with your strategy or execution.
By paying attention to these patterns, you can diagnose exactly where you are in your development and what changes to make next.
How to Manage Your Equity Curve With Purpose
Your equity curve isn’t just for observation – it’s a tool for action. Use it to guide your decisions, improve your strategy, and stay in sync with the market.
Identify your current trading stage
Figure out where you are based on your curve:
- Declining curve? You’re likely still learning – cut size and focus on one or two core setups.
- Wild swings? You’re in Boom & Bust mode. Your goal here is to develop discipline and structure.
- Smooth upward curve? You’ve built consistency – now you can carefully scale what’s working.
- Steep, steady rise? You’re in the performance zone – keep doing what’s working while staying cautious.
Self-awareness helps you make better decisions in real time.
Improve your risk management structure
A choppy or declining curve is often a risk issue. Build a solid foundation by focusing on:
- Position sizing: Don’t bet the same on every trade. Size up when you’ve got multiple confirming signals.
- Volatility filtering: When markets are choppy, reduce your trading or switch to lower-risk setups.
- Logical stops: always set stops based on support/resistance, but tighten restrictions when in a drawdown.
These small changes reduce the size of your drawdowns and make your equity curve smoother.
Focus on high-probability setups
Random trading leads to random results. By narrowing your focus to just a few high-probability setups, you reduce noise and increase consistency. You’re not just hoping anymore—you’re following a repeatable process that works.
Sticking to your process by taking only the best trades will keep your EC rising in ideal conditions and flat in declining markets. Be strict with your stock selection when your equity curve begins to decline.
Take partial profits to protect your gains
You don’t always have to hold for the home run. Taking partial profits helps you:
- Lock in gains
- Lower emotional pressure
- Avoid full round-trips on winning trades
This supports a steady, upward equity curve and boosts confidence during volatile periods – you are always selling when your EC is at new highs.
Keep a trading journal
Journaling is one of the most underrated tools. By tracking your trades – what you saw, why you entered, how you managed it – you build self-awareness. Over time, patterns emerge:
- Which setups work best?
- When do you tend to overtrade?
- How do market conditions affect your results?
That insight leads to smarter tweaks to your system. Do more of whatever makes your EC rise, and less of anything during its declines.
Adapt to market conditions
Market conditions change, and your trading should too. When the market is strong, lean in. Trade more, size up, and take more setups.
But when things turn choppy or bearish, protect capital. Trade smaller, sit out more, and focus on capital preservation.
Remember: flat is better than down. When the market is trending higher, your EC should be too. When the market is declining, keep your equity curve flat.
How to Plot Your Equity Curve With Moving Averages Like a Stock Chart
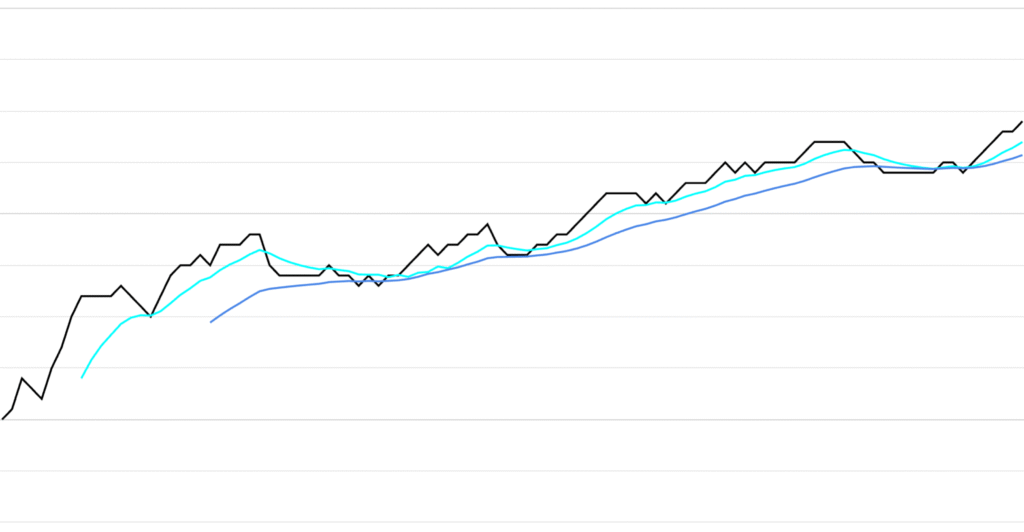
If you really want to take control of your performance, treat your equity curve like a stock chart – because that’s exactly what it is: a price chart of your trading results over time. Just like you’d analyze a stock using moving averages, you can apply the same approach to your equity curve to better time your aggression or defense.
Why use moving averages on your equity curve?
Moving averages smooth out short-term fluctuations and help you spot the true trend of your trading performance. Adding a 10-day or 20-day moving average (EMA or SMA) to your equity curve shows whether your account is trending up, flat, or turning down.
This gives you clear, data-driven signals about your own performance and results.
What to look for on your equity curve chart
Think of your EC the same way you look at a quality growth stock:
- Equity curve above a rising moving average?
That’s your green light. You’re in an uptrend. Your strategy is working, you’re executing well, and now’s the time to get aggressive. Increase your position size on high-conviction setups and lean into the momentum. - Equity curve below a declining moving average?
That’s a warning sign. You’re in a downtrend. It’s time to reduce risk, size down, and get defensive. Avoid forcing trades and focus on capital preservation. - Equity curve pulling back or going flat into a rising moving average?
That’s ideal. Just like a stock consolidating before the next move up, your EC is resetting. Don’t panic. Stay patient. This is where solid traders hold the line, wait for clean setups, and prepare for the next leg higher.
Final Thoughts on Mastering Your Equity Curve
Your equity curve is more than a report card. It’s a roadmap. It shows how your system is performing, how you’re handling different market conditions, and where you need to adjust.
You don’t have to be perfect. You just need to stay consistent and keep improving.
- Trade aggressively when your curve is rising.
- Scale back when it flattens or drops.
- Review your trades often.
- Let your data, not your emotions, drive decisions.
In the long run, your goal is a smooth, upward-trending curve – one that mirrors a well-performing growth stock. And just like investing, success comes from disciplined, informed action over time.


