Market Overview
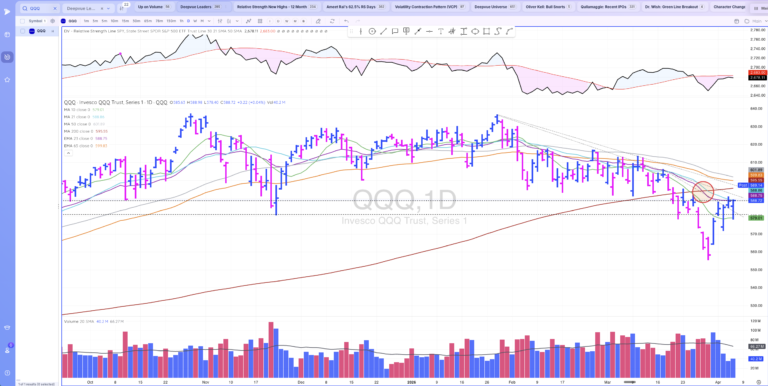
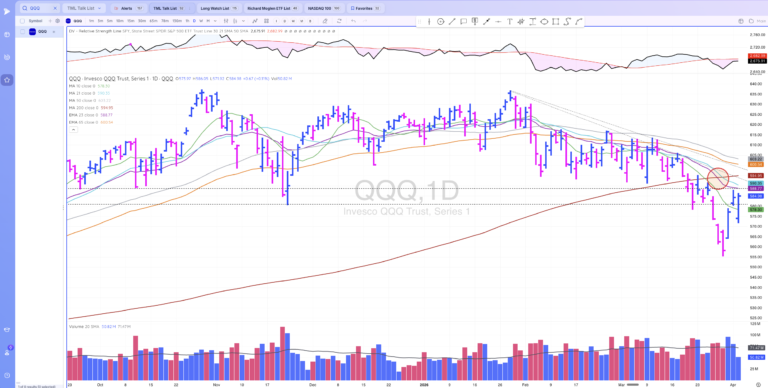
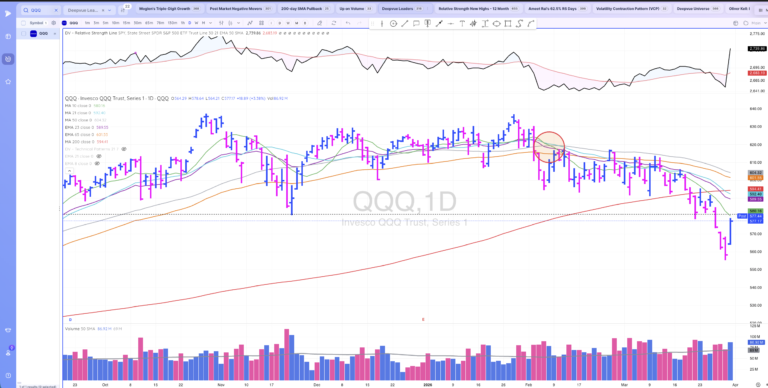
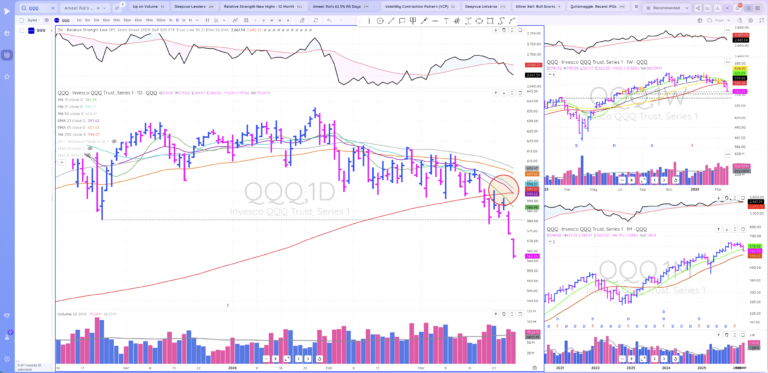
Major indexes have entered correction territory with the QQQ spending five consecutive days under the 50-day moving average and now trading below the 65-day as well. The NASDAQ and S&P 500 are both below their 50-day moving averages, signaling a clear shift to a corrective environment. Prior leadership themes including semiconductors, AI, quantum computing, space, and aerospace and defense have either moved sideways or rolled over significantly, with many quantum names taking particularly heavy losses while larger, slower names hold up closer to their 50-day moving averages.
Rotational dynamics reveal an unusual divergence where biotech and pharmaceutical stocks represent the only groups demonstrating constructive technical action, operating in what amounts to a private bull market while broader indices deteriorate. A small group of medical equipment stocks also shows relative strength. However, this narrow leadership concentration raises significant sustainability concerns, as most biotech names lack earnings and cannot anchor a durable market advance. The fundamental principle that high-growth groups with actual revenues must lead for a bull market to be sustained remains violated in current conditions.
Leadership characteristics have fundamentally shifted from the April rally environment. During April, stocks like Netflix broke out to new all-time highs on earnings and followed through, while Tesla went up on bad earnings—both signals of underlying strength. Current conditions show the complete opposite: NVIDIA sold off on good earnings, Hood sold off after earnings, PLTR sold off after earnings, and Spotify sold off. This pattern of good news being used as selling opportunities rather than accumulation represents the most significant red flag in the current environment. The market requires time at minimum, with groups of institutional-quality stocks needing to form constructive patterns simultaneously before any follow-through day would warrant meaningful commitment.
Key Lessons & Quotes
“Watch the leaders. I can’t say it enough. That tells me every time.”
“The game is 70% fundamentals, 30% charts.”
“If I can find three to five of your top relative strength CAN SLIM style stocks starting to form constructive patterns… you’ll start to see where the money is gonna go for the follow-through day.”
“Wide and loose bad. Tight narrow good. Big blue good, big red bad.”
“In 2008, my hedge fund was up because I followed William O’Neil’s rules. The leaders disappeared… it gave you forever before the market rolled over of there was not a darn stock to buy.”
Actionable Takeaways
- Monitor weekly chart moving average slopes as key indicators of trend health—when the 10-week starts curling down and price fails to make new highs after touching the 30-week, that represents a major warning signal
- Evaluate follow-through day quality by assessing whether institutional-quality leaders are simultaneously forming constructive patterns; even technically valid follow-through days fail without corresponding breakout opportunities
- Recognize characteristic shifts as primary market signals: stocks selling off on good news indicates distribution, while stocks rising on bad news signals accumulation—this is more important than price levels
- Assess market tradability by measuring daily range compression and overnight gap frequency; the April environment had tight ranges and few gaps, while current conditions show wide daily ranges and gaps nearly every night
- Look to the left on monthly charts to identify green line breakout opportunities—stocks approaching all-time highs may be building stage one bases despite appearing late-stage on daily timeframes
- Wait for groups of stocks to set up again before committing capital; position traders should remain in cash with indexes below the 50-day and no clear leadership outside of speculative biotechs
- Use big liquid leaders like Tesla and PLTR as gauges for market health—their behavior relative to basing structures indicates whether the environment supports new positions
Stock Mentions and Commentary
Technology Hardware & Semiconductors
| Ticker |
Setup Description & Key Themes |
NVDA |
Structurally intact—still above 30-week moving average and prior base; Sold off on positive earnings representing negative characteristic change; If breaks down below 30-week would be disastrous for broader market |
TSLA |
Broke out of five-year-plus base on monthly chart, then retested and closed back inside; Using as market gauge given thematic tailwinds; Has every reason to go up but living below breakout level is concerning |
WDC |
Storage sector just beginning to break down with significant air underneath; Part of group including Micron and Seagate that may drag market lower |
MU |
Memory semiconductor in early breakdown phase alongside storage peers; Represents last holdouts starting to deteriorate |
STX |
Storage sector showing early breakdown characteristics alongside WDC and MU; Group has lot of air underneath if selling continues |
Software & Technology Services
| Ticker |
Setup Description & Key Themes |
PLTR |
Major April leader—last breakout failed and pulled back but bounced at lows of basing area; If holds within base during correction shows relative strength; Sold off after earnings despite good results |
GOOGL |
One of few large-cap names still holding up technically; Best thing that can be said about benchmark leadership currently |
Communication Services
| Ticker |
Setup Description & Key Themes |
NFLX |
April leader that first signaled market turn by gapping through all-time highs on earnings and following through; Now breaking below potential double bottom support with 10-week curling down; Failed to make new high after 30-week touch—major warning |
SPOT |
Sold off on news alongside broader leadership deterioration; Example of current negative characteristic environment |
Financial Services
| Ticker |
Setup Description & Key Themes |
HOOD |
Pulling back to green line breakout on monthly chart—may be just breaking out of giant stage one base; Daily shows base-on-base stair-step pattern; Sold off after earnings representing negative characteristic |
DAVE |
First stage base off major bottom approaching all-time high green line breakout; Had shakeout to top of prior consolidation which helps clean up pattern; If group participates when market turns, will break out |
Healthcare & Biotechnology
| Ticker |
Setup Description & Key Themes |
AMGN |
Benchmark biotech leader—big, high-quality institutional name near highs with revenues in billions; Slow-moving but represents best quality in only working sector; Insufficient alone to lead sustainable market advance |
TEVA |
Pharmaceutical with actual sales and profitability unlike most biotech peers; Higher quality within working sector; Still a stretch to call these benchmark leaders |
Consumer Discretionary
| Ticker |
Setup Description & Key Themes |
UBER |
April leader that broke out and led higher off the lows; Now breaking below key support—example of prior leadership deterioration |
APP |
Example of powerful green line breakout to all-time highs; Monthly perspective shows early stage characteristics despite daily appearing later-stage |
Energy & Utilities
| Ticker |
Setup Description & Key Themes |
GEV |
Perfect base—multi-month basing pattern near highs with very organized structure; Tried three to four times with stops hit each time; Priority candidate if tape improves but will follow market lower if correction accelerates |
Aerospace & Industrial
| Ticker |
Setup Description & Key Themes |
RKLB |
Space theme leader showing trend stopper candle on weekly chart; Big down weeks indicate uptrend paused at minimum—needs time to repair regardless of direction |
WOLF |
Exhibited large trend stopper weekly candle; Historical pattern shows such candles lead to extended chop or downtrend rather than immediate recovery |
Information Technology
| Ticker |
Setup Description & Key Themes |
RGTI |
Quantum theme name that has already broken down in a big way; Example of speculative leadership deterioration preceding broader market weakness |
META |
Showing trend stopper candle pattern not seen in extended period; Requires time for chart repair |
DASH |
Exhibited big down week trend stopper candle; Pattern historically leads to extended consolidation before any resumption of trend |