4 Key Types of Stock Gaps Every Trader Should Know
Published: December 9, 2025
[kt_reading_time]


Stock gaps are powerful signals that reveal sudden shifts in market sentiment. Understanding the four key types of gaps—common, breakaway, runaway, and exhaustion—can help you spot high-conviction opportunities and avoid costly traps.
What Are Stock Gaps and Why Do They Matter?
Stock gaps occur when a stock opens much higher or lower than where it closed the day before. This creates a visible gap on the price chart—like a blank space where no trading happened. Gaps usually form because of news or events that break outside normal trading hours, like earnings reports, mergers, or major economic updates.
Think of it like this: you go to sleep with a stock priced at $100. The next morning, it opens at $110. That $10 “jump” creates a gap—like the market skipped a beat while you were asleep.

A stock gap creates a visible “blank space” on the chart where no trading occurred
Why Gaps Matter to Traders:
- They reveal market emotion: A gap up shows optimism; a gap down signals fear or disappointment
- They can offer trading setups: Gaps are often used in technical trading strategies for entries and exits
- They help confirm trends: Some gaps suggest a trend is starting or gaining steam, while others warn that a move is running out of fuel
Why Do Stock Gaps Form?
Stock gaps are all about unexpected news or sudden changes in sentiment. Here’s how they usually play out:
Gap Up
A gap up happens when a stock opens higher than its previous close. It usually signals strong buying interest—investors are excited.
- Better-than-expected earnings
- FDA approvals or positive trial results
- Mergers and acquisitions
- Positive economic news or global tailwinds
Gap Down
A gap down is the opposite. The stock opens lower than it closed. These are red flags, and investors react by selling fast.
- Missed earnings or weak forecasts
- Lawsuits or regulatory issues
- Bad economic data or geopolitical shocks
Why Volume Is Key When Trading Stock Gaps
Not all gaps are created equal. What really matters is volume.
High volume gap? That’s real. It shows strong interest, often from institutions like hedge funds or mutual funds.
This ties into the CANSLIM method, where the “S” stands for supply and demand. Heavy demand (high volume) during a gap can signal a powerful trend starting.
How Gaps Affect Stocks vs. Indices
Gaps hit individual growth stocks like NVDA or TSLA more dramatically. These companies can jump or drop double digits overnight. But you’ll also see gaps on major indexes like the S&P 500 or Nasdaq, especially around:
- Federal Reserve announcements
- Big tech rallies
- Major macroeconomic shifts
These broader gaps often point to bigger market trends that affect the entire trading landscape.
4 Types of Stock Gaps and How to Trade Them
Not all gaps mean the same thing. Understanding the type of gap can help you decide whether to trade it or stay away. Here’s your complete guide to the four main gap types:
Common Gaps
Noise Inside the Trading Range
Common gaps are the most frequent type. They occur during normal price fluctuations within a stock’s recent trading range. There’s usually no major news driving them, and they rarely have a lasting impact. Think of them as background noise on the chart.
How to Trade Common Gaps
Traders usually pause here, meaning they wait for more clues. Since there’s no strong reason behind the gap, it tends to lose momentum as traders wait to see what may happen next.
Traders who are already long may begin selling their position into strength to lock in gains. Other traders discover strong price action on relative strength screeners, but wait to begin buying on future weakness when the price pulls back into support.
A stock trading between $45–$48 for weeks suddenly opens at $48 on no real news. It drifts back down during the day to close the gap. A stronger stock will close near the highs above the previous close, while a weaker stock will close near the lows inside the previous day’s range.

RDDT showing common gaps within a trading range that typically fill quickly
Bottom Line: Common gaps are rarely worth chasing. They offer quick, short-term setups for experienced traders but don’t signal much for long-term investors.
Breakaway Gaps
The Start of Something Big
Breakaway gaps are the exciting kind. They form when a stock breaks out of a key support or resistance level—often after a long consolidation period or technical setup. These gaps are driven by major catalysts and show strong conviction from institutional investors.
How to Trade Breakaway Gaps
These are buy signals, especially if the volume confirms strong demand. Many traders enter positions right after the gap and place stop-losses near the bottom of the gap (or prior resistance).
Look for gaps breaking out of clear chart patterns (like cup-with-handle or consolidation zones) on heavy volume. That’s where the highest probability setups live.

APP showing a textbook breakaway gap on massive volume, launching a new uptrend
Bottom Line: Breakaway gaps often mark the beginning of big moves. These are high-conviction moments—don’t ignore them.
Runaway Gaps
Momentum Mid-Move
Runaway gaps (also called measuring gaps) happen in the middle of an existing trend. They confirm that the trend is strong and gaining steam. These gaps are often caused by continued good news or growing investor interest, not necessarily a single catalyst.
How to Trade Runaway Gaps
If you’re already in the trade, these gaps say: “Stay in.” They’re a sign the trend isn’t over. If you’re looking to enter, they can offer a second-chance entry with a proper stop-loss just below the gap.
Measuring gaps often appear halfway through a trend. Some traders use the size of the first move to estimate the potential length of the second leg.

NVDA showing a runaway gap mid-trend, confirming strong momentum and institutional demand
Bottom Line: Runaway gaps say, “The trend is healthy.” Use them to manage your position—not as late-entry FOMO triggers.
Exhaustion Gaps
Last Gasp Before Reversal
Exhaustion gaps are dramatic—and potentially dangerous. They occur at the tail end of a strong trend, usually when late buyers or sellers rush in, only to get trapped. These gaps feel like breakouts at first, but they quickly reverse, leading to sharp pullbacks or even full trend reversals.
How to Trade Exhaustion Gaps
These are sell or short signals. If you’re holding a stock that gaps up after a huge run, it may be time to lock in profits. If you’re a short-term trader, look for signs of weakness to fade the gap.
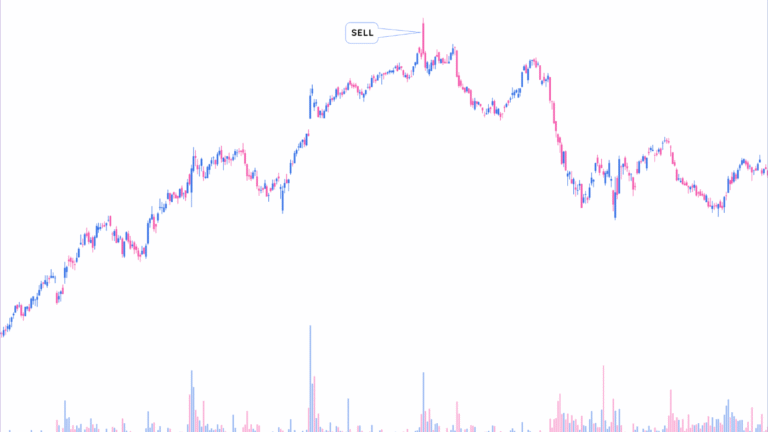
A stock rallies 40% in two weeks and then gaps up another 10% at the open—only to close flat or negative by the end of the day. Volume is huge, and the move reverses the next session. That’s a textbook exhaustion gap.

PLTR showing an exhaustion gap at the end of an extended run—a classic reversal signal
Bottom Line: Exhaustion gaps are the end of the run. Don’t chase them. Learn to spot them and trade the reversal.
Final Thoughts: How to Use Stock Gaps to Your Advantage
Stock gaps are more than just empty spaces on a chart—they’re real-time signals of market psychology, emotion, and conviction. Whether it’s excitement over blowout earnings or panic after a regulatory blow, gaps tell a story. The key is learning how to read that story—and knowing what kind of gap you’re dealing with.
Quick Reference Guide:
- Common gaps are usually meaningless noise inside a trading range. Don’t overreact.
- Breakaway gaps are powerful signals that a new trend is beginning. Smart traders strike early.
- Runaway gaps confirm that a trend is healthy and gaining momentum. Use them to hold winners longer.
- Exhaustion gaps warn that a move is likely over. If you’re late to the party, you could get burned—fast.
If you’re going to trade gaps, always read them in the context of volume and the broader chart pattern.
“Gaps offer a rare glimpse into crowd behavior. They expose the extremes—greed, fear, and overconfidence. Understanding this can give you a real edge, especially when combined with technical setups and sound risk management.”
Whether you’re a short-term trader, a swing trader, or even a long-term investor trying to fine-tune your entries, gaps can help you spot high-conviction buying opportunities, avoid buying tops or selling bottoms, time exits with more precision, and stay in trends longer—or get out before the crash.
You don’t need to trade every gap. The best traders are selective. They know when to lean in and when to step aside.
Key Takeaways
Frequently Asked Questions
Related articles
-
-
Finding Your Trading Edge: Proven Setups That Work
July 22, 2025[kt_reading_time] -
Handling a Gap Down: 3 Ways to Protect Your Account
July 11, 2025[kt_reading_time] -
Stock Topping Process: 5 Signals to Warn The Uptrend Ended
July 4, 2025[kt_reading_time]