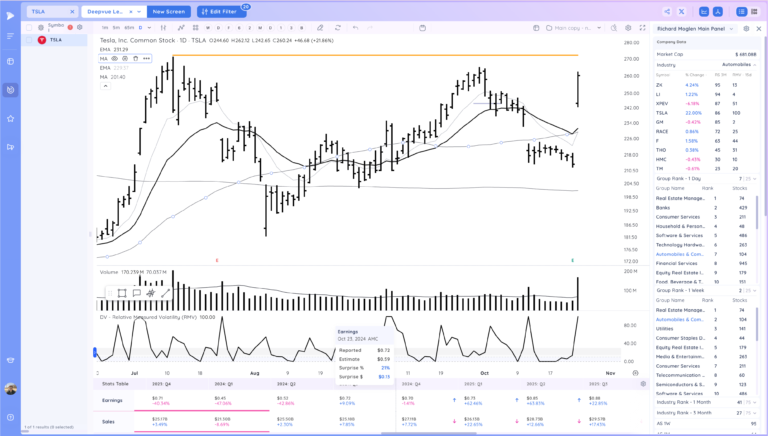
+21% TSLA Earnings Gap

Richard Moglen
Stock Trader & Student of the Markets. I help traders improve their systems & performance at TraderLion & Deepvue
October 24, 2024
[kt_reading_time]


Market Action
QQQ – we held the key level – 21ema – now we’ll see if we close the week above it.
Short Term Expectation based on the close is consolidation
Bulls want to see us build near the 21ema or have a quick snapback to close the week strongly
Bears want to see us follow through down and close the week below the 21ema

IWM – upside reversal type day just below the 21ema

Trends (3/4 Up)
Shortest – 10 Day EMA – Above Rising
Short-term – 21 ema – Below Declining
Intermediate term – 50 sma – Above Rising
Longterm – 200 sma – Up – Above Rising
Never miss a post from Richard Moglen!
Stay in the loop by subscribing.
Starts soon! – Don’t miss the High Tight Flag Masterclass with Leif Soreide!
We are hosting a High Tight Flag Masterclass with Leif on Nov 2 and Nov 9. Leif will be sharing his full process for Identifying, entering, and exiting these high potential setups, which can dramatically improve your performance.
- Learn advanced alternate entries to manage risk while trading high momentum growth stocks
- Learn Leif’s sell rules to maximize returns
- Learn Leif’s personal screening and trading routines

You can join hundreds of traders and register using the button below. Live spots are limited!
Groups/Sectors – % Change
From yesterday’s close on the left, from today’s open on the right

Performance Charts from Deepvue
S&P 500

Deepvue Leaders Heatmap

Heatmap from Deepvue
Group Ranks: 1 Day, 1 Week, 1 Month, 3 Month from left to right

Key Stocks in Deepvue
TSLA strong earnings gap – estimate revisions are up. Still a choppy overall pattern

NVDA inside day above the pivot supported at the 10ema

META weaker, tight day after the reversal down

AAPL similar to meta, can it build here above the 50 day

MSTR has been perhaps the strongest stock following through up today

GGAL reconfirming up

GEV nice action post earnings

MNDY positive expectation breaker and push through the tight area

COIN good action just below the pivot

ALAB bit of follow through

RBRK in the handle

HOOD tight after the breakout

CEG tight against the 21ema, low volume

VST same story

DOUR last pullback to the 21ema before breaking 100?

MIR flagging into the 10 ema

WVE flagging

SG tight on right side

WOLF if semis take off

TSM inside day

RDDT flagging out here

UPST squat today, liekly still sets up a good swing trade opp. See if it builds here or follows through down

DUOL tight on the 21ema

MELI still consolidating right above highs

SMR flagging above the base pivot

Market Thoughts
Interested to see how we close the week, good response today to yesterday which sparked a lot of fear.
Day by Day – Managing risk along the way