MSTR +11% as Bitcoin Pushes Out

Richard Moglen
Stock Trader & Student of the Markets. I help traders improve their systems & performance at TraderLion & Deepvue
October 18, 2024
[kt_reading_time]


Market Action
QQQ – Gap up and inside day, closing the week coiled
Short Term Expectation based on the close is consolidation
Bulls want to see us breakout higher or drift sideways
Bears want to see us follow through down undercutting the 21ema

IWM – ends the week in a range

Trends (4/4 Up)
Shortest – 10 Day EMA – Above Rising
Short-term – 21 ema – Above Rising
Intermediate term – 50 sma – Above Flat
Longterm – 200 sma – Up – Above Rising
Never miss a post from Richard Moglen!
Stay in the loop by subscribing.
Free VCP / Trading Tight Areas Webinar
I will be presenting on how to trade VCPs/Tight areas tomorrow at 11am EST.
I will be showcasing how I use RMV to find these easily in screens and when sorting ideas. With many case studies and examples
You can register using the button below. Live spots are limited!
Groups/Sectors – % Change
From yesterday’s close on the left, from today’s open on the right

Performance Charts from Deepvue

Deepvue Leaders Heatmap

Heatmap from Deepvue
Group Ranks: 1 Day, 1 Week, 1 Month, 3 Month

Key Stocks in Deepvue
NVDA tightening below highs, another week in a handle + a shakeout would make this setup better.

IBIT breakout on positive expectation breaker

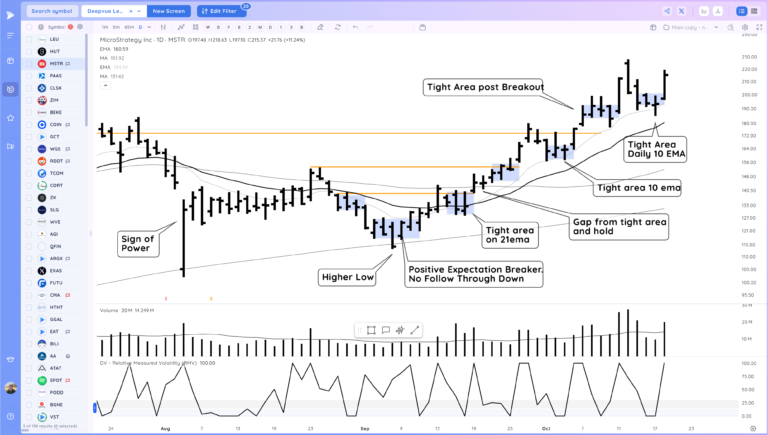
MSTR follow through up from upside reversal at the 10ema

HUT breakout

PAAS breakout

COIN powerful move

RDDT new highs

CORT push this week from 10ema shelf

VST upside reversal, ideally builds out more

ZIM gap and go from range

HIMS upside reversal, watching for follow through

UPST Flagging, post breakout

HOOD similar, 10ema catching up
APP tight again

ALAB ideally builds out and lets 21ema catch up

CAVA tight and drifting higher, wedging a bit

MELI supported at the 21ema

SATS tight, likely moves early next week

DUOL extremely tight after strong trend up. Undercut and reclaim of this range and go?

RBRK, a shake to the 10 ema would be preferred, Straight off the bottom

PODD breakout

ARGX nice move to new highs, slower mover

WVE tight after RNA news catalyst

RKLB HTF breakout then tight, watching for reconfirmation

TEM fade back into the range

ASTS inside day or upside reversal would set this up nicely if you didn’t get the wedge pop. Can also just push higher off the 50sma

TSLA very tight, earnings next wednesday

META 21ema pullback

Market Thoughts
Good action to end the week.
Day by Day – Managing risk along the way