META Expansion – RDDT Breakout – Stock Market Ends Week on a High

Richard Moglen
Stock Trader & Student of the Markets. I help traders improve their systems & performance at TraderLion & Deepvue
October 4, 2024
[kt_reading_time]


Market Action
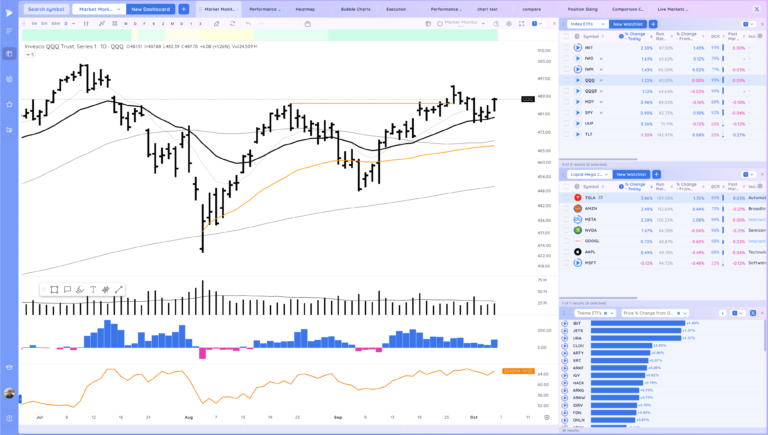
QQQ – Gap up, sharp drop and then a good close. Above the key level from weeks ago
Short Term Expectation based on the close is consolidation, continuation higher
Bulls want to see a break above the previous highs
Bears want to see us reverse lower and undercut todays low

IWM – Similar action, back above the 21ema

Trends (4/4 Up)
Shortest – 10 Day EMA – Above Rising
Short-term – 21 ema – Above Rising
Intermediate term – 50 sma – Above Flat
Longterm – 200 sma – Up – Above Rising
Never miss a post from Richard Moglen!
Stay in the loop by subscribing.
Powered by the Leif Soreide Hight Tight Flag Masterclass
We are hosting a High Tight Flag Masterclass with Leif next month. Leif will be sharing his full process for Identifying, entering, and exiting these high potential setups, which can dramatically improve your performance.

You can register using the button below. Live spots are limited!
Groups/Sectors – % Change
From yesterday’s close on the left, from today’s open on the right

Performance Charts from Deepvue

Deepvue Leaders Heatmap

Key Stocks in Deepvue
NVDA good close and some follow through up

META great action from the 10ema test

TSLA Gap and hold see how it acts next week

RDDT strong action. good push since 10ema pullback

MSTR strong push, gap, pull into prior close, and go

TEM one to watch next week. reclaim of 50 day and 21ema, no follow through down

TVTX nice move from 21ema pullback

ALAB positive expectation breaker after 21ema area retest

KGS energy has been strong, expansion from tight area

UPST strong move from tight area, see if it can follow through up

VST very strong action, but odds of a pause increasing

CEG strong push

GEV push from tight area.

TOST many times failed breakouts find support off the 21ema

DUOL 10 ema shelf

INTA at the 21ema, relatively weak recently

KVYO 10 ema shelf

VITL still in this shelf

AFRM at this key level, upside reversal

CORZ inside day

LLY tight area, strong estimates

ONON gap and go after 21ema test

ASTS strong push. RMV 0 yesterday

MELI relatively week but forming a range on the 50 day

IBIT follow through up, 21ema reclaim

UBER reclaiming this area & 21ema

Z reversal, still at the 21ema

Market Thoughts
Strong action to end the week. We’ll see if we follow through up
Day by Day – Managing risk along the way