4 Charts to Watch Tomorrow

Ameet Rai
Electrical Engineer and Swing Trader focused on achieving super-performance. Through extensive studies of previous super-performance stocks and proprietary data-based research I provide guidance for new traders with an emphasis on building processes and teaching traders how to think and trade for themselves.
Published: July 29, 2024


Written by: Ameet Rai
Never miss a post from Rai!
Sign up to get instant notifications when I publish a new post.
QQQ – The Qs remain below the 50-Day SMA. Nothing good happens below the 50-day, so continued patience is required to wait for the right pitch to hit a home run on. If you are lacking patience, the market will likely teach you in its own ways (experience over time) on why it’s best to stay on the sidelines as volatility increases.

IWM – Holds the 10 Day SMA today with the 21 Day rising. Pullback today on a orange bar on volume means it was on low volume which is a ++ (a positive sign).

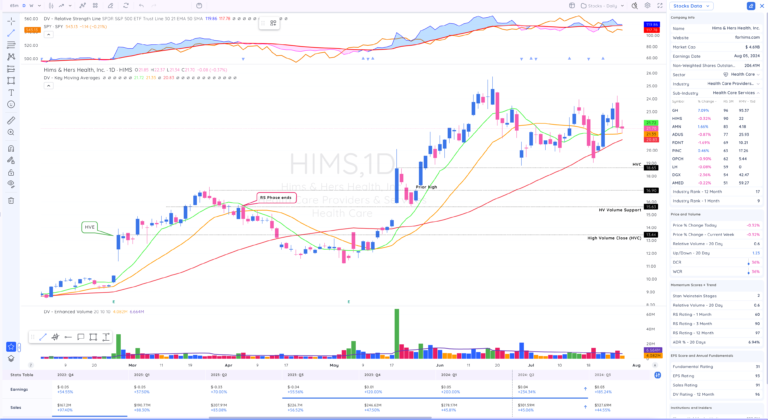
HIMS – HIMS holding the 21-Day SMA with volume drying up today is a subtle sign of accumulation. As the Qs trade below the 50 Day and HIMS above 21-Day that’s a clear sign of RS. It’s also showing up on the 62.5% RS Days screen (a huge positive).

PLTR – PLTR Weekly remains above the 10 Week Line as the market figures out its next move. It’s a key weekly area on the charts as its’s the prior distribution zone as a pause and catching up of the 10 Week Line is ideal action. Pullback in the prior week was on below average volume which is a subtle positive sign as well.

Related articles
-

-

-

How to Bottom Fish Stocks Without Getting Burned
September 10, 20246 min read -